
INTRODUCTION
The human kinome has become one of the most important classes of drug targets in the pharmaceutical industry [1-3]. So far, more than 20 drugs targeting one or more kinases have been approved for clinical use in a variety of cancers, including lung, breast, melanoma, colorectal, pancreatic, and prostate cancers [1,4,5]. Moreover, as of 2012, more than 500 kinase inhibitors have been used as therapeutic drugs, approximately a third of which are undergoing clinical trials [4,6]. However, patients treated with those kinase inhibitors eventually develop resistance, and their prolong survivals are typically only a few months [5,7-12]. One reason for resistance is that kinases are extensively involved in complex biological mechanisms through adaptive crosstalk or feedback within cellular networks.
Most kinases are proteins, while others are lipids or small molecules. There are more than 600 putative kinase genes that account for ~3% of human protein-coding genes [13]. The kinases catalyze the reversible phosphorylation of ~500,000 phosphorylation sites in ~20,000-22,000 human proteins, playing critical roles in human cells as well as other eukaryotic cells. Furthermore, kinases are involved in various key cellular signaling pathways, including transcription, cancer cell metabolism, cell cycle progression, apoptosis, and differentiation [2,4,13]. It has been estimated that more than 400 human diseases are caused by kinase signaling pathway defects (http://www.kinasenet.ca/). So far, more than 80% of kinases have been investigated as drug targets for therapeutic development. However, a quantitative network measurement of functional relationships among drugs, kinases, and the human protein interactome at the kinome level remains largely unknown. Constructing a global human kinase phosphorylation network and the human kinome interactome resource is therefore essential to further explore the relationship among drug responses, network properties, and cellular functions, thereby accelerating rational kinase inhibitor design for cancer therapy.
In this study, we developed a systems biology-based framework to construct a global human kinome interactome map by integrating the kinase-substrate interaction network (KSIN), kinase-drug interaction network (KDIN), physical protein-protein interaction network (PPIN), and atomic resolution three-dimensional structural PPIN (3DPPIN). We systematically examined and compared the network topological and functional properties of several important gene or protein sets in this global human kinome interactome. These sets include kinase genes, Mendelian disease genes (MDGs), orphan disease-causing mutant genes (ODMGs), Cancer Gene Census (CGC) genes, essential genes, anticancer drug sensitivity genes, drug target proteins, and adverse drug reaction-associated proteins (ADRPs). We identified the conserved regulatory phosphorylation motifs (e.g., Ser/Thr-Pro) using a sequence logo analysis, which provides the evidence that the proline direction of kinases is a crucial mechanism in the conserved phosphorylation signaling pathways. We found that the distinct network centrality (e.g., hubs) of kinases creates a high risk for the evasion of single kinase target inhibition by feedback or crosstalk mechanisms. This notion is further supported by the systematic network and pathway analyses that anticancer drug resistance genes are significantly enriched as hubs and heavily participate in multiple cancer signaling pathways. Furthermore, we provided the statistical evidence that the typical anticancer target selection strategy, which uses network hubs as drug targets, might lead to a high risk for adverse drug reactions. Collectively, this study sheds light on kinase inhibitor resistance mechanisms and provides an innovative systems biology resource for rational kinase inhibitor design in individualized cancer therapy.
RESULTS
We developed a systems biology-based framework (Figure 1) and used it to construct a global human kinome interactome map. The current version of the human kinome [13] includes 637 genes categorized into 10 groups: tyrosine kinases (TK), tyrosine kinase-like kinases (TKL), casein kinases (CK1), PKA/PKG/PKC-family kinases (AGC), calcium/calmodulin-dependent kinases (CAMK), sterile homologue kinases (STE), CDK/MAPK/GSK3/CLK-family kinases (CMGC), receptor guanylate cyclases (RGC), atypical protein kinases (Atypical), and kinases that did not belong to any group above (Other). After mapping them to the GeneCards and the National Center for Biotechnology Information (NCBI) [14] databases, 538 genes had official gene symbols and Entrez IDs (Supplementary Table S1). Figure 2A shows the distribution of these 538 kinase genes in 10 groups. Starting with these 538 kinase genes, we systematically constructed a global human kinome interactome map using the following data: a KSIN with 7346 pairs, a PPIN with 92,699 pairs, an atomic resolution 3DPPIN with 4278 pairs, and a drug-target interaction network with 13,582 pairs (Supplementary Table S1 and Figure 1). The collection of the human kinome and four networks is available at http://bioinfo.mc.vanderbilt.edu/kinomenetworkX/. Next, we systematically examined the topological features and functional relationships of these networks to better understand kinase inhibitor responses and molecular networks of the human kinome.
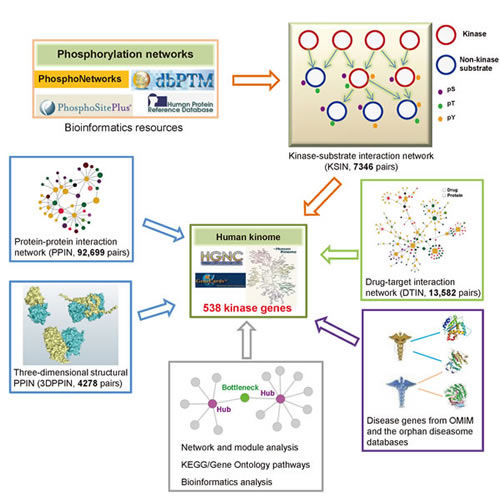
Figure 1: Diagram of systems biology-based framework for the human kinome interactome map building. This human kinome interactome map across 538 kinase genes includes five components: (i) kinase-substrate interaction network, (ii) physical protein-protein interaction network (PPIN) and an atomic resolution three-dimensional structural PPIN, (iii) drug-target interaction network, (iv) disease gene annotations, and (v) network, pathways, and bioinformatics analyses.
Functional mapping of the human kinome
We compared the 538 kinase genes with each of the following gene sets: 487 CGC genes, 1,855 known drug target proteins (genes), 2,123 ODMGs, 2,714 MDGs, and 2,721 essential genes (Supplementary Table S1). Within the current human kinome, 422 kinase genes (78.4%) are found in at least one of these five gene sets, including 45 CGC genes, 126 drug target proteins (genes), 101 MDGs, 85 ODMGs and 386 essential genes (Figure 2). This observation indicated that kinase genes tended to be CGC genes more often as compared to MDGs (odds ratio=2.6, p=1.3×10⁻⁶, Fisher’s exact test) or ODMGs (p=8.3×10⁻⁶). Among the 45 CGC kinase genes, 28 kinases have been approved by the United States Food and Drug Administration (FDA) for molecularly targeted cancer treatment. In order to further our understanding of the biological functions of the human kinome, we examined the cellular component features of 538 kinases using the ClueGO [15]. We found kinases tended to locate in the plasma membrane integral region (p=9.0×10⁻⁹, two-sided hypergeometric test), plasma membrane (p=6.1×10⁻⁸), cytoskeletal region (p=3.5×10⁻⁵), cytoskeleton (p=3.5×10⁻⁴), or cleavage furrow (p=4.5×10⁻³) (Supplementary Table S2). It is not surprising that kinases are enriched in membrane components, as the cell membrane is a key location for signal transduction and cell-cell communications.
Kinase-substrate interaction network
We constructed a high-resolution KSIN using a systems biology-based framework in Figure 1. The current version of KSIN includes 7,346 experimentally validated or literature-curated kinase-substrate interaction (KSI) pairs connecting 379 kinases and 1,961 non-kinase substrate proteins (Supplementary Table S1). The details of kinase genes categorized by each kinase group are shown in Supplementary Figure S1. We further collected high-resolution in vivo phosphorylation sites from dbPTM3 [16] and PhosphositePlus [17], and used the data to annotate each protein kinase and its substrate protein. In total, we collected 173,460 non-redundant phosphorylation sites in 18,610 proteins (Supplementary Table S2). This collection included 94,693 phosphoserine (pS) sites (54.6%), 44,023 phosphothreonine (pT) sites (25.4%), and 34,744 phosphotyrosine (pY) sites (20.0%) (Supplementary Figure S1C). Among these phosphorylation sites, 10,374 sites were found in a total of 490 kinases (91.1% of kinome), including 5,364 pS sites (51.7%), 2,581 pT sites (24.9%), and 2,429 pY sites (23.4%) (Supplementary Figure S1D). Next, we compared the kinases and substrates in KSIN with their phosphoproteome sites. In total, 36,576 phosphorylation sites were found in 1,919 non-kinase substrate proteins in KSIN, including 21,184 pS sites (57.9%), 8,812 pT sites (24.1%), and 6,580 pY sites (18.0%) (Supplementary Figure S1E).
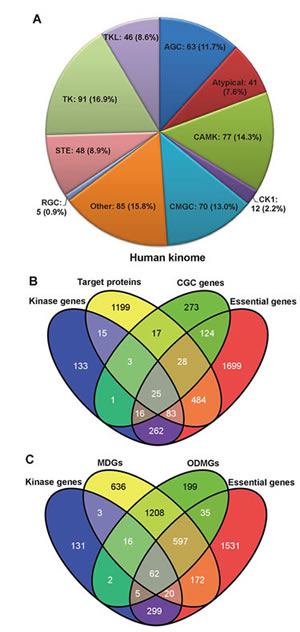
Figure 2: Functional annotations of the human kinome. (A) Pie chart of 538 kinase genes grouped by 10 different kinase groups: tyrosine kinases (TK), tyrosine kinase-like kinases (TKL), casein kinases (CK1), PKA/PKG/PKC-family kinases (AGC), calcium/calmodulin-dependent kinases (CAMK), sterile homologue kinases (STE), CDK/MAPK/GSK3/CLK-family kinases (CMGC), receptor guanylate cyclases (RGC), atypical protein kinases (Atypical), and kinases that did not belong to any groups above (Other). (B) The Venn diagram of overlaps among 538 kinase genes, 1,855 drug target proteins, 487 Cancer Gene Census (CGC) genes, and 2,721 essential genes. (C) The Venn diagram of overlaps among 538 kinase genes, 2,714 Mendelian disease genes (MDGs), 2,123 orphan disease-causing mutant genes (ODMGs), and 2,721 essential genes.
Topological characteristics of KSIN
We visualized KSIN in Cytoscape and examined its network topological characteristics in Figure 3. In this network, 379 kinases were denoted by circles, and 1,961 non-kinase substrate proteins were denoted by squares. A straightforward exploration of the network revealed several major hubs, including PRKACA (connectivity=333), CDK2 (255), AKT1 (234), CSNK2A1 (227), PRKAC (223), MAPK1 (194), SRC (163), MAPK3 (141), MAPK3 (124), and GSK3B (123), all of which were involved in multiple substrate protein phosphorylation reactions. An examination of the connectivity distribution of KSIN showed that it follows a power-law distribution (y=axb, a=380.1, b=-1.3), with an average connectivity of 6.3 and an average shortest path of 3.5 (Supplementary Figure S1F).
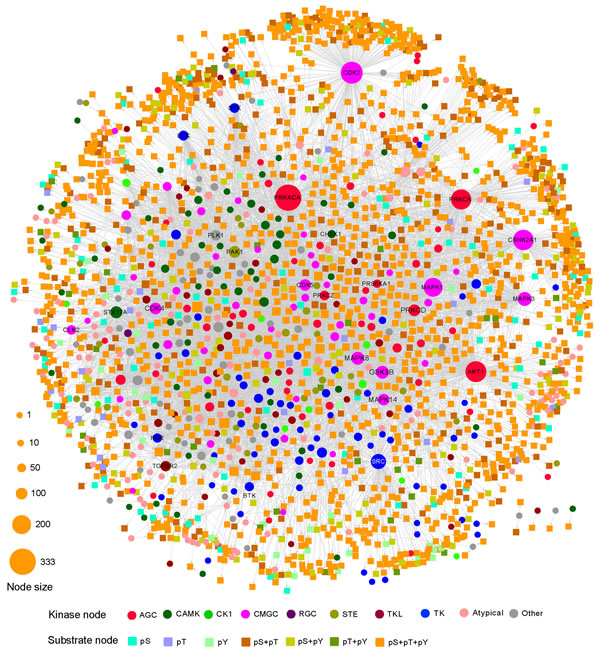
Figure 3: Kinase-substrate interaction network (KSIN). The size of each node reflects its degree of connectivity in KSIN. Abbreviations of kinase groups (circles) are provided in the Figure 2 legend. Non-kinase substrate nodes (squares) are color-coded according to their phosphorylation sites, including phosphoserine (pS), phosphothreonine (pT), and phosphotyrosine (pY).
Modularity characteristics
Network modules, also known as network communities, represent groups of interconnected nodes that typically have similar biological functions. We used CFinder [18] to identify functional modules of KSIN. A total of 21 functional modules (Supplementary Table S2) were generated by CFinder (k-clique, k=4). The giant module included 733 KSI pairs connecting 110 kinases and 140 substrate proteins. Modules were further analyzed for overlaps and correlations using the ModuLand algorithm [19,20]. In total, we identified 89 overlapped modules (Supplementary Figure S2A). The correlation of 89 modules is shown in Supplementary Figure S2B.
Substrate specificity of the human kinome
We examined sequence motifs of phosphorylation site using a sequence logo analysis tool [21]. Supplementary Table S2 shows the results for the targeted phosphorylation sites of the top 12 kinases that have the highest connectivity in KSIN. We found kinases recognized distinct sequence motifs (Figure 4A). For example, a serine or threonine residue preceding a proline (Ser/Thr-Pro) is a major regulatory phosphorylation motif that plays crucial functions in a diverse array of cellular processes.[22] Figure 4A showed several important functional hubs, including CDK2, MAPK1, MAPK3, and MAPK8 that harbored the conserved Ser/Thr-Pro motif. Similarly, glycogen synthase kinase-2 (GSK3B) is more likely to recognize and phosphorylate the first serine in the conserved motif Ser-X-X-X-Ser-Pro [23]. The Ser/Thr-Pro-directed kinases play crucial roles in cell cycle, transcription, and diverse signaling transduction pathways as well as in Alzheimer’s disease and various cancers [24]. For CSNK2A1, its +1 position has an Asp/Glu (Figure 4A), confirming that CSNK2A1 is a Ser-Asp/Glu-directed kinase [25]. The -3 and -2 positions of PRKACA, AKT1, PAK1, PRKCA, and PRKCD form conserved phosphorylation consensus motifs, such as Arg-Arg-X-Ser/Thr and Arg/Lys-X-X-Ser/Thr [26]. Moreover, distinct regulatory phosphorylation motifs were verified by kinase-substrate co-crystal structures. The pocket of phospho-CDK2-cyclinA3-peptide complex [27,28] tended to accommodate proline at the +1 position (Figure 4B,C). However, it should be noted that analyses here are limited due to the incompleteness and inaccuracy of existing data.
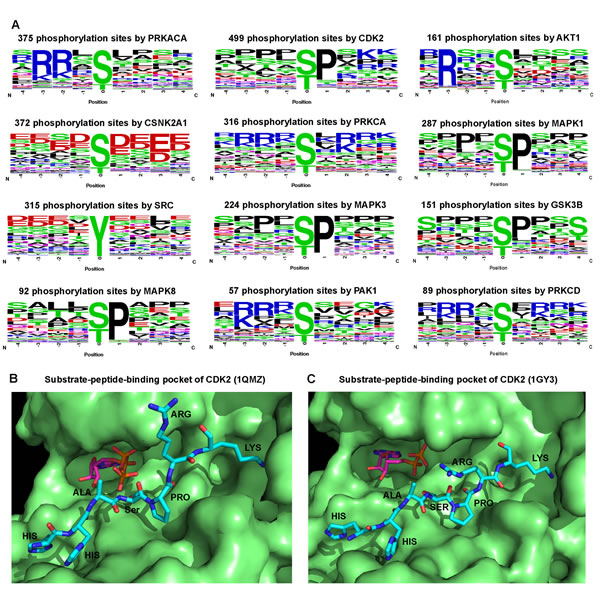
Figure 4: Sequence motif analysis of kinase phosphorylation sites. (A) Logo analysis of target phosphorylation site sequence motifs (four amino acids before and after the phosphorylation residues) for 12 kinases that have the strongest connectivity in kinase-substrate interaction network. The amino acids are labeled according to their chemical properties: green for polar amino acids (G, S, T, Y, C, Q, N), blue for basic amino acids (K, R, H), red for acidic amino acids (D, E), and black for hydrophobic amino acids (A, V, L, I, P, W, F, M). (B) A substrate peptide binding pocket of CDK2 (PDB ID: 1QMZ). (C) Another substrate peptide binding pocket of CDK2 (PDB ID: 1GY3). B and C were prepared using the software PyMOL (http://www.pymol.org/).
Kinase-drug interaction network
We searched drugs that target any of the 538 kinases from DrugBank [6] and Therapeutics Target Database (TTD) [29] and found a total of 567 drugs targeting 126 kinases (Supplementary Table S2, as of April 30, 2013). Then, we used these drugs and their target kinases to build a bipartite graph of the kinase-drug interaction network (KDIN) in Figure 5. The bipartite graph analysis of KDIN could provide a useful survey of the current status of kinase inhibitor discovery and clinical applications. In KDIN, a drug (square) and a kinase (circle) are linked if the kinase is a known target of the drug (Figure 5). The average connectivity (4.6) of 11 FDA approved small molecularly targeted kinase inhibitors is significantly stronger than that of 527 experimental drugs (1.2, p=1.6×10⁻⁸, Wilcoxon test). The bipartite graph analyses showed that most FDA-approved kinase inhibitors often target the cancer kinome through polypharmacology. For instance, dasatinib is an oral dual ABL1 and SRC family tyrosine kinase inhibitor for chronic myelogenous leukemia treatment. As shown in Figure 5, dasatinib targets 9 protein kinases, including ABL1, ABL2, EPHA2, KIT, PDEGFRB, FYN, SRC, YES1, and LCK. Furthermore, a kinase may be targeted by multiple drugs. For example, CDK2 binds 142 experimental drugs in DrugBank and TTD. Since most tumors could evade the inhibition of any single kinase [5], development of a polypharmacological inhibitor would be a promising strategy to improve clinical benefits for cancer therapy [5,30,31]. The two-dimensional chemical structures, detailed annotation data, and FDA-approved clinical usages of 11 small molecular kinase inhibitors are provided in Supplementary Figure S3.
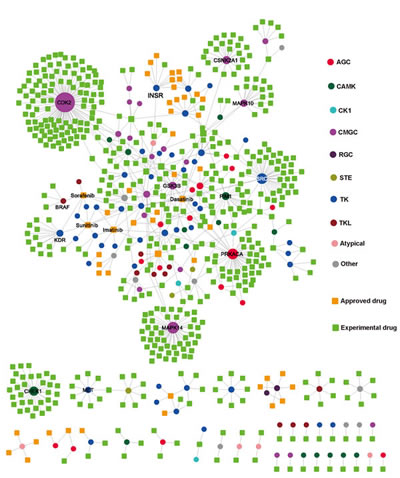
Figure 5: Kinase-drug interaction network. In this network, a drug node (square) and a target kinase node (circle) are connected to each other by a grey edge if the target is annotated as a known interaction with the drug. The size of each node reflects its degree of connectivity. Drug nodes (circles) are green (experimental drugs) or gold (FDA approved drugs). Kinase nodes (circles) are color-coded according to the kinase groups (see Figure 2 legend).
Topological properties of the human kinome interactome
Do hubs in the protein interactome tend to be drug targets? In KSIN, 468 proteins within the top 20% of connectivity were selected as hubs. After manually mapping, we found 116 target kinases in KSIN, of which 90 were hubs (p=3.6×10-43, Fisher’s exact test, Table 1). In PPIN, 2,602 proteins within the top 20% of connectivity were selected as hubs. After manual mapping, we found 125 target kinases, among which 90 target kinases were hubs (p=2.5×10⁻³⁵, Table 1). This target kinase enrichment in hubs was observed in 3DPPIN as well (p=1.5×10⁻²²).
Furthermore, we compiled 13,582 drug-target interactions to construct a complementary drug target protein network (DTPN). In DTPN, nodes are target proteins, and two target proteins are connected if they are both targeted by at least one common FDA-approved or experimental drug [32]. This DTPN included 28,989 pairs connecting 1,811 target proteins. Statistical analysis showed that DTPN target proteins were more likely KSIN hubs (p=2.8×10⁻⁷, Table 1). There were 1,550 target proteins shared by DTPN and PPIN. Within these proteins, 438 (28.3%) were hubs, indicating a significant enrichment of DTPN target proteins in PPIN hubs (p=1.3×10⁻¹⁴). The same enrichment was found when 3DPPIN was compared to DTPN (p=3.2×10⁻¹²). Collectively, drug target proteins (e.g., target kinases) were more likely to be hubs in KSIN, PPIN, and 3DPPIN.
The emerging use of network hubs as drug targets has the following rationale [33]. Perturbation of hubs by a drug would create cascading effects, leading to functional changes in a major segment of the network. In contrast, peripheral nodes (non-hubs) that are blocked by a molecule would likely have only limited effects. However, our analyses below revealed that selecting network hubs as drug targets lead to a high risk of adverse drug reactions. We compiled 527 ADRPs that are involved in adverse drug reactions. When 527 ADRPs were manually matched to PPIN, 441 proteins were found, among which 122 proteins were hubs in PPIN (p=3.1×10⁻⁴, Table 1). In addition, the ADRPs were significantly enriched as network hubs in KSIN (p=2.0×10⁻⁵) and 3DPPIN (p=5.4×10⁻⁵). Therefore, there is a high risk for adverse drug reactions when using the hubs in the human protein interactome as drug targets.
To further investigate whether targeting a signaling pathway is more effective, we used the ClueGO [15] to identify KEGG pathways enriched with the 126 target kinases. Three important signaling pathways were identified: MAPK signaling pathway (including EGFR, BRAF, PDGFR, MAPK1, TGFBR1, and RAF1, p=2.3×10⁻¹⁵, two-sided hypergeometric test, Supplementary Table S3), VEGF signaling pathway (including SRC, PRKCA, MAPK, and KDR, p=1.3×10⁻¹²), and mTOR signaling pathway (including BRAF, AKT1, RPS6KA1, and mTOR, p=1.7×10⁻⁷).
Do kinases tend to be hubs in the human protein interactome?
We manually matched 538 kinases to PPIN and then constructed a kinase-protein interaction subnetwork. This subnetwork included 14,238 pairs connecting 462 kinases and 4,414 non-kinase proteins (Supplementary Table S4). Among the 462 kinases, 209 were hubs in PPIN, indicating a significant enrichment of kinases in PPIN hubs (p=5.9×10⁻³⁴, Table 1). The average connectivity of the 462 kinases was 33.2, which is significantly stronger than that of the 12,181 non-kinases in PPIN (14.0, p<2.2×10⁻¹⁶, Wilcoxon test, Supplementary Table S4). We further matched 538 kinases in 3DPPIN and found 271 kinases, including 117 hubs (p=2.1×10⁻¹⁵, Table 1). The average connectivity (6.0) of the 271 kinases is significantly stronger than that of the 2,338 non-kinases in 3DPPIN (3.0, p<2.2×10⁻¹⁶). Collectively, kinases are significantly enriched as network hubs in the protein interactome.
Do hubs in KSIN tend to be hubs/bottlenecks in the protein interactome?
We manually matched 2,340 proteins in KSIN to PPIN. A total of 2,213 proteins (including 361 kinases and 1,852 non-kinase substrates) were found, among which 1,119 proteins (including 194 kinases and 925 non-kinases) were hubs in PPIN (p=3.6×10-275, Supplementary Table S4). In addition, 965 proteins (including 169 kinases and 796 non-kinases) were bottlenecks in PPIN (p=1.1×10-166). The average connectivity (9.8) of the 965 bottleneck proteins is significantly stronger than that of the 1,248 non-bottleneck proteins in KSIN (3.8, p<2.2×10⁻¹⁶). These findings revealed that proteins in KSIN tended to be bottlenecks in PPIN.
Network topology of anticancer drug response-associated genes
A systematic identification of anticancer drug response markers in cancer cells is highly promising for individualized cancer therapy [34]. In this study, we sought to determine the network topology of drug resistance genes in the protein interactome. We compiled 458 genes that are involved in sensitivity or resistance to 130 anticancer drugs from a previous work [35]. Among the 458 drug resistance genes, 82 were CGC genes and 144 were essential genes (Supplementary Figure S4A). We found 124 among the 458 drug resistance proteins (genes) in KSIN, 40 of them were hubs, suggesting a significant enrichment of drug resistance proteins in KSIN hubs (p=1.1×10⁻³, Fisher’s test, Table 1). The average connectivity (10.5) of the 124 drug resistance proteins was significantly stronger than that of the 2,216 remaining proteins in KSIN (6.1, p=2.6×10⁻⁴, Wilcoxon test, Supplementary Table S5). Furthermore, we found a significant enrichment of anticancer drug resistance proteins in PPIN hubs (137 hubs, p=3.0×10⁻¹²) and 3DPPIN hubs (58 hubs, p=3.2×10⁻⁸).
Table 1: The network topological analysis for five gene sets in human protein interactome.
Network |
Gene sets |
Number of hubs |
Number of non-hubs |
Odds ratio |
p-value |
KSIN |
Kinome |
277 |
152 |
16.4 |
1.2×10-119 |
Drug target kinases |
90 |
26 |
16.9 |
3.6×10-43 |
|
Drug target proteins |
121 |
288 |
1.9 |
2.8×10⁻⁷ |
|
ADRPs |
54 |
105 |
2.2 |
2.0×10⁻⁵ |
|
Drug sensitivity genes |
40 |
84 |
2.0 |
1.1×10⁻³ |
|
PPIN |
Kinome |
209 |
253 |
3.4 |
5.9×10⁻³⁴ |
Drug target kinases |
90 |
35 |
10.2 |
2.5×10⁻³⁵ |
|
Drug target proteins |
438 |
1112 |
1.6 |
1.3×10⁻¹⁴ |
|
ADRPs |
122 |
319 |
1.5 |
3.1×10⁻⁴ |
|
Drug sensitivity genes |
137 |
245 |
2.2 |
3.0×10⁻¹² |
|
3DPPIN |
Kinome |
117 |
154 |
3.0 |
2.1×10⁻¹⁵ |
Drug target kinases |
68 |
33 |
7.8 |
1.5×10⁻²² |
|
Drug target proteins |
162 |
293 |
2.2 |
3.2×10⁻¹² |
|
ADRPs |
47 |
75 |
2.2 |
5.4×10⁻⁵ |
|
Drug sensitivity genes |
58 |
75 |
2.8 |
3.2×10⁻⁸ |
KSIN: kinase-substrate interaction network (468 hubs versus 1,872 non-hubs). PPIN: protein-protein interaction network (2,602 hubs versus 10,041 non-hubs). 3DPPIN: three-dimensional structural PPIN (591 hubs versus 2,018 non-hubs). ADRPs: adverse drug reaction-associated proteins. The p-value was calculated using Fisher’s exact test.
Next, we constructed a drug resistance network to investigate the detailed molecular mechanisms of drug responses to specific FDA-approved small molecular kinase inhibitors (Supplementary Figure S3). The calculation of a p-value for each drug-gene association was described in a previous work [35]. Three kinase inhibitors are approved for renal cell carcinoma treatment by the FDA, including sunitinib, sorafenib, and pazopanib (Figure 6A). The kinase inert domain receptor (KDR) is involved in resistance or sensitivity to sunitinib (p=1.9×10⁻⁴), sorafenib (p=1.0×10⁻³), and pazopanib (p=1.0×10⁻³) (Supplementary Table S5). The cyclin-dependent kinase inhibitor 2A gene (CDKN2A), which encodes the CDK inhibitory protein p16, was reported to be significantly associated with sensitivity to five kinase inhibitors (Supplementary Table S5): dasatinib (p=1.3×10⁻¹³), erlotinib (p=4.1×10⁻⁸), imatinib (p=8.2×10⁻⁵), sunitinib (p=5.0×10⁻³), sorafenib (p=6.0×10⁻³), and lapatinib (p=7.0×10⁻³). Gefitinib, a classical EGFR tyrosine kinase inhibitor, is approved to treat advanced or metastatic non-small cell lung cancer. Recent work showed genes NRAS, BRAF, KRAS, and PIK3R1 are involved in gefitinib resistance (Figure 6B) [36]. In Figure 6C, most gefitinib resistance genes are located on the EGFR signaling pathway through the RAS/MEK/ERK or PI3K/PDK1/AKT downstream pathways [34]. Collectively, selecting a network hub as the drug target in the protein interactome might create a high anticancer drug resistance risk.
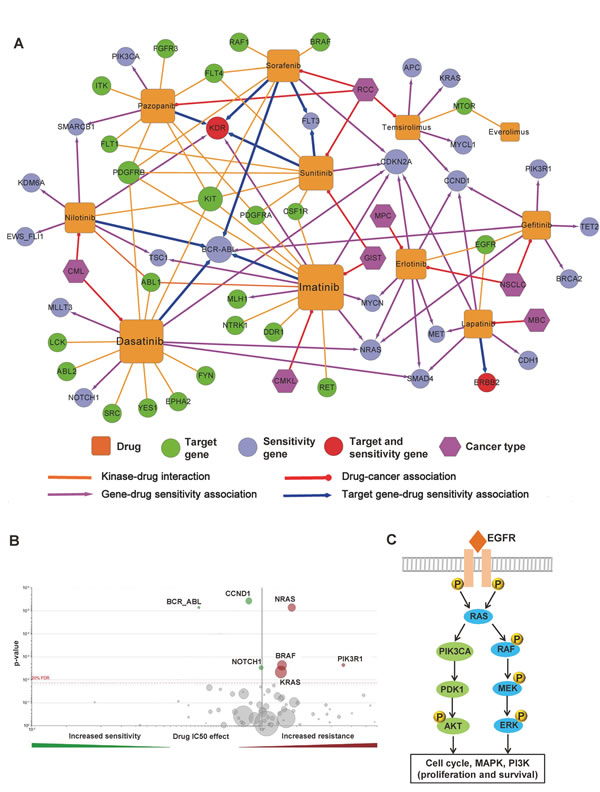
Figure 6: Network analysis of kinase inhibitor response. (A) Drug sensitivity network of 11 molecularly targeted kinase inhibitors (Supplementary Figure S5). This network includes four types of edges: kinase-drug interaction (gold solid line), drug-cancer association (red solid line), gene-drug sensitivity associations (purple solid line with arrow), and target gene-drug sensitivity associations (blue solid line with arrow). Color codes of nodes: drug (gold square), target gene or target protein (green circle), drug sensitivity genes (cyan-blue circle), drug target and sensitivity gene (red circle), and cancer (purple hexagon). (B) Volcano plot of sensitivity response to Gefitinib, an epidermal growth factor receptor (EGFR) inhibitor. The calculation of a p-value for each drug-gene association was described in a previous work [35]. The data was from the Genomics of Drug Sensitivity (http://www.cancerrxgene.org). (C) The simplified EGFR signaling pathways involving Gefitinib sensitivity through the RAS/MEK/ERK and PI3K/PDK1/AKT pathways.
DISCUSSION
Resistance to chemotherapy and molecularly targeted kinase inhibitor therapeutics is a major obstacle facing current cancer research [37]. Crosstalk and feedback that are poorly understood in most cellular networks are main contributors to resistance. Systems biology-based modeling on the human kinome level might provide a powerful network perspective and innovative tools to address this challenge. In this study, we systematically investigated the relationship between kinase inhibitors and the gene products of the human kinome in the broader context of the human kinase phosphorylation network and the protein interactome. We focused on addressing two questions. First, do kinases occupy a distinct network topology in the human interactome? Second, from a systems biology perspective, why do most tumors escape from any single kinase inhibition? We found kinases significantly tended to be central hubs rather than peripheral nodes in the protein interactome. The distinct network centrality of kinases creates a high risk for the evasion of single kinase target inhibition through adaptive feedback or crosstalk within dynamic signaling networks. Moreover, this hypothesis is further supported by the systematic network and pathway analyses that anticancer drug sensitivity proteins are significantly enriched as hubs in the protein interactome. We further revealed that the typical anticancer drug target selection strategy that uses hubs as drug targets, might lead to a high risk for adverse drug reactions. In summary, these findings provide systems view of the human kinase interactions and kinase inhibitor resistance mechanisms.
Phosphorylation-mediated signaling networks play crucial roles in cellular physiology. Recent protein microarray experiments have provided high-throughput data and facilitated the analyses of protein phosphorylation networks [38]. Here, we constructed a global and high-resolution kinase phosphorylation network using an integrative computational framework. We identified conserved regulatory phosphorylation motifs, e.g., Ser-X-X-X-Ser-Pro, using a sequence logo analysis. These conserved regulatory phosphorylation motifs were verified by the kinase-substrate co-crystal structures. Thus, we provided the evidence that the proline direction of kinases is a common mechanism for the conserved phosphorylation signaling pathways. The data size used in this study is reasonable and includes the data we were able to collect to date. However, some important properties might not be captured among this data due to knowledgebase incompleteness as well as the standard static networks that are prevalent in this field. Biological systems, e.g., the phosphorylation network, are highly dynamic profiles that continuously respond to a host of physical or physiological environments. So far, the completeness and accuracy of the human interactome is still a major obstacle. For example, the perturbation dynamics of signaling networks have been extensively investigated, including ~10,000 phosphorylation reactions in yeast cells [39]. The size of the whole human interactome was estimated to have ~650,000 interactions [40]. Although two large networks were constructed in this study, we still have a long way to decipher the complexity of the human kinome interactome. Advances in experimental measurement technologies and computational methods would enable large-scale screenings to fill in much of our missing knowledge in the future.
Here, we systematically examined the kinase-drug interaction network using a bipartite graph analysis. We found target kinases are significantly enriched as central hubs in the protein interactome. An inhibition or blocking of hub nodes may lead to cascading effects compromising the function of a major segment of the signaling networks [33]. The development of high efficacy kinase inhibitors that target hubs of the signaling networks is a typical strategy for cancer drug discovery [41]. However, network centrality of target kinases might create a high risk of drug resistance, as hub proteins easily provide the adaptive crosstalk or feedback within cellular networks. In addition, we found the current selection of hubs as drug targets might create a high risk for the adverse drug reactions. Many promising drug candidates fail in the last clinical trial phases due to a poor understanding of the signaling pathways or drug-target interactions that are involved in the mechanisms-of-action [42]. To overcome this challenge, we urge researchers to expand the knowledge of systems pharmacology through the construction of network models [5,43]. Here, we found most of the successful kinase inhibitors primarily target the cancer kinome through polypharmacology. The polypharmacology of kinase inhibitors would improve clinical efficiency by inhibiting multiple kinases in the signaling networks [5,33]. Thus, network-based modeling potentially opens a new avenue for rational kinase inhibitor discovery, e.g., “Allo-network drugs” development [33,34]. The human kinome interactome we constructed in this study, named Kinome NetworkX, is available at http://bioinfo.mc.vanderbilt.edu/kinomenetworkX/. This comprehensive data source would serve as a useful resource for the research community. Collectively, the global human kinome interactome map provide a systems biology perspective for the human kinome, and this map is a useful resource for rational kinase inhibitor design in individualized cancer therapy.
MATERIAL AND METHODS
Construction of the human interactome
Kinase-substrate interaction network (KSIN)
In KSIN, a node denotes a kinase or its substrate protein, and an edge denotes a phosphorylation reaction between a kinase and its substrate protein. We collected high-resolution KSI pairs from four databases: Phospho.ELM [44], Human Protein Resource Database (HPRD) [45], PhosphoNetworks [38,46], and PhosphoSitePlus [17]. All genes were mapped to their Entrez ID based on the NCBI [14] as well as their official gene symbols based on GeneCards (http://www.genecards.org/). Duplicated KSI pairs and self-loops were removed. As a result, we compiled 7,346 unique KSI pairs connecting 379 kinases and 1,961 non-kinase substrate proteins. In addition, we collected human phosphorylation site information from the PhosphoSitePlus [17] and dbPTM3 [16] databases. In total, we obtained 173,460 non-redundant phosphorylation sites in 18,610 proteins.
Protein-protein interaction network (PPIN)
We downloaded human protein-protein interaction (PPI) pairs from the Protein Interaction Network Analysis (PINA) platform. PINA (v2.0, May 1, 2013) is a comprehensive PPI database that integrates six large-scale, manually curated public databases: IntAct, MINT, BioGRID, DIP, HPRD, and MIPS MPact [47]. All protein-coding genes were mapped to the NCBI database. Genes without an Entrez ID, duplicated PPI pairs, and self-loops were excluded. In total, we obtained 92,699 unique PPI pairs connecting 12,643 proteins.
Three-dimensional structural protein-protein interaction network (3DPPIN)
We downloaded three-dimensional structural PPI (3DPPI) pairs from the Instruct database [48]. The original Instruct database contained 6,534 human 3DPPI pairs. After excluding genes without Entrez IDs and 2,293 self-loops, we collected 4,278 3DPPI pairs connecting 2,609 proteins.
Drug-target interaction network We collected the drug-target interactions from two famous drug pharmacological databases: DrugBank [6] and TTD [29]. In total, we collected 13,582 drug-target interaction pairs connecting 2,716 target proteins and 3,779 FDA-approved and experimental drugs.
Gene set categories
Mendelian disease genes (MDGs)
We downloaded 2,714 MDGs from the Online Mendelian Inheritance in Man (OMIM) database (December 2012) [49]. The OMIM contained 4,132 gene-disease association pairs connecting 2,716 disease genes in 3,294 Mendelian diseases or disorders (December 2012).
Orphan disease-causing mutant genes (ODMGs)
We collected 2,123 ODMGs from a previously published work [50]. According to the United States Rare Disease Act of 2002, an orphan disease is defined as a rare disease that affects fewer than 200,000 inhabitants, which is equivalent to approximately 6.5 patients per 10,000 inhabitants [51].
Cancer Gene Census (CGC) genes
We collected 487 cancer genes from the Cancer Gene Census (CGC, http://cancer.sanger.ac.uk/cancergenome/projects/census/). CGC genes are well-curated and have been widely used as a reference cancer gene set in many cancer-related projects [52,53].
Essential genes
We downloaded 2,721 essential genes from the Online GEne Essentiality (OGEE) database [54]. Essential genes, whose knockouts result in cell inviability or embryonic lethality, are a crucial component to the study of biological systems robustness and effective drug target identification [54].
Adverse drug reaction-associated proteins (ADRPs)
We compiled 546 ADRPs from a previously published work [55]. ADRPs are proteins that mediate adverse drug reactions or toxicity by binding to drugs or their reactive metabolites. Duplicated proteins and genes without Entrez IDs were excluded, resulting in 527 ADRPs.
Anticancer drug response-associated genes
We collected 458 genes that were involved in the sensitivity or resistance to 130 anticancer drugs from a previous work [35]. In this study, Mathew et al. systematically identified drug-sensitivity biomarkers (genes) on 639 human tumor cell lines, which provided a useful resource to probe drug sensitivity genes.
Measurement of network topology
We calculated connectivity (degree) and betweenness centrality values using the Cytoscape (v3.0) [56]. We defined “hubs” as those nodes that were ranked at the top 20% of the connectivity distribution and “bottleneck” as those nodes that were ranked at the top 20% of the betweenness centrality value distribution [50,57]. We identified network modules and communities using CFinder [18] (k-clique, k=4) and the ModuLand algorithm [19,20]. CFinder was used to locate and visualize overlapping, densely interconnected groups of nodes in undirected graphs [18]. The ModuLand algorithm was used to identify hierarchical layers of overlapping network modules and community centrality [19,20].
Functional enrichment analysis
We used ClueGo [15], a user-friendly Cytoscape plug-in, for the enrichment analysis of genes in Gene Ontology cellular components or KEGG canonical pathways. A two-sided hypergeometric test was performed to estimate statistical significance.
Statistical analysis and network visualization
All statistical tests (e.g., Fisher’s exact test and Wilcoxon’s test) were performed on the R platform (v3.01, http://www.r-project.org/). All network visualization and related network topological parameters were presented using Cytoscape (v3.0) [56].
Acknowledgements
We thank Ms. Rebecca Hiller Posey for polishing an earlier draft of the manuscript. This work was partially supported by National Institutes of Health grants (R01LM011177, R03CA167695, P50CA095103, P50CA098131, and P30CA068485), American Association for Cancer Research, Stand Up to Cancer Innovative Research Grant (SU2C) SU2C-AACR-IRG0109, The Robert J. Kleberg, Jr. and Helen C. Kleberg Foundation, and Ingram Professorship Funds to Dr. Zhao. The funders had no role in study design, data collection and analysis, decision to publish, or preparation of the manuscript.
Author contributions
Z.Z. and F.C. conceived and designed the study. F.C. carried out experiments. F.C., P.J. and Q.W. analyzed the data. F.C. and Z.Z. interpreted the results and wrote the manuscript.
Competing interests
The authors declare that they have no conflict of interest.
Data and materials availability
All raw and processed data are available in the Supplementary Materials and on the website http://bioinfo.mc.vanderbilt.edu/kinomenetworkX/.
REFERENCES
1. Cohen P, Tcherpakov M. Will the ubiquitin system furnish as many drug targets as protein kinases? Cell. 2010; 143: 686-693.
2. Cohen P. Protein kinases--the major drug targets of the twenty-first century? Nat Rev Drug Discov. 2002; 1: 309-315.
3. Pao W, Hutchinson KE. Chipping away at the lung cancer genome. Nat Med. 2012; 18: 349-351.
4. Cohen P, Alessi DR. Kinase drug discovery--what’s next in the field? ACS Chem Biol. 2012; 8: 96-104.
5. Knight ZA, Lin H, Shokat KM. Targeting the cancer kinome through polypharmacology. Nat Rev Cancer. 2010; 10: 130-137.
6. Knox C, Law V, Jewison T, Liu P, Ly S, Frolkis A, Pon A, Banco K, Mak C, Neveu V, Djoumbou Y, Eisner R, Guo AC, Wishart DS. DrugBank 3.0: a comprehensive resource for ‘omics’ research on drugs. Nucleic Acids Res. 2011; 39: D1035-1041.
7. Ciardiello F, Tortora G. EGFR antagonists in cancer treatment. N Engl J Med. 2008; 358: 1160-1174.
8. Jonker DJ, O’Callaghan CJ, Karapetis CS, Zalcberg JR, Tu D, Au HJ, Berry SR, Krahn M, Price T, Simes RJ, Tebbutt NC, van Hazel G, Wierzbicki R, Langer C, Moore MJ. Cetuximab for the treatment of colorectal cancer. N Engl J Med. 2007; 357: 2040-2048.
9. Miller K, Wang M, Gralow J, Dickler M, Cobleigh M, Perez EA, Shenkier T, Cella D, Davidson NE. Paclitaxel plus bevacizumab versus paclitaxel alone for metastatic breast cancer. N Engl J Med. 2007; 357: 2666-2676.
10. Shepherd FA, Rodrigues Pereira J, Ciuleanu T, Tan EH, Hirsh V, Thongprasert S, Campos D, Maoleekoonpiroj S, Smylie M, Martins R, van Kooten M, Dediu M, Findlay B, Tu D, Johnston D, Bezjak A, et al. Erlotinib in previously treated non-small-cell lung cancer. N Engl J Med. 2005; 353: 123-132.
11. Jia P, Jin H, Meador CB, Xia J, Ohashi K, Liu L, Pirazzoli V, Dahlman KB, Politi K, Michor F, Zhao Z, Pao W. Next-generation sequencing of paired tyrosine kinase inhibitor-sensitive and -resistant EGFR mutant lung cancer cell lines identifies spectrum of DNA changes associated with drug resistance. Genome Res. 2013; 23: 1434-1445.
12. Dahlman KB, Xia J, Hutchinson K, Ng C, Hucks D, Jia P, Atefi M, Su Z, Branch S, Lyle PL, Hicks DJ, Bozon V, Glaspy JA, Rosen N, Solit DB, Netterville JL, et al. BRAF(L597) mutations in melanoma are associated with sensitivity to MEK inhibitors. Cancer Discov. 2012; 2: 791-797.
13. Manning G, Whyte DB, Martinez R, Hunter T, Sudarsanam S. The protein kinase complement of the human genome. Science. 2002; 298: 1912-1934.
14. Corrdinators NR. Database resources of the National Center for Biotechnology Information. Nucleic Acids Res. 2013; 41: D8-D20.
15. Bindea G, Mlecnik B, Hackl H, Charoentong P, Tosolini M, Kirilovsky A, Fridman WH, Pages F, Trajanoski Z, Galon J. ClueGO: a Cytoscape plug-in to decipher functionally grouped gene ontology and pathway annotation networks. Bioinformatics. 2009; 25: 1091-1093.
16. Lu CT, Huang KY, Su MG, Lee TY, Bretana NA, Chang WC, Chen YJ, Huang HD. DbPTM 3.0: an informative resource for investigating substrate site specificity and functional association of protein post-translational modifications. Nucleic Acids Res. 2013; 41: D295-305.
17. Hornbeck PV, Kornhauser JM, Tkachev S, Zhang B, Skrzypek E, Murray B, Latham V, Sullivan M. PhosphoSitePlus: a comprehensive resource for investigating the structure and function of experimentally determined post-translational modifications in man and mouse. Nucleic Acids Res. 2012; 40: D261-270.
18. Adamcsek B, Palla G, Farkas IJ, Derenyi I, Vicsek T. CFinder: locating cliques and overlapping modules in biological networks. Bioinformatics. 2006; 22: 1021-1023.
19. Szalay-Beko M, Palotai R, Szappanos B, Kovacs IA, Papp B, Csermely P. ModuLand plug-in for Cytoscape: determination of hierarchical layers of overlapping network modules and community centrality. Bioinformatics. 2012; 28: 2202-2204.
20. Kovacs IA, Palotai R, Szalay MS, Csermely P. Community landscapes: an integrative approach to determine overlapping network module hierarchy, identify key nodes and predict network dynamics. PLoS One. 2010; 5: e12528.
21. Crooks GE, Hon G, Chandonia JM, Brenner SE. WebLogo: a sequence logo generator. Genome Res. 2004; 14: 1188-1190.
22. Lu KP, Liou YC, Zhou XZ. Pinning down proline-directed phosphorylation signaling. Trends Cell Biol. 2002; 12: 164-172.
23. Bax B, Carter PS, Lewis C, Guy AR, Bridges A, Tanner R, Pettman G, Mannix C, Culbert AA, Brown MJ, Smith DG, Reith AD. The structure of phosphorylated GSK-3beta complexed with a peptide, FRATtide, that inhibits beta-catenin phosphorylation. Structure. 2001; 9: 1143-1152.
24. Nigg EA. Mitotic kinases as regulators of cell division and its checkpoints. Nat Rev Mol Cell Biol. 2001; 2: 21-32.
25. Lukashova V, Szabo EZ, Jinadasa T, Mokhov A, Litchfield DW, Orlowski J. CK2 phosphorylation of an acidic Ser/Thr di-isoleucine motif in the Na+/H+ exchanger NHE5 isoform promotes association with beta-arrestin2 and endocytosis. J Biol Chem. 2011; 286: 11456-11468.
26. Shabb JB. Physiological substrates of cAMP-dependent protein kinase. Chem Rev. 2001; 101: 2381-2411.
27. Brown NR, Noble ME, Endicott JA, Johnson LN. The structural basis for specificity of substrate and recruitment peptides for cyclin-dependent kinases. Nat Cell Biol. 1999; 1: 438-443.
28. Cook A, Lowe ED, Chrysina ED, Skamnaki VT, Oikonomakos NG, Johnson LN. Structural studies on phospho-CDK2/cyclin A bound to nitrate, a transition state analogue: implications for the protein kinase mechanism. Biochemistry. 2002; 41: 7301-7311.
29. Zhu F, Shi Z, Qin C, Tao L, Liu X, Xu F, Zhang L, Song Y, Zhang J, Han B, Zhang P, Chen Y. Therapeutic target database update 2012: a resource for facilitating target-oriented drug discovery. Nucleic Acids Res. 2012; 40: D1128-1136.
30. Knight RA, Gostev M, Ilisavskii S, Willis AE, Melino G, Antonov AV. Large scale integration of drug-target information reveals poly-pharmacological drug action mechanisms in tumor cell line growth inhibition assays. Oncotarget. 2014; 5: 659-666”.
31. Apsel B, Blair JA, Gonzalez B, Nazif TM, Feldman ME, Aizenstein B, Hoffman R, Williams RL, Shokat KM, Knight ZA. Targeted polypharmacology: discovery of dual inhibitors of tyrosine and phosphoinositide kinases. Nat Chem Biol. 2008; 4: 691-699.
32. Yildirim MA, Goh KI, Cusick ME, Barabasi AL, Vidal M. Drug-target network. Nat Biotechnol. 2007; 25: 1119-1126.
33. Csermely P, Korcsmaros T, Kiss HJ, London G, Nussinov R. Structure and dynamics of molecular networks: A novel paradigm of drug discovery: A comprehensive review. Pharmacol Ther. 2013; 138: 333-408.
34. Gonzalez de Castro D, Clarke PA, Al-Lazikani B, Workman P. Personalized cancer medicine: molecular diagnostics, predictive biomarkers, and drug resistance. Clin Pharmacol Ther. 2013; 93: 252-259.
35. Garnett MJ, Edelman EJ, Heidorn SJ, Greenman CD, Dastur A, Lau KW, Greninger P, Thompson IR, Luo X, Soares J, Liu Q, Iorio F, Surdez D, Chen L, Milano RJ, Bignell GR, et al. Systematic identification of genomic markers of drug sensitivity in cancer cells. Nature. 2012; 483: 570-575.
36. Yang W, Soares J, Greninger P, Edelman EJ, Lightfoot H, Forbes S, Bindal N, Beare D, Smith JA, Thompson IR, Ramaswamy S, Futreal PA, Haber DA, Stratton MR, Benes C, McDermott U, et al. Genomics of Drug Sensitivity in Cancer (GDSC): a resource for therapeutic biomarker discovery in cancer cells. Nucleic Acids Res. 2013; 41: D955-961.
37. Holohan C, Van Schaeybroeck S, Longley DB, Johnston PG. Cancer drug resistance: an evolving paradigm. Nature Reviews Cancer. 2013; 13: 714-726.
38. Newman RH, Hu J, Rho HS, Xie Z, Woodard C, Neiswinger J, Cooper C, Shirley M, Clark HM, Hu S, Hwang W, Seop Jeong J, Wu G, Lin J, Gao X, Ni Q, et al. Construction of human activity-based phosphorylation networks. Mol Syst Biol. 2013; 9: 655.
39. Bodenmiller B, Wanka S, Kraft C, Urban J, Campbell D, Pedrioli PG, Gerrits B, Picotti P, Lam H, Vitek O, Brusniak MY, Roschitzki B, Zhang C, Shokat KM, Schlapbach R, Colman-Lerner A, et al. Phosphoproteomic analysis reveals interconnected system-wide responses to perturbations of kinases and phosphatases in yeast. Sci Signal. 2010; 3: rs4.
40. Stumpf MP, Thorne T, de Silva E, Stewart R, An HJ, Lappe M, Wiuf C. Estimating the size of the human interactome. Proc Natl Acad Sci U S A. 2008; 105: 6959-6964.
41. Azmi AS, Banerjee S, Ali S, Wang Z, Bao B, Beck FW, Maitah M, Choi M, Shields TF, Philip PA, Sarkar FH, Mohammad RM. Network modeling of MDM2 inhibitor-oxaliplatin combination reveals biological synergy in wt-p53 solid tumors. Oncotarget. 2011; 2: 378-392.
42. van der Greef J, McBurney RN. Innovation: Rescuing drug discovery: in vivo systems pathology and systems pharmacology. Nat Rev Drug Discov. 2005; 4: 961-967.
43. Cheng F, Liu C, Jiang J, Lu W, Li W, Liu G, Zhou W, Huang J, Tang Y. Prediction of drug-target interactions and drug repositioning via network-based inference. PLoS Comput Biol. 2012; 8: e1002503.
44. Dinkel H, Chica C, Via A, Gould CM, Jensen LJ, Gibson TJ, Diella F. Phospho.ELM: a database of phosphorylation sites--update 2011. Nucleic Acids Res. 2011; 39: D261-267.
45. Keshava Prasad TS, Goel R, Kandasamy K, Keerthikumar S, Kumar S, Mathivanan S, Telikicherla D, Raju R, Shafreen B, Venugopal A, Balakrishnan L, Marimuthu A, Banerjee S, Somanathan DS, Sebastian A, Rani S, et al. Human Protein Reference Database--2009 update. Nucleic Acids Res. 2009; 37: D767-772.
46. Hu J, Rho HS, Newman RH, Zhang J, Zhu H, Qian J. PhosphoNetworks: a database for human phosphorylation networks. Bioinformatics. 2013; 30: 141-142.
47. Cowley MJ, Pinese M, Kassahn KS, Waddell N, Pearson JV, Grimmond SM, Biankin AV, Hautaniemi S, Wu J. PINA v2.0: mining interactome modules. Nucleic Acids Res. 2012; 40: D862-865.
48. Meyer MJ, Das J, Wang X, Yu H. INstruct: a database of high-quality 3D structurally resolved protein interactome networks. Bioinformatics. 2013; 29: 1577-1579.
49. Hamosh A, Scott AF, Amberger JS, Bocchini CA, McKusick VA. Online Mendelian Inheritance in Man (OMIM), a knowledgebase of human genes and genetic disorders. Nucleic Acids Res. 2005; 33: D514-517.
50. Zhang M, Zhu C, Jacomy A, Lu LJ, Jegga AG. The orphan disease networks. Am J Hum Genet. 2011; 88: 755-766.
51. Dear JW, Lilitkarntakul P, Webb DJ. Are rare diseases still orphans or happily adopted? The challenges of developing and using orphan medicinal products. Br J Clin Pharmacol. 2006; 62: 264-271.
52. Futreal PA, Coin L, Marshall M, Down T, Hubbard T, Wooster R, Rahman N, Stratton MR. A census of human cancer genes. Nat Rev Cancer. 2004; 4: 177-183.
53. Jia P, Zhao Z. VarWalker: personalized mutation network analysis of putative cancer genes from next-generation sequencing data. PLoS Comput Biol. 2014; 10: e1003460.
54. Chen WH, Minguez P, Lercher MJ, Bork P. OGEE: an online gene essentiality database. Nucleic Acids Res. 2012; 40: D901-906.
55. Chen X, Liu X, Jia X, Tan F, Yang R, Chen S, Liu L, Wang Y, Chen Y. Network Characteristic Analysis of ADR-related Proteins and Identification of ADR-ADR Associations. Sci Rep. 2013; 3: 1744.
56. Shannon P, Markiel A, Ozier O, Baliga NS, Wang JT, Ramage D, Amin N, Schwikowski B, Ideker T. Cytoscape: a software environment for integrated models of biomolecular interaction networks. Genome Res. 2003; 13: 2498-2504.
57. Yu H, Kim PM, Sprecher E, Trifonov V, Gerstein M. The importance of bottlenecks in protein networks: correlation with gene essentiality and expression dynamics. PLoS Comput Biol. 2007; 3: e59.