
INTRODUCTION
The t(12;21) (p13;q22) chromosomal translocation occurs in approximately 25% of cases of childhood B-lineage acute lymphoblastic leukemia (B-ALL). The rearrangement results in the expression of the ETV6/RUNX1 fusion gene, which leads to increased expression of a number of genes, including the erythropoietin receptor (EPOR), compared to other subtypes of B-ALL [1–4].
ETV6/RUNX1-positive patients have a favorable prognosis but the role of EPOR is poorly understood, as is its mechanism of up-regulation in non-erythroid cells. In vitro studies have revealed that erythropoietin (EPO) enhances proliferation of ETV6/RUNX1-positive cells and decreases their sensitivity to prednisone-induced apoptosis [5]. ETV6/RUNX1 directly activates the ectopic expression of functional EPOR in vitro; leading to the suggestion that EPOR signaling may contribute to the persistence of covert premalignant clones in pediatric ALL patients with the t(12;21) translocation [6]. In principle the increase in EPOR expression in ETV6/RUNX1 positive cells could arise from complex interactions in the regulation of EPOR involving transcription factors, CpG methylation status of the EPOR promoter or the preponderance of relevant microRNAs (miRNAs).
The expression of EPOR has long been associated with hematopoietic cells committed to the erythroid lineage. Binding of EPO to EPOR on the surface membrane of erythroid progenitors activates the intracellular signaling pathways essential for cell survival, proliferation and differentiation. Over the last decade it has become increasingly clear that EPOR is expressed on numerous normal and malignant cell types. Consequently recombinant EPO treatment is often withheld from cancer patients with anemia, due to the risk of augmenting tumor growth [7].
In developing erythroid cells the expression of EPOR peaks at the proerythroblast stage [8], concurrent with maximal expression of GATA1, an obligatory effector of its transcription [9]. Normally, GATA1 is weakly expressed in B lymphocytes, therefore this study focused on the possible compensatory role of other members of the GATA family for the transcriptional regulation of EPOR.
The GATA family of basic-helix-loop-helix transcription factors recognizes analogous GATA motifs and has six members, of which GATA1, GATA2 and GATA3 have important functions in hematopoiesis [10]. GATA1 regulates erythropoiesis, megakaryopoiesis and the development of eosinophils and mast cells [11]. GATA2 is essential for the maintenance and proliferation of hematopoietic stem cells and progenitor cells [10, 12]. Evidence that GATA2 can also act as a single lineage-specific transcription factor is provided by Gata2-/- mice which have a remarkably specific phenotype in which primitive erythropoiesis is strikingly reduced [13].
GATA3 was first identified in a screen for GATA factors in the T cell lineage and plays a key role in early T cell development and the specification of the Th2 subset of T cells [14–16]. A genome-wide germline single nucleotide polymorphism (SNP) analysis identified variants in the GATA3 gene which influence susceptibility to Philadelphia Chromosome-like (Ph-like) ALL and the risk of relapse in childhood ALL [17].
Interplay between GATA factors appears to be a common mechanism for controlling developmental processes [18]. Chromatin occupancy by GATA1 and GATA2 changes during hematopoiesis, leading to lineage-specific differentiation. A recent genome wide analysis demonstrated that GATA1 and GATA2 bind overlapping sets of genes thereby enabling differential regulation of target genes during hematopoiesis [19].
This study examines the mechanisms of EPOR up-regulation through GATA2, including its binding to the EPOR promoter, CpG methylation status, and investigation of miRNAs that inhibit EPOR and GATA2 in the two ALL phenotypes.
RESULTS
The expression of EPOR was determined by Q-PCR in the B-cell progenitor cell lines REH, which is ETV6/RUNX1-positive; NALM-6, which is ETV6/RUNX1 negative and the erythroid cell line, UT-7, known to have high EPOR expression, as a positive control. The high expression of the ETV6/RUNX1 fusion gene in REH cells was confirmed by Q-PCR (Supplementary Figure 1). EPOR is highly expressed in REH and UT-7 cells and significantly (p < 0.001) more weakly expressed in NALM-6 cells (Figure 1A). This pattern of expression was confirmed by Western blotting (Figure 1B).
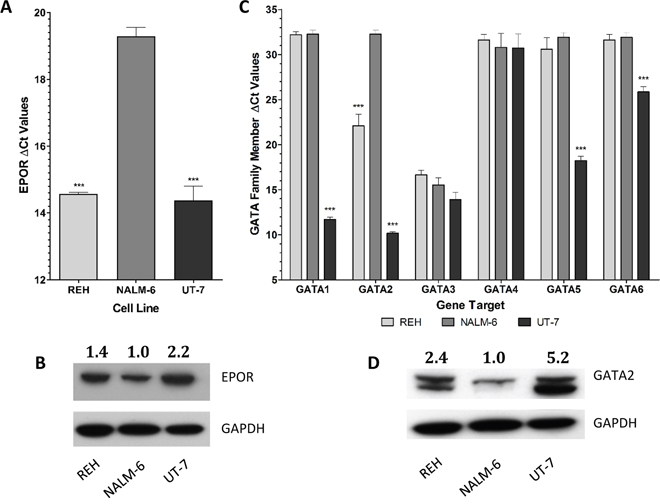
Figure 1: EPOR and GATA family members are differentially expressed between ETV6/RUNX1 positive and ETV6/RUNX1 negative ALL cell lines. (A) The expression of EPOR was analyzed in REH (ETV6/RUNX1 positive), NALM-6 (ETV6/RUNX1 negative) and UT-7 (EPOR positive control) cells in triplicate by Q-PCR. Expression values were corrected to 18S ribosomal RNA levels. Mean corrected Ct values (±SD) are shown and statistical differences to NALM-6 were detected by one-way ANOVA and are indicated by *** (p < 0.001). (B) Western blot analysis of EPOR expression in protein extracted from REH, NALM-6 and UT-7 cells. GAPDH was used as a loading control. EPOR expression levels were calculated relative to NALM-6 by densitometric analysis using GAPDH as a normalization factor. (C) The expression of each GATA family member (GATA1-6) was analyzed in REH, NALM-6 and UT-7 cells in triplicate by Q-PCR. Expression values were corrected to 18S ribosomal RNA levels. Mean corrected Ct values (±SD) are shown and statistical differences to NALM-6 were detected by one-way ANOVA and are indicated by *** (p < 0.001). (D) Western blot analysis of GATA2 expression in protein extracted from REH, NALM-6 and UT-7 cells. GAPDH was used as a loading control. GATA2 expression levels were calculated relative to NALM-6 by densitometric analysis using GAPDH as a normalization factor.
EPOR is tightly regulated in erythroid cells, mainly by GATA1 which is expressed at low levels in B-cell precursors. To investigate whether other members of the GATA family are involved in the expression of EPOR, we evaluated the expression of each GATA family member in the three model cell lines. GATA4, GATA5 and GATA6 were very weakly expressed in REH and NALM-6 cells, and conversely GATA3 was highly expressed in both cell lines. However, GATA2 was significantly (p < 0.001) differentially expressed, with higher levels in REH than in NALM-6 cells (Figure 1C). Western blot analysis indicated that GATA2 protein levels were also higher in REH than NALM-6 cells (Figure 1D). OCI-AML3 was selected as a negative control to check EPOR expression in a non-ALL leukemic cell line. Results from the Affymetrix datasets confirm that EPOR is substantially higher in UT-7 and REH cells than in NALM-6 and OCI-AML-3 (Supplementary Figure 2).
The expression of EPOR and GATA2 was further analyzed in RNA extracted from a cohort of pediatric ALL patients, who were either ETV6/RUNX1-positive or negative (hyperdiploid ALL). The expression of the ETV6/RUNX1 fusion gene in these patient samples was confirmed by Q-PCR (Supplementary Figure 3). Figure 2A shows that patients with the fusion gene had, on average, an EPOR expression level 3.96 Ct lower (i.e. higher expression) than the ETV6/RUNX1-negative (hyperdiploid) patients; this would represent 15.56-fold higher expression in EPOR in ETV6/RUNX1-positive patients (p < 0.001).
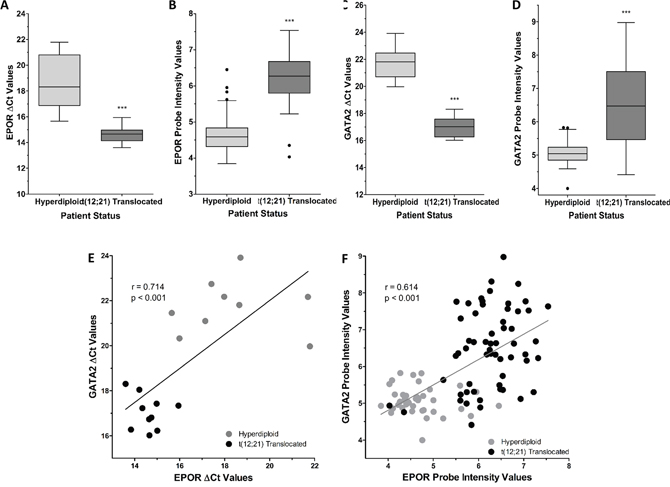
Figure 2: EPOR and GATA2 are differentially expressed between ETV6/RUNX1 positive and ETV6/RUNX1 negative ALL patients. (A) The expression of EPOR was analyzed in hyperdiploid (N=10) and t(12;21) translocated (N=10) ALL patients by Q-PCR. Expression values were corrected to 18S ribosomal RNA levels. (B) EPOR probe intensities (probe ID: 37986_at) of hyperdiploid (N=40) and t(12;21) translocated (N=58) MILE study ALL patients extracted after normalization of expression files. (C) The expression of GATA2 was analyzed in hyperdiploid (N=9) and t(12;21) translocated (N=10) ALL patients by Q-PCR. Expression values were corrected to 18S ribosomal RNA levels. (D) GATA2 probe intensities (probe ID: 209710_at) of hyperdiploid (N=40) and t(12;21) translocated (N=58) MILE study ALL patients extracted after normalization of expression files. Whiskers indicate Tukey minimum and maximum values; boxes indicate inter-quartile range, with the median marked. Significantly different expression was detected by Student’s t-test with Welch’s Correction and indicated by *** (p < 0.001). (E) Correlation between EPOR and GATA2 mRNA expression as measured by Q-PCR in patient samples. NOTE: High ΔCt values correspond to low gene expression. Correlation coefficient (r = 0.714) and associated p-value (p < 0.001) were calculated by Pearson’s correlation test. (F) Correlation between EPOR (probe ID: 37986_at) and GATA2 (probe ID: 209710_at) intensity values in MILE study patient samples. NOTE: High Probe Intensity values correspond to high gene expression. Correlation coefficient (r = 0.614) and associated p-value (p < 0.001) were calculated by Pearson’s correlation test.
High expression of EPOR was confirmed by comparing the gene expression intensities between hyperdiploid and ETV6/RUNX1-positive ALL patients in the MILE Study (GEO13159) [20], see Figure 2B and Supplementary Figure 4A. These data revealed that the ETV6/RUNX1-positive ALL patient group had on average 3.2-fold higher EPOR expression, compared to the hyperdiploid (ETV6/RUNX1-negative) ALL patient group (p < 0.001); indicating a strong association between ETV6/RUNX1 and EPOR expression in B-cell progenitor cells from ALL patients. The EPOR was higher in the ETV6/RUNX1-positive ALL patient group than in six other B-ALL subtypes included in the MILE study (Supplementary Figure 4B). GATA2 expression was also examined in the pediatric ALL cohort, which showed the ETV6/RUNX1-positive group had an average Ct difference of 4.79, representing 27.67-fold higher expression (p < 0.001), Figure 2C.
Figure 2D depicts GATA2 expression, based on probeset fluorescence intensity, in hyperdiploid or ETV6/RUNX1-positive patients in the MILE Study microarray data (GEO13159) [20]. GATA2 levels derived from two additional probesets were analyzed (Supplementary Figure 5). The ETV6/RUNX1-positive ALL patient sub-group had on average 2.7-fold higher GATA2 expression, compared to the ETV6/RUNX1-negative group (p < 0.001); indicating a strong association between ETV6/RUNX1 and GATA2 expression in B-cell progenitor cells from ALL patients.
A comparison of the expression of EPOR and the six GATA binding proteins (GATA1–6) between ETV6/RUNX1-positive ALL and hyperdiploid ALL patients in the MILE study is shown in Table 1. The expression of EPOR, GATA2 and GATA3 are significantly higher in ETV6/RUNX1-positive ALL than in hyperdiploid ALL patients. The lack of GATA1 expression in the cell line models, and the increased expression of GATA2 in ETV6/RUNX1-positive ALL compared to hyperdiploid ALL patients suggest that EPOR expression may be regulated by GATA2 in this type of B-cell leukemia.
Table 1: Expression of EPOR and GATA binding proteins in t(12;21) ALL and hyperdiploid ALL from the MILE Study
Probeset ID |
Gene symbol |
Gene title |
ALL with t(12;21) vs. ALL hyperdiploid |
|||
|---|---|---|---|---|---|---|
p Value |
Fold change |
Higher in |
||||
Probeset E1 |
37986_at |
EPOR |
erythropoietin receptor |
2.98E-21 |
2.95025 |
ALL with t(12;21) |
Probeset E2 |
215054_at |
EPOR |
erythropoietin receptor |
1.74E-20 |
2.8498 |
ALL with t(12;21) |
Probeset E3 |
209962_at |
EPOR |
erythropoietin receptor |
8.69E-18 |
3.35594 |
ALL with t(12;21) |
Probeset E4 |
209963_s_at |
EPOR |
erythropoietin receptor |
2.08E-10 |
1.899 |
ALL with t(12;21) |
Probeset E5 |
396_f_at |
EPOR |
erythropoietin receptor |
5.63E-05 |
1.30265 |
ALL with t(12;21) |
Probeset E6 |
216999_at |
EPOR |
erythropoietin receptor |
0.183499 |
-1.02559 |
|
Probeset G1.1 |
1555590_a_at |
GATA1 |
GATA binding protein 1 |
0.558919 |
-1.03024 |
|
Probeset G1.2 |
210446_at |
GATA1 |
GATA binding protein 1 |
0.939326 |
1.00597 |
|
Probeset G2.1 |
209710_at |
GATA2 |
GATA binding protein 2 |
2.47E-12 |
2.68299 |
ALL with t(12;21) |
Probeset G2.2 |
210358_x_at |
GATA2 |
GATA binding protein 2 |
1.27E-07 |
1.28291 |
ALL with t(12;21) |
Probeset G2.3 |
207954_at |
GATA2 |
GATA binding protein 2 |
0.460004 |
1.01988 |
|
Probeset G3.1 |
209604_s_at |
GATA3 |
GATA binding protein 3 |
3.70E-05 |
2.15746 |
ALL with t(12;21) |
Probeset G3.2 |
209602_s_at |
GATA3 |
GATA binding protein 3 |
0.00157696 |
1.45584 |
ALL with t(12;21) |
Probeset G3.3 |
209603_at |
GATA3 |
GATA binding protein 3 |
0.0263834 |
1.19443 |
ALL with t(12;21) |
Probeset G4.1 |
230855_at |
GATA4 |
GATA binding protein 4 |
0.11158 |
1.06661 |
|
Probeset G4.2 |
1570276_a_at |
GATA4 |
GATA binding protein 4 |
0.243658 |
-1.02736 |
|
Probeset G4.3 |
205517_at |
GATA4 |
GATA binding protein 4 |
0.267507 |
-1.02403 |
|
Probeset G4.4 |
243692_at |
GATA4 |
GATA binding protein 4 |
0.317532 |
-1.03456 |
|
Probeset G4.5 |
1553131_a_at |
GATA4 |
GATA binding protein 4 |
0.794327 |
-1.00928 |
|
Probeset G5.1 |
238095_at |
GATA5 |
GATA binding protein 5 |
0.591853 |
-1.01384 |
|
Probeset G5.2 |
238197_at |
GATA5 |
GATA binding protein 5 |
0.872993 |
1.00297 |
|
Probeset G6.1 |
229282_at |
GATA6 |
GATA binding protein 6 |
0.169085 |
-1.06536 |
|
Probeset G6.2 |
210002_at |
GATA6 |
GATA binding protein 6 |
0.20102 |
-1.03821 |
|
The relationship between EPOR and GATA2 mRNA levels in individual patient samples showed a strong positive correlation between EPOR and GATA2, (R = 0.714, p < 0.001) in the pediatric ALL patients with ETV6/RUNX1 (Figure 2E). Analysis of the MILE gene expression data also revealed a strong positive correlation between EPOR and GATA2 mRNA levels (R = 0.614, p < 0.001) (Figure 2F). Interestingly 2 of the 58 ETV6/RUNX1 positive cases in Figure 2F show very low EPOR expression and very low GATA2, consistent with the idea that GATA2 regulates EPOR. These observations indicate that the strict relationship between the high expression of EPOR and GATA2 in ETV6/RUNX1 patients is not maintained in a minority cases and may reflect phenotypic diversity among the 58 patients in this subgroup.
Correlations between each of the EPOR and GATA2 probesets from the MILE study are detailed in Supplementary Table 3. This provides further evidence in support of an interaction between EPOR and GATA2 in the presence of ETV6/RUNX1.
To investigate whether EPOR is transcriptionally regulated by GATA2, REH and NALM-6 cells were transfected with the pENTR221-GATA2 over-expression vector. Over-expression of GATA2 mRNA was confirmed by Q-PCR in both cell lines 72 hr after transfection. In NALM-6 cells, which do not normally express GATA2, there was a dramatic increase in GATA2 as indicated by an approximately 15,000-fold change (p < 0.001), whilst in REH cells, a ≈ 4,000-fold change in expression was observed (p < 0.001) (Supplementary Figure 6A). There was no significant change in EPOR expression in NALM-6 cells, but there was a significant increase in EPOR expression (Fold change = 13.4, p < 0.001) in REH cells (Supplementary Figure 6B). Thus, overexpression of GATA2 causes an increase in EPOR expression in REH cells, but not in NALM-6, suggesting that additional factors necessary for EPOR regulation by GATA2 are only present in REH cells.
Chromatin immunoprecipitation (ChIP) analysis utilizing both murine and rabbit antibodies revealed that GATA2 binds to the EPOR promoter of the genomic locus at the most 3´ GATA2 site within the 5´-UTR in REH cells, but GATA2 does not bind to the EPOR promoter in NALM-6 cells (Figure 3B). This suggested a difference in the 5´-UTR of NALM-6 cells that inhibits GATA2 binding to the EPOR promoter. An alternative possibility, that the low level of GATA2 in NALM-6 cells is insufficient to transactivate the EPOR promoter was excluded by the data obtained by forced expression of GATA2 (Supplementary Figure 6).
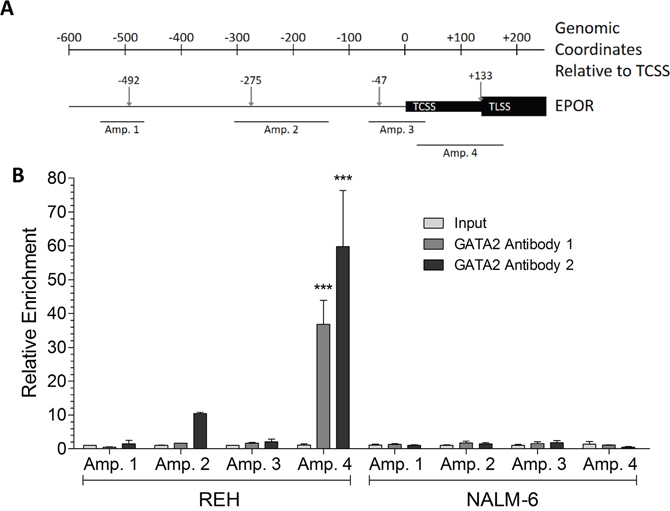
Figure 3: GATA2 binds to the 5′ UTR region of the EPOR gene in REH, but not NALM-6, cells. (A) Schematic of the EPOR genomic locus showing the relative positions of predicted GATA2 binding sites (↓), the EPOR transcription start site (TCSS), the EPOR translation start site (TLSS) and the amplicon targets in ChIP experiments. All genomic coordinates are given relative to the TCSS. (B) ChIP assays were performed on formaldehyde-fixed chromatin prepared from REH and NALM-6 cells. Enrichment of GATA2 binding to EPOR 5′ DNA was determined by comparison to a non-specific binding region and input chromatin controls. Two independent GATA2 antibodies were used. GATA2 binding enrichment was assessed at four genomic loci (Amplicon 1-4). Significant enrichments were detected by two-way ANOVA with Bonferroni’s post-hoc test and are indicated by *** (p < 0.001).
The methylation status of eighteen individual CpG sites in the EPOR promoter (Figure 4A) of the three cell lines was determined by pyrosequencing. The mean methylation levels were 35.8%, 5.1% and 4.9% for the NALM-6, REH, and UT-7 cells respectively (Figure 4C). REH and UT-7 cells have comparable levels of methylation, less than 20%, at all of the CpG sites (Supplementary Figure 7A). In contrast, some of the CpG sites in the NALM-6 cells showed substantially higher methylation, up to 70%, with 16 sites showing significantly higher (p < 0.001) levels than the corresponding CpG sites in REH and UT-7 cells. Pyrosequencing of five CpG sites in the GATA2 upstream region (Figure 4B) revealed mean methylation levels of 59.6% for NALM-6, 13.8% for REH, and 10.28% for UT-7 cells (Figure 4D); significantly higher methylation was found at all sites in the NALM-6 than in either REH or UT-7 cells (p < 0.001; Supplementary Figure 7B). The lower expression of both EPOR and GATA2 seen in NALM-6 cells, compared to REH and UT-7 cells, is consistent with the concept that epigenetic silencing of genes is frequently associated with hypermethylation of the promoter region.
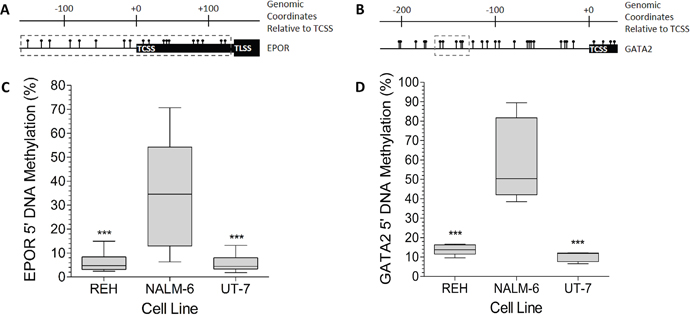
Figure 4: The EPOR and GATA2 5′ DNA is highly methylated in NALM-6, but not in REH cells. (A) Schematic of the EPOR genomic locus showing the relative positions of CpG dinucleotides ( ), the EPOR transcription start site (TCSS), the EPOR translation start site (TLSS) and the CpG sites included in the pyrosequencing assay (grey dashed box). All genomic coordinates are given relative to the TCSS. (B) Schematic of the GATA2 genomic locus showing the relative positions of CpG dinucleotides (
 ), the GATA2 transcription start site (TCSS) and the CpG sites included in the pyrosequencing assay (grey dashed box). (C) EPOR 5′ DNA specific pyrosequencing assays were performed on bisulphite converted DNA prepared from REH, NALM-6 and UT-7 cells. DNA methylation was assessed at 18 CpG sites in triplicate. Whiskers indicate Tukey minimum and maximum CpG methylation values; boxes indicate inter-quartile range, with the median marked. Significant enrichments were detected by one-way ANOVA and are indicated by *** (p < 0.001). (D) GATA2 5′ DNA specific pyrosequencing assays were performed on bisulphite converted DNA prepared from REH, NALM-6 and UT-7 cells. DNA methylation was assessed at 5 CpG sites in triplicate. Whiskers indicate Tukey minimum and maximum CpG methylation values; boxes indicate inter-quartile range, with the median marked. Significant enrichments were detected by one-way ANOVA and are indicated by *** (p < 0.001).
We investigated the effect of Decitabine on the EPOR promoter in NALM-6 cells, see Supplementary Figure 8A. Of the 18 CpG sites analyzed, 15 showed statistically significant decreases in methylation after treatment with Decitabine in the range 50 to 500 nM. CpG sites 7, 8 and 18 have low DNA methylation status which did not change upon Decitabine treatment. No significant changes in methylation status of the EPOR promoter were found in REH cells after treatment with Decitabine, see Supplementary Figure 9A.
The effect of Decitabine on the GATA2 promoter methylation status in NALM-6 cells is shown in Supplementary Figure 8B. Decitabine in the range 50 to 500 nM caused significant reductions in percentage methylation at all five of the CpG sites. The effect of Decitabine on GATA2 promoter methylation status was less marked in REH cells (Supplementary Figure 9B). Decitabine in the range 50 to 500 nM caused significant upregulation of GATA2 expression in both REH and NALM-6 cells. In contrast the changes in EPOR expression were minimal in both cell lines, see Figure 5.
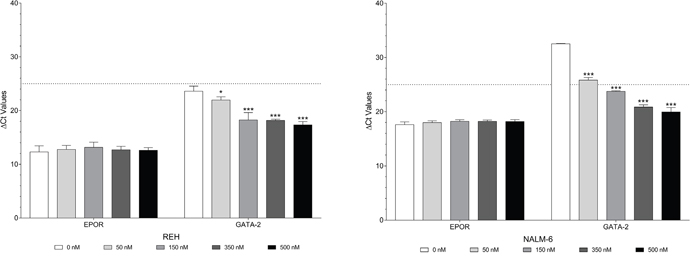
Figure 5: Decitabine causes demethylation of both EPOR and GATA2 but only increases expression of GATA2. EPOR and GATA2 expression in REH and NALM-6 cells after treatment with 50 to 500 nM Decitabine. Expression values were corrected to 18S ribosomal RNA levels. Mean corrected Ct values (±SD) are shown. Statistical differences compared to the control (0 nM Decitabine) are indicated by * (p < 0.05), ** (p < 0.01), or *** (p < 0.001) were calculated with the two-way ANOVA with Holm Sidak correction.
MicroRNAs are a class of epigenetic regulatory molecules that act at the post-transcriptional level to repress target genes by inhibition of translation and destabilization of mRNA [21]. Twenty-two miRNAs were predicted to target EPOR based on data collated from the Pareto Front predictive algorithm, the publicly available ‘miRecords’ target prediction meta-database, and a strongly negative “Probability of Interaction by Target Accessibility” (PITA) score (Figure 6A, Supplementary Methods, and Supplementary Table 4). Of these only miR-362-5p showed an overlap with those significantly up-regulated in NALM-6 cells (labeled in Figure 6C). Similarly, 21 miRNAs were predicted to target GATA2 based on the same criteria (Figure 6B and Supplementary Table 4). Of these only miR-650 was significantly up-regulated (labeled in Figure 6C). To investigate the miRNA profiles in REH and NALM-6 cells Taqman® microRNA arrays were performed in triplicate. The arrays allow simultaneous analysis of 667 miRNAs and showed that 11 miRNAs were significantly up-regulated and 20 miRNAs were significantly down-regulated in NALM-6 cells compared to REH cells (Figure 6C). Expression data obtained from microRNA array analysis were validated by single assay Q-PCR which confirmed that the expression of both miR-362 and miR-650 are higher in NALM-6 than in REH cells (Figure 6D).
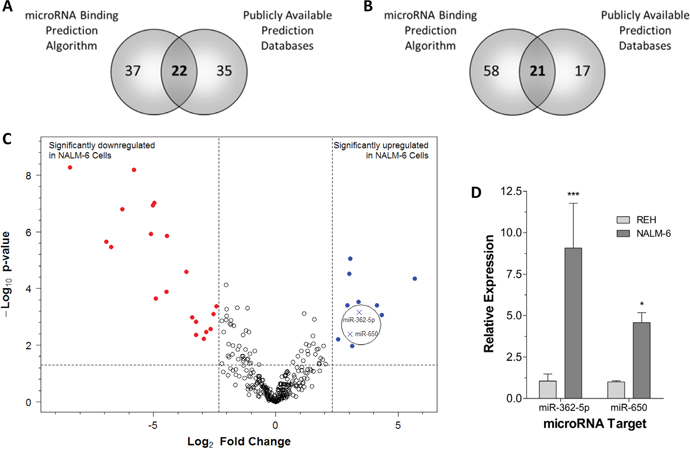
Figure 6: Expression of microRNAs predicted to target EPOR and GATA2 are increased in NALM-6 cells. (A) Venn diagram showing consensus between an in silico microRNA targeting algorithm [45] and publicly available prediction databases. MicroRNAs predicted to target EPOR were selected and overlapped. (B) Venn diagram showing consensus between an in silico microRNA targeting algorithm [45] and publicly available prediction databases. MicroRNAs predicted to target GATA2 were selected and overlapped. (C) Volcano plot of the differential expression of microRNAs between REH and NALM-6 cells and the associated nominal p-value. The expression of 670 microRNAs was analyzed in REH and NALM-6 cells in triplicate by Q-PCR using multiplex assays. Expression values were corrected to the mean RNU6 and RNU44 levels. Nominal p-values associated with the fold differences compared to NALM-6 were determined using the Bioconductor package ‘limma’. Selection criteria for significantly different expression were an absolute fold change ≥5 and a nominal p-value < 0.05. (D) The differential expression of selected microRNAs (miR-362-5p and miR-650) was validated in REH and NALM-6 cells in triplicate by Q-PCR using single microRNA assays. Expression values were corrected to the mean RNU6 and RNU44 levels. Mean relative expression levels (±SD) compared to REH are shown and statistical differences to REH were detected by two-way ANOVA and are indicated by * (p < 0.05) or *** (p < 0.001).
miR-362-5p, predicted to target EPOR, was over-expressed in REH cells, confirmed by Q-PCR, (Figure 7A & 7B) and a modest, but not significant, decrease in EPOR mRNA expression was observed after 72 hr. However, a four-fold decrease in EPOR protein levels was observed at 72 hr post-transfection with miR-362-5p (Figure 7C). These data suggest that miR-362-5p can regulate EPOR expression in REH cells. The overexpression of miR-650, predicted to target GATA2, in REH cells was confirmed by Q-PCR (Figure 7D & 7E). Both GATA2 and EPOR mRNA and protein expression were examined at 24 hr and 72 hr post-transfection. A decrease in GATA2 mRNA was observed after 72 hr, but did not reach statistical significance; however, a seven-fold decrease in GATA2 protein was found after 72 hr. EPOR expression of both mRNA and protein decreased by approximately 30% at 72 hr post-transfection with miR-650. Overall our data suggest that miR-650 regulates GATA2 protein expression and as a consequence EPOR expression whilst miR-362-5p regulates EPOR expression in REH cells.
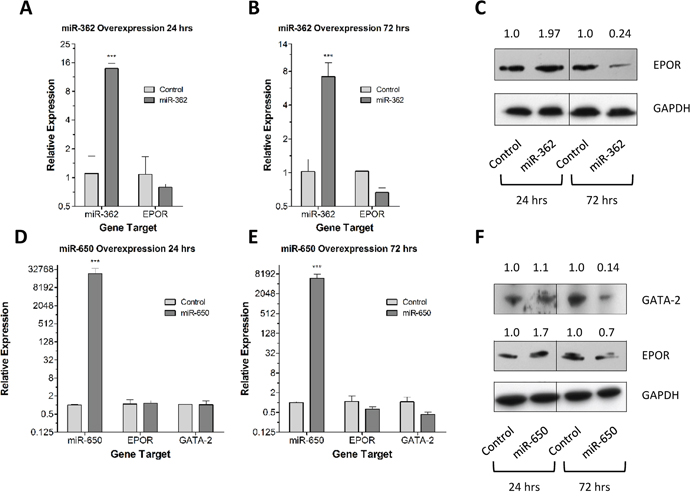
Figure 7. Forced expression of miR-362-5p and miR-650 reduces EPOR and GATA2 expression. (A) The expression of miR-362-5p and EPOR were analyzed in REH cells in triplicate by Q-PCR 24 hr post-transfection with a miR-362-5p expression vector. Expression values were corrected to 18S ribosomal RNA levels. Mean relative expression levels (±SD) compared to empty vector controls are shown and statistical differences to control were detected by one-way ANOVA and are indicated by *** (p < 0.001). (B) The expression of miR-362-5p and EPOR were analyzed in REH cells in triplicate by Q-PCR 72 hr post-transfection with a miR-362-5p expression vector. Expression values were corrected to 18S ribosomal RNA levels. Mean relative expression levels (±SD) compared to empty vector controls are shown and statistical differences to control were detected by one-way ANOVA and are indicated by *** (p < 0.001). (C) Western blot analysis of EPOR expression in protein extracted from REH cells 24 hr. and 72 hr. post-transfection with a miR-362-5p expression vector. GAPDH was used as a loading control. EPOR expression levels were calculated relative to htR (EV control) by densitometric analysis using GAPDH as a normalization factor. (D) The expression of miR-650, EPOR and GATA2 were analyzed in REH cells in triplicate by Q-PCR 24 hr. post-transfection with a miR-650 mimetic oligo. Expression values were corrected to 18S ribosomal RNA levels. Mean relative expression levels (±SD) compared to scrambled oligo controls are shown and statistical differences to control were detected by one-way ANOVA and are indicated by *** (p < 0.001). (E) The expression of miR-650, EPOR and GATA2 were analyzed in REH cells in triplicate by Q-PCR 72 hr. post-transfection with a miR-650 mimetic oligo. Expression values were corrected to 18S ribosomal RNA levels. Mean relative expression levels (±SD) compared to scrambled oligo controls are shown and statistical differences to control were detected by one-way ANOVA and are indicated by *** (p < 0.001). (F) Western blot analysis of EPOR and GATA2 expression in protein extracted from REH cells 24 hr. and 72 hr. post-transfection with a miR-650 mimetic oligo. GAPDH was used as a loading control. EPOR and GATA2 expression levels were calculated relative to scrambled oligo control by densitometric analysis using GAPDH as a normalization factor.
DISCUSSION
The EPOR promoter is unusual because it lacks a TATA box in the core promoter region, but it does contain functional SP-1 and GATA binding sequences. SP-1 is a ubiquitous transcription factor unlikely to drive lineage-specific expression of EPOR. Since GATA1 is an obligatory transcription factor for EPOR expression in erythroid cells, but is expressed at extremely low levels in B cell progenitors, it was important to determine if other members of the GATA family might contribute to the increased expression of EPOR found in ETV6/RUNX1-positive cells. Of the six GATA family members only GATA2 was found to be differentially expressed with substantially higher levels present in REH cells, i.e. those with the t(12;21) translocation.
GATA2 has a pivotal role in hematopoietic stem and progenitor cell development and its expression decreases with differentiation implying that GATA2 is necessary to maintain pluripotency [22]. The data indicate that GATA2 is a regulator of the EPOR gene in t(12;21) B cell ALL. This is supported by pediatric t(12;21) ALL patients and ETV6/RUNX1-positive cells having both highly expressed levels of EPOR and GATA2 with a strong positive correlation. This trend was confirmed by in silico analysis of the MILE expression profiling data (GSE13159) which showed that GATA2 was more highly expressed and exhibits a stronger correlation with EPOR expression in ALL patients with the t(12;21) translocation.
High GATA2 expression is a poor prognostic marker in pediatric myeloid leukemia. Following chemotherapy GATA2 was found to be normalized in patients in complete remission but remained high in those with resistant disease [23]. Recently it has been reported that reduction of GATA2 by shRNA or the inhibitor K7174 sensitizes KG1a acute myeloid leukemia cells to chemotherapy [24], suggesting that suppression of GATA2 expression or inhibition of its transcriptional activity may have potential as an ancillary therapy in AML.
GATA2 is overexpressed in acute myeloid leukemia (AML) and loss-of-function mutations have been causally linked to immunodeficiency associated with the myelodysplastic syndromes (MDS), suggesting that an appropriate level of GATA2 activity is a prerequisite for normal hematopoiesis [25]. The role of GATA2 as a tumor suppressor remains to be defined. Vicente and colleagues have proposed a transcriptional network involved in the emergence of hematopoietic stem cells in which GATA2, FLI1 and SCL form a complex that is recruited to the RUNX1 enhancer, activating its transcription [25]. Mutations in any of the constituent genes may perturb this regulatory system and alter the phenotype of the daughter cells.
A mechanistic link between RAS, which harbors activating mutations in 30% of all human cancers, and GATA2 has recently been uncovered [26]. Downstream from RAS, MAPK p38 phosphorylates a number of residues in GATA2, the most critical of which is S192, leading to GATA2 transcriptional activity. In this context GATA3 has also been found to promote cycling of hematopoietic stem cells and to restrict the long-term reconstitutive potential downstream of p38 in stress-induced hematopoiesis [27]. GATA2 transcription is regulated by several transcription factors including ETS1, BMP4, NOTCH1, PU.1 and EVI1 (reviewed by Vicente [25]). The regulatory elements also contain GATA motifs so that GATA2 expression is regulated both by itself and by GATA1.
The UT-7/Epo sub-line was derived through continuous long-term culture of the human leukemic cell line UT-7 in the presence of EPO [28]. The higher levels of GATA1 mRNA found in UT-7/Epo compared to UT-7 cells indicated that the cells of the sub-line were committed to the erythroid lineage. Apart from the special case of UT-7/Epo cells there is little evidence that EPO can stimulate leukemic cell proliferation, though in principle survival and proliferation of leukemic cells could be enhanced by presence of functional EPO receptors.
Beyond the hematopoietic compartment EPO can induce GATA3 and GATA4 leading to the up-regulation of EPOR expression. Thus EPO stimulation of myoblasts causes up-regulation of GATA3, GATA4 and another basic-helix-loop-helix factor, TAL1. In turn, these transcription factors up-regulate EPOR expression in the myoblast [29, 30]. Moreover EPOR expression in neural NT2 cells can be trans-activated by GATA3, which is required for brain development [31]. These observations highlight the ability of different GATA factors to trans-activate the erythropoietin receptor in the context of cellular phenotype.
The different genetic sub-types of ALL can be characterized by distinct DNA methylation signatures that demonstrate significant correlation with expression profiles [32]. EPOR was one of sixteen genes found to be specifically hypo-methylated in the t(12;21) subtype and associated with increased mRNA expression [33]. Higher methylation of one CpG site in GATA2 was found in sub-types of ALL, compared to controls, but no difference was found between the t(12;21) and hyperdiploid sub-types [34].
In the present work, GATA2 was found to bind to EPOR downstream of the transcriptional start site in REH cells but not in NALM-6 cells and overexpression of GATA2 increased EPOR production only in REH cells, supporting the suggestion that other regulatory mechanisms are involved. DNA methylation analysis of EPOR showed approximately 7-fold higher levels of methylation in the ETV6/RUNX1-negative NALM-6 cells compared to REH and UT-7. Methylation of 15 of 18 CpGs located 5' of the EPOR promoter was higher in NALM-6 than in REH cells, but one of the three exceptions was the most proximal CpG to the GATA binding site identified by ChIP. Similarly the GATA2 promoter region of NALM-6 showed 4- and 5-fold higher levels of methylation compared to REH and UT-7 cells respectively.
Decitabine caused significant demethylation of 15 of the 18 CpG sites analyzed on the EPOR promoter in NALM-6 cells, but this did not lead to increased EPOR expression. Similarly, Decitabine reduced an already low level of methylation of the EPOR promoter in REH cells, but did not cause increased EPOR expression. Decitabine caused significant reductions in methylation of all five CpG sites analyzed in the GATA2 promoter in both NALM-6 and REH cells and led to increased GATA2 expression in both cell lines.
MicroRNAs are short non-coding RNA molecules of 19-25 nucleotides with the capacity to regulate genes post-transcriptionally by silencing specific gene expression and inhibiting protein translation [21]. miRNAs are involved in a wide range of biological processes, and can function as instructive determinants of cell fate during ontogeny. miRNAs are frequently dysregulated in human cancers, including leukemia: some exert tumor suppressive effects while others promote cancer progression by enhancing tumor growth, angiogenesis, invasion and immune evasion [35]. A global reduction in miRNA expression has been found in cancer and different types of leukemia [36].
Deletion models show that miRNAs are essential regulators of hematopoietic stem and progenitor cell survival, differentiation and function [37]. miRNAs can function as instructive determinants of cell fate during ontogeny. miR-142-3p is absolutely conserved across vertebrates and modulates the maturation of myeloid, erythroid and T cell lineages. Recent work indicates that miR-142-3p functions as a master regulator of HSC specification in Xenopus development by controlling a growth regulatory network which includes tgfbr1, fli1 and gata2 [38].
miRNAs which were significantly differentially expressed between REH and NALM-6 cells were compared to those predicted by miRecords and Pareto Front analysis to identify those likely to cause down-regulation of EPOR and GATA2. Overexpression of miR-362 caused down-regulation of EPOR protein levels. Similarly, overexpression of miR-650 caused down-regulation of both GATA2 and EPOR, providing further evidence for a functional relationship between GATA2 and EPOR.
The exact roles of mir-362 and mir-650 in the growth regulatory networks of hematopoietic cells and in the genetic sub-types of leukemic cells remain to be defined. Whereas both microRNAs are differentially expressed in the REH and NALM-6 cell line models, neither was found to be differentially expressed when seven subtypes of ALL were compared in a comprehensive study of 81 childhood cases using 397 microRNAs [39].
It is of interest that mir-362 is up-regulated by EPO in UT-7 cells [40], which suggests that mir-362 forms part of a feedback loop to downregulate EPOR following EPO-induced activation of the receptor. miR-362-5p has also been reported to act as an oncomiR by down-regulating GADD45α, which in turn activated the JNK1/2 and P38 signaling in CML patient samples [41]. miR-650 has been reported to target proteins important for B cell proliferation and survival and to affect the biology of chronic lymphocytic leukemia [42].
The GATA gene family activates and represses target genes through multiple mechanisms in a context-dependent manner (reviewed by Bresnick [18]). The present work has provided evidence that GATA2 can up-regulate EPOR in ETV6/RUNX1 positive sub-type of B-ALL. This up-regulation occurs via a complex series of epigenetic, transcriptional, and post-transcriptional events which are context-dependent. However, the elucidation of these relationships between GATA2 and EPOR in other subtypes of B-ALL will be required to determine their clinical and therapeutic potential.
MATERIALS AND METHODS
Cell lines and patient samples
Details of the cell lines and culture conditions are shown in Supplementary Methods and Supplementary Table 1. Gene expression data were extracted from the Microarray Innnovations in LEukemia (MILE) Study [20], Gene Expression Omnibus accession number GSE13159.
RNA and DNA extraction
Total RNA and genomic DNA were isolated using the RNeasy Mini Kit and the DNeasy Blood and Tissue Kit (Qiagen). Purity and concentration were evaluated using a NanoDrop 1000 Spectrophotometer (Thermo Scientific). RNA was prepared from bone marrow of ALL patients [43].
MicroRNA extraction and array analysis
Total RNA was extracted using mirVana™ miRNA Isolation kits (Ambion). The Taqman® MicroRNA Reverse Transcription kit and Megaplex™ RT Primers (Applied Biosystems) were used to synthesize ss-cDNA. MicroRNAs were quantified using Taqman® Human microRNA array cards (Applied Biosystems) and Partek-GSS. Target prediction was performed using miRecords [44] and Pareto Front analysis software [45]. Validation assays were performed using Taqman® MicroRNA Assays.
Quantitative real-time PCR (Q-PCR)
Cell-line cDNA was generated using M-MLV Reverse Transcriptase (Invitrogen). Patient cDNA was generated using Superscript III First Strand Synthesis System (Invitrogen). Q-PCR was performed on the 7900HT Fast Real-Time PCR System (Applied Biosystems). EPOR and GATA1-6 expression was measured using Taqman probes (Applied Biosystems). ETV6/RUNX1 fusion expression was measured using SYBR Green primers (Roche; available on request).
Pyrosequencing (Qiagen)
Primers were designed using PyroMark Assay Design 2.0 software (Supplementary Table 2). Genomic DNA was deaminated using an EpiTect Bisulfite Kit and complete conversion checked by Calponin PCR [46]. Regions of interest were amplified using the PyroMark PCR kit before pyrosequencing on a Q24 Instrument (Qiagen).
Decitabine treatment of cells
To 3x10⁶ REH or NALM-6 cells 5-Aza-2'-deoxycytidine (Decitabine; Sigma-Aldrich) was added to give final concentrations of 50 nM, 150 nM, 350 nM and 500 nM. Water served as the untreated control. After each 48 hour interval the cells were pelleted and resuspended in 3 ml of media and freshly prepared Decitabine. After 7 days, the period required for four doublings for each cell line, pellets prepared from 1.5 ml of each cell suspension were used for RNA and DNA extraction.
Protein extraction and western blotting
Protein, extracted using RIPA buffer and quantitated using the Pierce BCA Protein Assay, was resolved by SDS-PAGE (12%). Protein was transferred to nitrocellulose membrane (Sigma), incubated with anti-EPOR, anti-GATA2, or anti-GAPDH antibodies overnight at 4°C and visualized using Advansta WesternBright ECL (MyBio). Band density was analyzed using Li-Cor Image Studio Lite version 4.0. The EPOR antibody was a murine monoclonal obtained from Abnova cat no: H00002057-M01. The GATA2 antibody was a rabbit polyclonal obtained from Abcam cat no: ab22849.
Chromatin immunoprecipitation
Chromatin immunoprecipitation was performed as previously described [47]. Briefly, chromatin was isolated from formaldehyde-cross-linked REH and NALM-6 cells, sheared by sonication and immunoprecipitated overnight with anti-GATA2 antibodies bound to magnetic beads (Invitrogen). Isolated complexes were washed before reversal of the DNA-protein cross-linking and DNA purification by QIAquick columns (Qiagen). DNA was subjected to Q-PCR analysis with gene promoter or non-specific region primers to evaluate promoter DNA enrichment.
Over-expression of GATA2, miR-650 (pre-miR-650) and miR-362
Cells were seeded 24 hr. before transfection with 2 μg of negative control (pENTR221-β-glucuronidase), GATA2 (pENTR221-GATA2) or GFP vector using an Amaxa Nucleofector I Device. Nucleofector Kit T and Kit R (Lonza) were used to transfect NALM-6 and REH respectively. At 72 hr. samples were taken for Q-PCR or western blot. REH cells were transfected with 30 nM pre-miR-650 (Ambion) or FAM-labeled Pre-mir Negative Control #1 (Applied Biosystems). Identical methods were used to transfect with miR-362 or control htr vectors [48] obtained from the Human miRNA Library (Source BioScience).
Author contributions
MEG, DJS, JSS, HAAC, VMH contributed to the data and analysis; MEG, DJS, HAAC, TRL and KIM wrote the manuscript; the project was formulated by TRL and KIM.
ACKNOWLEDGMENTS
We gratefully acknowledge the gift of the pediatric ALL RNA samples from Prof Jan Trka and Dr Markéta Žaliová from the Department of Pediatric Haematology/Oncology, 2nd Medical School, Charles University Prague, Czech Republic.
CONFLICTS OF INTEREST
The authors do not have any conflicts of interest to declare.
FUNDING
This work was supported by Leukaemia and Lymphoma Northern Ireland (LLNI) (Grant R2536CNR), the Northern Ireland Department of Employment and Learning, and the Elimination of Leukaemia Fund (ELF).
REFERENCES
1. Yeoh EJ, Ross ME, Shurtleff SA, Williams WK, Patel D, Mahfouz R, Behm FG, Raimondi SC, Relling MV, Patel A, Cheng C, Campana D, Wilkins D, et al. Classification, subtype discovery, and prediction of outcome in pediatric acute lymphoblastic leukemia by gene expression profiling. Cancer Cell. 2002; 1:133-43.
2. Ross ME, Zhou X, Song G, Shurtleff SA, Girtman K, Williams WK, Liu HC, Mahfouz R, Raimondi SC, Lenny N, Patel A, Downing JR. Classification of pediatric acute lymphoblastic leukemia by gene expression profiling. Blood. 2003; 102:2951-9. https://doi.org/10.1182/blood-2003-01-0338.
3. Fine BM, Stanulla M, Schrappe M, Ho M, Viehmann S, Harbott J, Boxer LM. Gene expression patterns associated with recurrent chromosomal translocations in acute lymphoblastic leukemia. Blood. 2004; 103:1043-9. https://doi.org/10.1182/blood-2003-05-1518.
4. Den Boer ML, van Slegtenhorst M, De Menezes RX, Cheok MH, Buijs-Gladdines JG, Peters ST, Van Zutven LJ, Beverloo HB, Van der Spek PJ, Escherich G, Horstmann MA, Janka-Schaub GE, Kamps WA, et al. A subtype of childhood acute lymphoblastic leukaemia with poor treatment outcome: a genome-wide classification study. Lancet Oncol. 2009; 10:125-34. https://doi.org/10.1016/S1470-2045(08)70339-5.
5. Inthal A, Krapf G, Beck D, Joas R, Kauer MO, Orel L, Fuka G, Mann G, Panzer-Grumayer ER. Role of the erythropoietin receptor in ETV6/RUNX1-positive acute lymphoblastic leukemia. Clin Cancer Res. 2008; 14:7196-204. https://doi.org/10.1158/1078-0432.CCR-07-5051.
6. Torrano V, Procter J, Cardus P, Greaves M, Ford AM. ETV6-RUNX1 promotes survival of early B lineage progenitor cells via a dysregulated erythropoietin receptor. Blood. 2011; 118:4910-8. https://doi.org/10.1182/blood-2011-05-354266.
7. Hill JW, Cong Z, Hess G, McGarvey N, Nordyke RJ. Hemoglobin decline in chemotherapy patients prior to and after policy changes affecting use of erythropoiesis-stimulating agents: 2006-2009. J Int Med Res. 2012; 40:1532-45. https://doi.org/10.1177/147323001204000433.
8. Suzuki M, Moriguchi T, Ohneda K, Yamamoto M. Differential contribution of the Gata1 gene hematopoietic enhancer to erythroid differentiation. Mol Cell Biol. 2009; 29:1163-75. https://doi.org/10.1128/MCB.01572-08.
9. Chiba T, Ikawa Y, Todokoro K. GATA-1 transactivates erythropoietin receptor gene, and erythropoietin receptor-mediated signals enhance GATA-1 gene expression. Nucleic Acids Res. 1991; 19:3843-8.
10. Tsai FY, Orkin SH. Transcription factor GATA-2 is required for proliferation/survival of early hematopoietic cells and mast cell formation, but not for erythroid and myeloid terminal differentiation. Blood. 1997; 89:3636-43.
11. Orkin SH. Hematopoiesis: how does it happen? Curr Opin Cell Biol. 1995; 7:870-7.
12. Ling KW, Ottersbach K, van Hamburg JP, Oziemlak A, Tsai FY, Orkin SH, Ploemacher R, Hendriks RW, Dzierzak E. GATA-2 plays two functionally distinct roles during the ontogeny of hematopoietic stem cells. J Exp Med. 2004; 200:871-82. https://doi.org/10.1084/jem.20031556.
13. Tsai FY, Keller G, Kuo FC, Weiss M, Chen J, Rosenblatt M, Alt FW, Orkin SH. An early haematopoietic defect in mice lacking the transcription factor GATA-2. Nature. 1994; 371:221-6. https://doi.org/10.1038/371221a0.
14. Ho IC, Vorhees P, Marin N, Oakley BK, Tsai SF, Orkin SH, Leiden JM. Human GATA-3: a lineage-restricted transcription factor that regulates the expression of the T cell receptor alpha gene. EMBO J. 1991; 10:1187-92.
15. Ko LJ, Yamamoto M, Leonard MW, George KM, Ting P, Engel JD. Murine and human T-lymphocyte GATA-3 factors mediate transcription through a cis-regulatory element within the human T-cell receptor delta gene enhancer. Mol Cell Biol. 1991; 11:2778-84.
16. Pandolfi PP, Roth ME, Karis A, Leonard MW, Dzierzak E, Grosveld FG, Engel JD, Lindenbaum MH. Targeted disruption of the GATA3 gene causes severe abnormalities in the nervous system and in fetal liver haematopoiesis. Nat Genet. 1995; 11:40-4. https://doi.org/10.1038/ng0995-40.
17. Perez-Andreu V, Roberts KG, Harvey RC, Yang W, Cheng C, Pei D, Xu H, Gastier-Foster J, Shuyu E, Lim JY, Chen IM, Fan Y, Devidas M, et al. Inherited GATA3 variants are associated with Ph-like childhood acute lymphoblastic leukemia and risk of relapse. Nat Genet. 2013; 45:1494-8. https://doi.org/10.1038/ng.2803.
18. Bresnick EH, Katsumura KR, Lee HY, Johnson KD, Perkins AS. Master regulatory GATA transcription factors: mechanistic principles and emerging links to hematologic malignancies. Nucleic Acids Res. 2012; 40:5819-31. https://doi.org/10.1093/nar/gks281.
19. Dore LC, Crispino JD. Transcription factor networks in erythroid cell and megakaryocyte development. Blood. 2011; 118:231-9. https://doi.org/10.1182/blood-2011-04-285981.
20. Haferlach T, Kohlmann A, Wieczorek L, Basso G, Kronnie GT, Bene MC, De Vos J, Hernandez JM, Hofmann WK, Mills KI, Gilkes A, Chiaretti S, Shurtleff SA, et al. Clinical utility of microarray-based gene expression profiling in the diagnosis and subclassification of leukemia: report from the International Microarray Innovations in Leukemia Study Group. J Clin Oncol. 2010; 28:2529-37. https://doi.org/10.1200/JCO.2009.23.4732.
21. Nimmo RA, Slack FJ. An elegant miRror: microRNAs in stem cells, developmental timing and cancer. Chromosoma. 2009; 118:405-18. https://doi.org/10.1007/s00412-009-0210-z.
22. Baumgartner C, Baccarini M. p38 links RAS to GATA2. EMBO Rep. 2014; 15:912-3. https://doi.org/10.15252/embr.201439309.
23. Luesink M, Hollink IH, van der Velden VH, Knops RH, Boezeman JB, de Haas V, Trka J, Baruchel A, Reinhardt D, van der Reijden BA, van den Heuvel-Eibrink MM, Zwaan CM, Jansen JH. High GATA2 expression is a poor prognostic marker in pediatric acute myeloid leukemia. Blood. 2012; 120:2064-75. https://doi.org/10.1182/blood-2011-12-397083.
24. Yang L, Sun H, Cao Y, Xuan B, Fan Y, Sheng H, Zhuang W. GATA2 inhibition sensitizes acute myeloid leukemia cells to chemotherapy. PLoS One. 2017; 12:e0170630. https://doi.org/10.1371/journal.pone.0170630.
25. Vicente C, Conchillo A, Garcia-Sanchez MA, Odero MD. The role of the GATA2 transcription factor in normal and malignant hematopoiesis. Crit Rev Oncol Hematol. 2012; 82:1-17. https://doi.org/10.1016/j.critrevonc.2011.04.007.
26. Katsumura KR, Yang C, Boyer ME, Li L, Bresnick EH. Molecular basis of crosstalk between oncogenic Ras and the master regulator of hematopoiesis GATA-2. EMBO Rep. 2014; 15:938-47. https://doi.org/10.15252/embr.201438808.
27. Frelin C, Herrington R, Janmohamed S, Barbara M, Tran G, Paige CJ, Benveniste P, Zuniga-Pflucker JC, Souabni A, Busslinger M, Iscove NN. GATA-3 regulates the self-renewal of long-term hematopoietic stem cells. Nat Immunol. 2013; 14:1037-44. https://doi.org/10.1038/ni.2692.
28. Komatsu N, Yamamoto M, Fujita H, Miwa A, Hatake K, Endo T, Okano H, Katsube T, Fukumaki Y, Sassa S, Miura Y. Establishment and characterization of an erythropoietin-dependent subline, UT-7/Epo, derived from human leukemia cell line, UT-7. Blood. 1993; 82:456-64.
29. Wang L, Jia Y, Rogers H, Wu YP, Huang S, Noguchi CT. GATA-binding protein 4 (GATA-4) and T-cell acute leukemia 1 (TAL1) regulate myogenic differentiation and erythropoietin response via cross-talk with Sirtuin1 (Sirt1). J Biol Chem. 2012; 287:30157-69. https://doi.org/10.1074/jbc.M112.376640.
30. Jia Y, Suzuki N, Yamamoto M, Gassmann M, Noguchi CT. Endogenous erythropoietin signaling facilitates skeletal muscle repair and recovery following pharmacologically induced damage. FASEB J. 2012; 26:2847-58. https://doi.org/10.1096/fj.11-196618.
31. Tsarovina K, Reiff T, Stubbusch J, Kurek D, Grosveld FG, Parlato R, Schutz G, Rohrer H. The Gata3 transcription factor is required for the survival of embryonic and adult sympathetic neurons. J Neurosci. 2010; 30:10833-43. https://doi.org/10.1523/JNEUROSCI.0175-10.2010.
32. Figueroa ME, Chen SC, Andersson AK, Phillips LA, Li Y, Sotzen J, Kundu M, Downing JR, Melnick A, Mullighan CG. Integrated genetic and epigenetic analysis of childhood acute lymphoblastic leukemia. J Clin Invest. 2013; 123:3099-111. https://doi.org/10.1172/JCI66203.
33. Busche S, Ge B, Vidal R, Spinella JF, Saillour V, Richer C, Healy J, Chen SH, Droit A, Sinnett D, Pastinen T. Integration of high-resolution methylome and transcriptome analyses to dissect epigenomic changes in childhood acute lymphoblastic leukemia. Cancer Res. 2013; 73:4323-36. https://doi.org/10.1158/0008-5472.CAN-12-4367.
34. Nordlund J, Backlin CL, Wahlberg P, Busche S, Berglund EC, Eloranta ML, Flaegstad T, Forestier E, Frost BM, Harila-Saari A, Heyman M, Jonsson OG, Larsson R, et al. Genome-wide signatures of differential DNA methylation in pediatric acute lymphoblastic leukemia. Genome Biol. 2013; 14:r105. https://doi.org/10.1186/gb-2013-14-9-r105.
35. Hayes J, Peruzzi PP, Lawler S. MicroRNAs in cancer: biomarkers, functions and therapy. Trends Mol Med. 2014; 20:460-9. https://doi.org/10.1016/j.molmed.2014.06.005.
36. Lu J, Getz G, Miska EA, Alvarez-Saavedra E, Lamb J, Peck D, Sweet-Cordero A, Ebert BL, Mak RH, Ferrando AA, Downing JR, Jacks T, Horvitz HR, et al. MicroRNA expression profiles classify human cancers. Nature. 2005; 435:834-8. https://doi.org/10.1038/nature03702.
37. Alemdehy MF, Erkeland SJ. Stop the dicing in hematopoiesis: what have we learned? Cell Cycle. 2012; 11:2799-807. https://doi.org/10.4161/cc.21077.
38. Nimmo R, Ciau-Uitz A, Ruiz-Herguido C, Soneji S, Bigas A, Patient R, Enver T. MiR-142-3p controls the specification of definitive hemangioblasts during ontogeny. Dev Cell. 2013; 26:237-49. https://doi.org/10.1016/j.devcel.2013.06.023.
39. Schotte D, De Menezes RX, Akbari Moqadam F, Khankahdani LM, Lange-Turenhout E, Chen C, Pieters R, Den Boer ML. MicroRNA characterize genetic diversity and drug resistance in pediatric acute lymphoblastic leukemia. Haematologica. 2011; 96:703-11. https://doi.org/10.3324/haematol.2010.026138.
40. Kosaka N, Sugiura K, Yamamoto Y, Yoshioka Y, Miyazaki H, Komatsu N, Ochiya T, Kato T. Identification of erythropoietin-induced microRNAs in haematopoietic cells during erythroid differentiation. Br J Haematol. 2008; 142:293-300. https://doi.org/10.1111/j.1365-2141.2008.07151.x.
41. Yang P, Ni F, Deng RQ, Qiang G, Zhao H, Yang MZ, Wang XY, Xu YZ, Chen L, Chen DL, Chen ZJ, Kan LX, Wang SY. MiR-362-5p promotes the malignancy of chronic myelocytic leukaemia via down-regulation of GADD45alpha. Mol Cancer. 2015; 14:190. https://doi.org/10.1186/s12943-015-0465-3.
42. Mraz M, Dolezalova D, Plevova K, Stano Kozubik K, Mayerova V, Cerna K, Musilova K, Tichy B, Pavlova S, Borsky M, Verner J, Doubek M, Brychtova Y, et al. MicroRNA-650 expression is influenced by immunoglobulin gene rearrangement and affects the biology of chronic lymphocytic leukemia. Blood. 2012; 119:2110-3. https://doi.org/10.1182/blood-2011-11-394874.
43. Cario G, Stanulla M, Fine BM, Teuffel O, Neuhoff NV, Schrauder A, Flohr T, Schafer BW, Bartram CR, Welte K, Schlegelberger B, Schrappe M. Distinct gene expression profiles determine molecular treatment response in childhood acute lymphoblastic leukemia. Blood. 2005; 105:821-6. https://doi.org/10.1182/blood-2004-04-1552.
44. Xiao F, Zuo Z, Cai G, Kang S, Gao X, Li T. miRecords: an integrated resource for microRNA-target interactions. Nucleic Acids Res. 2009; 37:D105-10. https://doi.org/10.1093/nar/gkn851.
45. Sahoo S, Albrecht AA. Ranking of microRNA target prediction scores by Pareto front analysis. Comput Biol Chem. 2010; 34:284-92. https://doi.org/10.1016/j.compbiolchem.2010.09.005.
46. Pettigrew KA, Armstrong RN, Colyer HA, Zhang SD, Rea IM, Jones RE, Baird DM, Mills KI. Differential TERT promoter methylation and response to 5-aza-2'-deoxycytidine in acute myeloid leukemia cell lines: TERT expression, telomerase activity, telomere length, and cell death. Genes Chromosomes Cancer. 2012; 51:768-80. https://doi.org/10.1002/gcc.21962.
47. Hosey AM, Gorski JJ, Murray MM, Quinn JE, Chung WY, Stewart GE, James CR, Farragher SM, Mulligan JM, Scott AN, Dervan PA, Johnston PG, Couch FJ, et al. Molecular basis for estrogen receptor alpha deficiency in BRCA1-linked breast cancer. J Natl Cancer Inst. 2007; 99:1683-94. https://doi.org/10.1093/jnci/djm207.
48. Voorhoeve PM, le Sage C, Schrier M, Gillis AJ, Stoop H, Nagel R, Liu YP, van Duijse J, Drost J, Griekspoor A, Zlotorynski E, Yabuta N, De Vita G, et al. A genetic screen implicates miRNA-372 and miRNA-373 as oncogenes in testicular germ cell tumors. Cell. 2006; 124:1169-81. https://doi.org/10.1016/j.cell.2006.02.037.