
INTRODUCTION
Nasopharyngeal carcinoma (NPC) is one of the most common malignant tumors in Southern China and Southeast Asia, with the incidence as high as 20~50 of 100,000, which is 20~50 times higher of Western world (1 of 100,000) [1]. Currently, radiation therapy is a key modality in the treatment of NPC. Moreover, when radiotherapy is combined with chemotherapy or other targeted therapies, treatment efficiency is improved [2]. However, there still have a small group of patients have to suffer chemoradiotherapy resistance and a spectrum of severe side effects (toxicities) [3]. The occurrence of serious toxicity and treatment resistance not only bring pain for the patients but also block the scheduled treatment procedure. It is not unusual to see that a large patient-to-patient variability exists in chemoradiotherapy response despite uniform treatment protocols. Although some of this may be ascribed to comorbidities, body habitus and stochastic factors, it has become increasingly believed that genetic background takes a leading role in the interindividual variation in chemoradiotherapy response [4].
Long non-coding RNAs (lncRNAs) are noncoding RNAs with more than 200 nucleotide in length. Although with limited protein coding capability, lncRNAs play an important role in a number of biological processes, including chromatin modification, transcription processing, RNA-RNA interactions, and post-transcription regulation [5]. Increasing evidence have indicated lncRNA played a role in carcinogenesis and could be diagnostic or prognostic biomarkers for cancer. In the past decades, numerous studies have linked genetic variation in miRNA (a kind of non-coding RNA) sequences to cancer risk and prognosis, yet little is known about lncRNA SNPs [6]. Genetic variants in lncRNAs have the potential to exert broad impact as they can affect their biogenesis, processing, and target site binding in a variety of ways.
Located at 1q25, growth arrest-specific 5 (GAS5) encodes multiple small nucleolar RNAs (snoRNAs) within its introns, while exonic sequences produce lncRNA which can act as a riborepressor of the glucocorticoid and related receptors [7]. lncRNA GAS5 was previously identified to be down-regulated and functions as a tumor suppressor gene in many kinds of cancers, including breast cancer, prostate cancer, pancreatic cancer, bladder cancer, lung cancer, gastric cancer, glioma, hepatocellular carcinoma, cervical cancer, pleural mesothelioma and so on [8-17]. GAS5 plays a pivotal role in the control of cell survival and proliferation by sensitizing mammalian cells to apoptosis and promoting G1 cell cycle arrest [18]. Accumulating studies have identified GAS5 as a potential biomarker for cancer susceptibility, metastasis, as well as survival. Nevertheless, no one has linked GAS5 SNP with NPC treatment responses [15, 16, 19-21].
In current study, we aim to evaluate the effects of SNPs in lncRNA GAS5 on clinical early toxic reactions and treatment efficacy in patients with nasopharyngeal carcinoma receiving chemoradiotherapy in a Chinese population. It is of importance to increase our understanding of the molecular pathogenesis of chemoradiotherapy response, find ways of predicting those patients likely to suffer with long term side effects and treatment resistance and develop new approaches for their amelioration.
RESULTS
Subjects characteristics and genotyping
The patient characteristics in the discovery stage and the validation stage were listed in Table 1. The median age at the time of diagnosis was 47 years (ranging 15–73 years) for all the 505 patients. There were 374 male and 131 female patients, with a male-to-female ratio of 2.85. Most of the patients (90.1%) were diagnosed at late stages (III and IV), and the remaining (9.9%) were at early stages (I and II). All the patients received IMRT radiation technique and treated with IC plus CCRT regimen. The average pGTVnx irradiation dose was 71.34 Gy with NDP as the mostly used concurrent chemotherapy regimen. The toxic reactions incidence rate was 10.1% for severe dermatitis, 25.5% for severe oral mucositis, 24.0% for severe myelosuppression, 18.6% for severe neutropenia, 14.5% for severe leukopenia, 43.0% for anemia, and 19.4% for thrombocytopenia during the CCRT treatment period.
Table 1: Patient demographics and clinical characteristics
Patient characteristics |
Discovery stage (N=267) |
Validation stage (N=238) |
Combined cohort (N=505) |
|---|---|---|---|
Gender |
|||
Male |
205 (76.78) |
169 (71.0) |
374 (74.1) |
Female |
62 (23.22) |
69 (29.0) |
131 (25.9) |
Age, years |
|||
Mean±SD |
47.14±9.50 |
47.71±8.75 |
47.41±9.15 |
< 47 |
128 (47.94) |
101 (42.4) |
229 (45.3) |
≥ 47 |
139 (52.06) |
137 (57.6) |
276 (54.7) |
BMI |
|||
< 18.5 |
17 (6.37) |
13 (5.5) |
30 (5.9) |
18.5 ~ 24 |
148 (55.43) |
126 (52.9) |
274 (54.3) |
≥ 24 |
102 (38.2) |
99 (41.6) |
201 (39.8) |
Smoking status |
|||
Smoker |
129 (48.31) |
118 (49.6) |
247 (48.9) |
Nonsmoker |
138 (51.69) |
120 (50.4) |
258 (51.1) |
Drinking status |
|||
Drinker |
47 (17.60) |
43 (18.9) |
90 (17.8) |
Nondrinker |
220 (82.40) |
195 (81.9) |
415 (82.2) |
Histological type |
|||
WHO type II |
114 (42.70) |
100 (42.0) |
214 (42.4) |
WHO type III |
153 (57.30) |
138 (58.0) |
291 (57.6) |
Clinical stagea |
|||
I-II |
28 (10.49) |
22 (9.2) |
50 (9.9) |
III-IV |
239 (89.51) |
216 (90.8) |
455 (90.1) |
T-staging |
|||
T1-T2 |
139 (50.06) |
107 (45.0) |
246 (48.7) |
T3-T4 |
128 (49.94) |
131 (55.0) |
259 (51.3) |
N-staging |
|||
N0-N1 |
52 (19.47) |
41 (17.2) |
93 (18.4) |
N2-N3 |
215 (80.53) |
197 (82.8) |
412 (81.6) |
IC regimen |
|||
DP |
94 (35.20) |
106 (44.5) |
200 (39.6) |
FP |
54 (20.23) |
38 (16.0) |
92 (18.2) |
TP |
109 (40.82) |
94 (39.5) |
203 (40.2) |
GP |
10 (3.75) |
0 (0) |
10 (2) |
CCRT regimen |
|||
FP |
49 (18.35) |
36 (15.1) |
85 (16.8) |
TP |
51 (19.10) |
57 (23.9) |
108 (21.4) |
DDP |
35 (13.11) |
48 (20.2) |
83 (16.4) |
NDP |
108 (40.45) |
64 (26.9) |
172 (34.1) |
DP |
24 (8.99) |
33 (13.9) |
57 (11.3) |
pGTVnx (irradiation dose) |
|||
Mean±SD |
71.28±1.89 |
71.42±3.537 |
71.34±2.79 |
< 71.00Gy |
153 (57.30) |
100 (42.0) |
261 (51.7) |
≥71.00Gy |
114 (42.7) |
138 (58.0) |
234 (48.3) |
CCRT- induced toxic reactionsb |
|||
Grade 3-4 Dermatitis |
22 (8.2) |
29 (12.2) |
51 (10.1) |
Grade 3-4 Oral mucositis |
57 (21.3) |
72 (30.3) |
129 (25.5) |
Grade 3-4 Myelosuppression |
60 (22.5) |
61 (25.6) |
121 (24.0) |
Grade 3-4 Neutropenia |
50 (18.7) |
44 (18.5) |
94 (18.6) |
Grade 3-4 Leukopenia |
36 (13.5) |
37 (15.5) |
73 (14.5) |
Anemia |
105 (39.3) |
112 (47.1) |
217 (43.0) |
Thrombocytopenia |
56 (21.0) |
42 (17.6) |
98 (19.4) |
BMI, Body mass index.
CCRT, Concurrent chemoradiotherapy.
IC, Induction chemotherapy.
DP, Docetaxel + Cisplatin/Nedaplatin.
FP, 5-fluorouracil + Cisplatin/Nedaplatin.
TP, Paclitaxel + Cisplatin/Nedaplatin.
GP, Gemcitabine + Cisplatin/Nedaplatin.
DDP, Cisplatin alone.
NDP, Nedaplatin alone.
a2002 American Joint Committee on Cancer (AJCC) staging system.
bCommon Terminology Criteria for Adverse Events (CTCAE 3.0).
All of the three SNPs in both discovery set and validation set showed a call rate > 99%, and the genotype distributions were in accordance with HWE (p>0.05). Besides, the allele frequency in our study cohort was similar to the MAF of 1000 Genomes CHS database, as shown in Table 2.
Table 2: Characteristics of the candidate SNPs
SNP |
Chromosome |
Position |
Localization |
Regulatory feature |
miRNA-lncRNA target gain or loss |
Call rate (Discovery Stage) |
Call rate (Validation Stage) |
MAF (CHS) |
Allele frequency |
HWE (Discovery Stage/Validation Stage/Combined Stage) |
|---|---|---|---|---|---|---|---|---|---|---|
rs2067079 |
1 |
173866073 |
Intron |
Promoter/Enhancer |
√ |
100% |
99.2% |
0.271 |
0.272 |
0.405/0.549/0.292 |
rs6790 |
1 |
173865494 |
Exon |
Promoter/Enhancer |
× |
100% |
100% |
0.395 |
0.380 |
0.173/0.709/0.571 |
rs17359906 |
1 |
173867056 |
Intron |
Promoter/Enhancer |
√ |
100% |
--- |
0.081 |
0.054 |
0.800/--/-- |
HWE, Hardy-Weinberg equilibrium; MAF, minor allele frequency.
GAS5 SNPs and CCRT induced hematotoxicities
Multivariate logistic regression analysis was performed to identify the role of rs2067079, rs6790, rs17359906 on CCRT induced hematotoxicities in the discovery set of 267 NPC patients. We found that rs2067679 was significantly associated with severe myelosuppression (CT vs CC, OR=2.403, P=0.009), severe neutropenia (CT vs CC, OR=2.454, P=0.015), and severe leukopenia (CT vs CC, OR=2.938, P=0.011), but not anemia and thrombocytopenia (Table 3, Table 4, Supplementary Table 1, Supplementary Table 2). rs6790 displayed a decreased risk of anemia with an OR of 0.501 (GA vs GG, P=0.041) (Supplementary Table 2). While no significant association was found between rs17359906 and any hematotoxicities, so we didn’t genotype it in the following validation stage.
Table 3: Multivariate logistic regression analysis of candidate SNPs and their association with concurrent chemoradiotherapy induced grade >2 myelosuppression in NPC patients
Genotypes |
Discovery Stage |
Validation Stage |
Combined Stage |
|||||||||
|---|---|---|---|---|---|---|---|---|---|---|---|---|
Myelosuppression |
ORa (95% CI) |
P a |
Myelosuppression |
ORa (95% CI) |
P a |
Myelosuppression |
ORa (95% CI) |
P a |
||||
Grade ≤2 N (%) |
Grade >2 N (%) |
Grade ≤2 N (%) |
Grade >2 N (%) |
Grade ≤2 N (%) |
Grade >2 N (%) |
|||||||
rs2067079 |
||||||||||||
CC |
115(55.6) |
23(38.3) |
1.00 (reference) |
106 (59.9) |
27 (44.3) |
1.00 (reference) |
221 (57.6) |
50 (41.3) |
1.00 (reference) |
|||
CT |
70(33.8) |
34(56.7) |
2.403 (1.240-4.658) |
0.009 |
60 (33.9) |
26 (42.6) |
1.566 (0.811-3.024) |
0.181 |
130 (33.9) |
60 (49.6) |
1.880 (1.184-2.984) |
0.007 |
TT |
22(10.6) |
3(5.0) |
0.595 (0.142-2.484) |
0.476 |
9 (5.1) |
8 (13.1) |
3.653 (1.162-11.478) |
0.027 |
31 (8.1) |
11 (9.1) |
1.508 (0.663-3.430) |
0.327 |
TT+CT vs CC |
1.988 (1.048-3.772) |
0.035 |
3.258 (1.079-9.843) |
0.036 |
1.813 (1.164-2.824) |
0.009 |
||||||
TT vs CT+CC |
0.385 (0.093-1.592) |
0.187 |
1.807 (0.970-3.367) |
0.062 |
1.169 (0.525-2.602) |
0.702 |
||||||
rs6790 |
||||||||||||
GG |
83 (40.1) |
26 (43.3) |
1.00 (reference) |
50 (28.2) |
32 (52.5) |
1.00 (reference) |
133 (34.6) |
58 (47.9) |
1.00 (reference) |
|||
GA |
101 (48.8) |
30 (50.0) |
0.794 (0.402-1.568) |
0.507 |
92 (52.0) |
21 (34.4) |
0.341 (0.170-0.684) |
0.002 |
193 (50.3) |
51 (42.1) |
0.538 (0.336-0.861) |
0.010 |
AA |
23 (11.1) |
4 (6.7) |
0.636 (0.182-2.229) |
0.480 |
35 (19.8) |
8 (13.1) |
0.360 (0.140-0.923) |
0.033 |
58 (15.1) |
12 (9.9) |
0.454 (0.218-0.946) |
0.035 |
AA+GA vs GG |
0.767 (0.399-1.476) |
0.428 |
0.591 (0.241-1.451) |
0.251 |
0.519 (0.332-0.811) |
0.004 |
||||||
AA vs GA+GG |
0.716 (0.214-2.392) |
0.587 |
0.317 (0.161-0.626) |
0.001 |
0.628 (0.312-1.264) |
0.193 |
||||||
rs17359906 |
||||||||||||
GG |
188 (90.8) |
51 (85.0) |
1.00 (reference) |
-- |
-- |
-- |
-- |
-- |
-- |
|||
GA |
18 (8.7) |
9 (15.0) |
1.784 (0.645-4.936) |
0.265 |
-- |
-- |
-- |
-- |
-- |
-- |
-- |
-- |
AA |
1 (0.5) |
0 (0) |
-- |
-- |
-- |
-- |
-- |
-- |
-- |
-- |
-- |
-- |
AA+GA vs GG |
1.758 (0.637-4.853) |
0.276 |
-- |
-- |
-- |
-- |
||||||
AA vs GA+GG |
-- |
-- |
-- |
-- |
-- |
-- |
||||||
a Adjusted for gender, age, BMI, smoking status, drinking status, histological type, clinical stage, IC regimen, CCRT regimen, and pGTVnx irradiation dose.
P < 0.05 was shown in bold.
Table 4: Multivariate logistic regression analysis of candidate SNPs and their association with concurrent chemoradiotherapy induced grade >2 neutropenia in NPC patients
Genotypes |
Discovery Stage |
Validation Stage |
Combined Stage |
|||||||||
|---|---|---|---|---|---|---|---|---|---|---|---|---|
Neutropenia |
ORa (95% CI) |
P a |
Neutropenia |
ORa (95% CI) |
P a |
Neutropenia |
ORa (95% CI) |
P a |
||||
Grade ≤2 N (%) |
Grade >2 N (%) |
Grade ≤2 N (%) |
Grade >2 N (%) |
Grade ≤2 N (%) |
Grade >2 N (%) |
|||||||
rs2067079 |
||||||||||||
CC |
120 (55.3) |
18 (36.0) |
1.00 (reference) |
115 (59.3) |
18 (40.9) |
1.00 (reference) |
235 (57.2) |
36 (38.3) |
1.00 (reference) |
|||
CT |
75 (34.6) |
29 (58.0) |
2.454 (1.190-5.061) |
0.015 |
66 (34.0) |
20 (45.5) |
1.823 (0.851-3.906) |
0.123 |
141 (34.3) |
49 (52.1) |
2.079 (1.245-3.470) |
0.005 |
TT |
22 (10.1) |
3 (6.0) |
0.730 (0.166-3.210) |
0.677 |
11 (5.7) |
6 (13.6) |
4.767 (1.334-17.036) |
0.016 |
33 (8.0) |
9 (9.6) |
1.665 (0.682-4.065) |
0.263 |
TT+CT vs CC |
2.067 (1.027-4.161) |
0.042 |
3.907 (1.148-13.295) |
0.029 |
2.004 (1.225-3.278) |
0.006 |
||||||
TT vs CT+CC |
0.519 (0.122-2.216) |
0.376 |
2.134 (1.037-4.392) |
0.040 |
1.211 (0.512-2.862) |
0.663 |
||||||
rs6790 |
||||||||||||
GG |
87 (40.1) |
22 (44.0) |
1.00 (reference) |
59 (30.4) |
23 (52.3) |
1.00 (reference) |
146 (35.5) |
45 (47.9) |
1.00 (reference) |
|||
GA |
106 (48.8) |
25 (50.0) |
0.828 (0.396-1.730) |
0.615 |
96 (49.5) |
17 (38.6) |
0.460 (0.214-0.990) |
0.047 |
202 (49.1) |
42 (44.7) |
0.585 (0.348-0.984) |
0.043 |
AA |
24 (11.1) |
3 (6.0) |
0.615 (0.149-2.532) |
0.500 |
39 (20.1) |
4 (9.1) |
0.258 (0.076-0.872) |
0.029 |
63 (15.3) |
7 (7.4) |
0.326 (0.132-0.805) |
0.015 |
AA+GA vs GG |
0.793 (0.389-1.617) |
0.524 |
0.362 (0.113-1.158) |
0.087 |
0.525 (0.319-0.865) |
0.011 |
||||||
AA vs GA+GG |
0.679 (0.174-2.654) |
0.578 |
0.402 (0.195-0.830) |
0.014 |
0.439 (0.186-1.037) |
0.060 |
||||||
rs17359906 |
||||||||||||
GG |
198 (91.2) |
41 (82.0) |
1.00 (reference) |
-- |
-- |
-- |
-- |
-- |
-- |
|||
GA |
18 (8.3) |
9 (18.0) |
2.255 (0.791-6.430) |
0.128 |
-- |
-- |
-- |
-- |
-- |
-- |
-- |
-- |
AA |
1 (0.5) |
0 (0) |
-- |
-- |
-- |
-- |
-- |
-- |
-- |
-- |
-- |
-- |
AA+GA vs GG |
2.119 (0.797-5.636) |
0.132 |
-- |
-- |
-- |
-- |
||||||
AA vs GA+GG |
-- |
-- |
-- |
-- |
-- |
-- |
||||||
a Adjusted for gender, age, BMI, smoking status, drinking status, histological type, clinical stage, IC regimen, CCRT regimen, and pGTVnx irradiation dose.
P < 0.05 was shown in bold.
The promising rs2067079 and rs6790 were further genotyped in 238 additional NPC patients in the validation stage. Our result revealed that only rs2067679 showed consistently significant association with severe myelosuppression (TT vs CC, OR=3.653, P=0.027) and severe neutropenia (TT vs CC, OR=4.767, P=0.016) in the validation stage (Table 3, Table 4). Though rs6790 didn’t show any association with severe myelosuppression and severe neutropenia in the discovery stage, rs6790 demonstrated a decreased risk of severe myelosuppression (GA vs GG, OR=0.341, P=0.002) and severe neutropenia (AA vs GG, OR=0.258, P=0.029) in the validation stage (Table 3, Table 4).
Moreover, combined analysis showed that rs2067079 was still significantly associated with severe myelosuppression (CT vs CC, OR=1.880, P=0.007), severe neutropenia (CT vs CC, OR=2.079, P=0.005), and severe leukopenia (CT vs CC, OR=1.901, P=0.023) (Table 3, Table 4, Supplementary Table 1). Besides, rs6790 displayed a similar trend to the validation stage, which was linked to a decreased risk of severe myelosuppression (GA vs GG, OR=0.538, P=0.010) and severe neutropenia (AA vs GG, OR=0.326, P=0.015) in the combined cohort (Table 3, Table 4). Noteworthy, there exist a gene-does effect of rs6790, with the incidence rate of severe myelosuppression decreased from 23.56% to 17.21% to 10% for rs6790 GG vs GA vs AA genotype carriers. Likely, the incidence rate of severe neutropenia decreased from 30.4% to 20.9% to 17.1% for rs6790 GG vs GA vs AA genotype carriers (Figure 1).
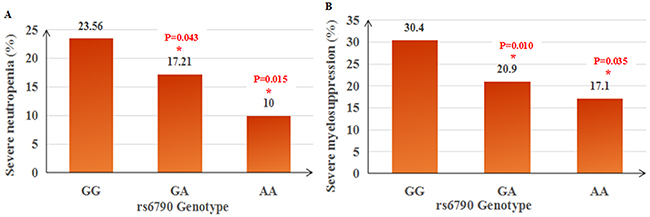
Figure 1: Gene-dose effect of rs6790 on concurrent chemoradiotherapy induced severe neutropenia (A) and severe myelosupression (B) in NPC patients.
To further obtain the predictive power of rs2067079 and rs6790, a risk score model was build to predict each patient’s risk of developing hematotoxicities by logistic regression based on the two SNPs and clinical features. The receiver operating characteristic curve (ROC) was used to compute the sensitivity and specificity of toxicity prediction. The area under the curve (AUC) of the risk score model were 0.686, 0.704, 0.705 for severe myelosuppression, neutropenia, and leukopenia, respectively, indicating a moderate performance (Figure 2).
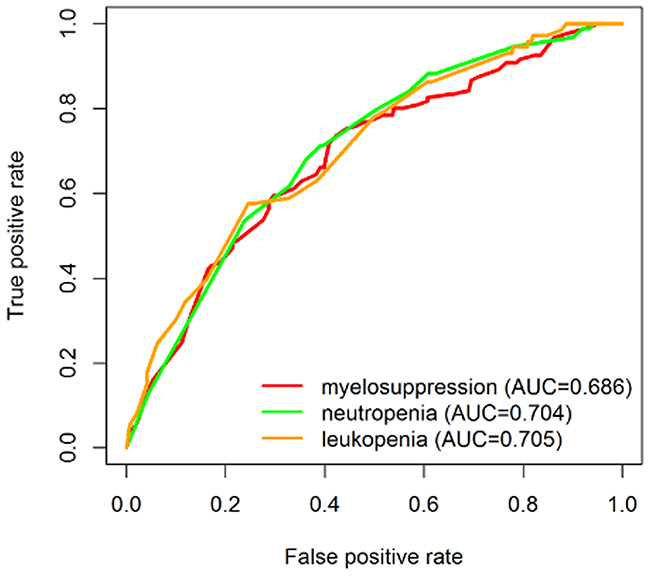
Figure 2: ROC curves showing the discriminatory power to predict chemoradiotherapy induced severe toxicities.
GAS5 SNPs and CCRT induced severe dermatitis and oral mucotisis
As for CCRT induced severe dermatitis and oral mucotisis with NPC patients, we only found a slight relationship in the discovery stage for severe oral mucotisis and rs2067079 (CT vs CC, OR=1.928, P=0.049), as well as rs6790 (GA vs GG, OR=0.511, P=0.049). Neither of the two SNPs were verified in the validation stage, nor in the combined cohort (Supplementary Table 3). Nevertheless, no significant evidence was found for interaction between these candidate SNPs and severe dermatitis in NPC patients receiving CCRT treatment.
Stratification analyses of GAS5 rs2067079, rs6790 and CCRT induced early toxic reactions
Furthermore, we evaluated the stratified association of GAS5 rs2067079 and rs6790 with CCRT induced early toxicities by irradiation dose and chemotherapy regimens, since these factors were disequilibrium in severe and mild toxicity groups. We observed that the rs2067079 CT genotype carriers emerged an even more remarkable increased risk of severe myelosuppression (CT vs CC, OR=3.878, P=0.003) in subgroups of CCRT regimen-TP. Moreover, rs2067079 also presented a dramatic increased effect on severe neutropenia in subgroups of CCRT regimen-TP (CT vs CC, OR=3.794, P=0.009) and subgroups of CCRT regimen-NDP (TT vs CC, OR=5.085, P=0.028). Though rs2067079 may act as a risk factor for severe myelosuppression and neutropenia, it seems that rs2067079 played a favorable role for CCRT induced thrombocytopenia in subgroups taking TP as IC regimen (CT vs CC, OR=0.394, P=0.034) and DDP as CCRT regimen (CT vs CC, OR=0.101, P=0.047). Besides, patients of rs2067079 TT genotype receiving DP for IC regimen (TT vs CC, OR=3.031, P=0.047) or CCRT regimen (TT vs CC, OR=21.882, P=0.043) were subjected to high risk of oral mucotisis (Table 5).
Table 5: Stratified analyses of GAS5 rs2067079, rs6790 and CCRT induced early toxicities among NPC patients by irradiation dose and chemotherapy regimens
Subgroups |
SNP |
Toxic reaction |
Grade ≤2 WW/WM/MM |
Grade >2 WW/WM/MM |
ORa (95% CI) |
P a |
|---|---|---|---|---|---|---|
IC regimen- TP |
rs2067079 |
Myelosuppression |
72/50/13 |
25/34/9 |
2.010 (1.045-3.867) |
0.037 |
Neutropenia |
76/55/15 |
21/29/7 |
2.093 (1.026-4.268) |
0.042 |
||
Thrombocytopenia* |
74/73/21 |
23/11/1 |
0.394 (0.166-0.931) |
0.034 |
||
IC regimen- DP |
rs2067079 |
Oral mucotisis |
80/50/8 |
27/25/8 |
3.031 (1.014-9.055) |
0.047 |
CCRT regimen- TP |
rs2067079 |
Myelosuppression |
34/21/5 |
15/28/5 |
3.878 (1.562-9.626) |
0.003 |
Neutropenia |
36/25/7 |
13/24/3 |
3.794 (1.403-10.260) |
0.009 |
||
CCRT regimen- DP |
rs2067079 |
Oral mucotisis |
24/21/1 |
4/5/2 |
21.882 (1.095-437.387) |
0.043 |
rs6790 |
Myelosuppression |
10/24/7 |
9/5/2 |
0.008 (0.000-0.179) |
0.002 |
|
Neutropenia |
11/25/8 |
8/4/1 |
0.026 (0.002-0.325) |
0.005 |
||
Leukopenia |
14/25/7 |
5/4/2 |
0.113 (0.014-0.898) |
0.039 |
||
CCRT regimen- NDP |
rs2067079 |
Neutropenia |
81/56/14 |
7/9/4 |
5.085 (1.189-21.746) |
0.028 |
rs6790 |
Anemia* |
43/65/12 |
25/21/6 |
0.405 (0.182-0.898) |
0.026 |
|
CCRT regimen- DDP |
rs2067079 |
Thrombocytopenia* |
37/23/7 |
12/2/1 |
0.101 (0.011-0.966) |
0.047 |
CCRT regimen- FP |
rs6790 |
Dermatitis |
24/32/17 |
7/2/3 |
0.026 (0.001-0.464) |
0.013 |
pGTVnx < 71.00Gy |
rs2067079 |
Myelosuppression |
115/76/18 |
20/25/6 |
2.059 (1.020-4.158) |
0.044 |
Neutropenia |
123/81/20 |
12/20/4 |
2.859 (1.254-6.517) |
0.012 |
||
Leukopenia |
123/83/20 |
12/18/4 |
2.533 (1.078-5.951) |
0.033 |
||
rs6790 |
Myelosuppression |
75/107/28 |
26/21/4 |
0.486 (0.241-0.980) |
0.044 |
|
Neutropenia |
82/113/30 |
19/15/2 |
0.439 (0.198-0.973) |
0.043 |
||
Anemia* |
63/89/15 |
38/39/17 |
0.493 (0.261-0.933) |
0.030 |
||
pGTVnx ≥71.00Gy |
rs2067079 |
Myelosuppression |
106/54/13 |
30/35/5 |
2.387 (1.235-4.614) |
0.010 |
Neutropenia |
112/60/13 |
24/29/5 |
2.273 (1.128-4.580) |
0.022 |
*NOTE: the two groups for anemia and thrombocytopenia was assigned as grade=0 and grade >0 as the number of patients developing grade >2 anemia and thrombocytopenia were too little.
WW: wild homozygote; WM: heterozygote; MM: mutant homozygote.
a adjusted for the remaining clinical covariates except for the stratified factor.
P < 0.05 was shown in bold.
Notably, rs6790 displayed a prominently decreased risk for severe myelosuppression (GA vs GG, OR=0.008, P=0.002), severe neutropenia (GA vs GG, OR=0.026, P=0.005), and severe leukopenia (GA vs GG, OR=0.113, P=0.039) in subgroups taking DP as the CCRT regimen. We also observed that the risk of anemia decreased to 0.405 and 0.493 in subgroups of CCRT regimen-NDP (GA vs GG, P=0.026) and pGTVnx < 71.00Gy (GA vs GG, P=0.030), respectively. Besides, rs6790 GA genotype carriers were not likely to experience severe dermatitis in subgroups receiving FP for CCRT regimen (GA vs GG, OR=0.026, P=0.013) (Table 5).
GAS5 SNPs and chemoradiotherapy efficacy
414 patients with 3 months MRI follow-up information were involved in the treatment efficacy analysis. The effective remission (PR+CR) rate was 93.96% for nasopharyngeal primary tumor and 85.02% for neck lymph nodes. Multivariate logistic regression results showed that none of the three SNPs were associated with either primary tumor treatment efficacy or neck lymph nodes treatment efficacy.
DISCUSSION
Platinum-based chemotherapy concurrent with radiotherapy is widely used for the treatment of NPC, however, the therapeutic response and toxicity varies remarkably among individuals. Evidence of genetic polymorphisms underlying interindividual differences in chemoradiotherapy responses is rapidly increasing. For example, XRCC1 rs25487 (A>G) was associated with increased risk of acute dermatitis and mucositis as well as poor progression free survival in NPC patients after curative chemoradiotherapy [22, 23]. However, others indicated rs25487 (A>G) was linked with decreased risk of severe fibrosis in NPC patients [24]. Results from Arab showed MDM2 rs2279744 (T>G) appeared to have protective effect for late severe fibrosis and survival time among NPC patients [24]. Nevertheless, Liu et al. reported rs2279744 (T>G) as a risk factor for progression-free survival among southern Chinese NPC patients [25]. As far as we can see, most of the studies focused on protein coding genes lies in DNA damage repair pathway and the results were inconsistent in regard to different ethnicity, heterogeneous clinical confounding factors, limited sample size and so on. To the best of our knowledge, most of this research field is still blank, and the importance of lncRNA polymorphisms and chemoradiotherapy responses in NPC patients in Chinese remains unknown.
LncRNA GAS5 is a rising star among tumor-suppressive lncRNAs. It is well known that effective control of both cell survival and cell proliferation is critical to successful cancer therapy. GAS5 that accumulates in growth-arrested cells may alter cell fate by making the cells more or less susceptible to apoptotic and other growth-related stimuli through modulation of steroid hormone activities [18]. In vitro and in vivo results have shown that cell apoptosis induced by UV irradiation and chemotherapeutic drugs was augmented in cells over expression GAS5, and attenuated following down-regulation of GAS5 expression [9, 11, 26, 27]. The apoptosis extent and the cell viability were quantitatively associated with the extent of GAS5 level. In addition, GAS5 expression was significantly downregulated in trastuzumab-resistant breast cancer patients, gefitinib-resistant lung adenocarcinoma cell lines and erlotinib-resistant glioma cell line, which was of great clinical significance for targeted therapy [28-30]. Emerging evidence have suggested GAS5 as an indicator of overall survival in hepatocellular carcinoma, cervical cancer, gastric cancer, breast cancer, and colorectal cancer [15, 16, 21, 29, 31]. However, far less is known about the role of GAS5 polymorphisms and chemoradiotherapy response in NPC patients.
In particular, we assessed correlations between three SNPs of GAS5 and CCRT response and toxic reactions in 267 NPC patients, validating the findings in an additional 238 NPC patients from southern China. We found for the first time that GAS5 rs2067079 (C>T) exhibited a consistent association with CCRT induced severe myelosuppression and severe neutropenia in the discovery set (OR=2.403, P=0.009; OR=2.454, P=0.015; respectively), the validation set (OR=3.653, P=0.027; OR=4.767, P=0.016; respectively), and the combined dataset (OR=1.880, P=0.007; OR=2.079, P=0.005; respectively). Besides, we found an evidence of gene-dose effect for rs6790 on severe myelosuppression (GG vs GA vs AA: 23.56% vs 17.21% vs 10%) and severe neutropenia (GG vs GA vs AA: 30.4% vs 20.9% vs 17.1%), with the risk of toxic reactions decreased gradually along with the favorable allele increased. The statistical power for rs2067079 and rs6790 was 1.000 in the combined dataset.
Never had any study has reported about GAS5 rs2067079 and rs6790, so we tried to infer the potential function of rs2067079 and rs6790 from some bioinformatics databases. The UCSC genome browser labeled the position of rs2067079 and rs6790 as an active promoter or strong enhancer region according to computationally integrating ChIP-seq data from nine human cell types. Since expression levels could be regulated by genetic variants in regulatory elements, we speculated that the two SNPs might influence GAS5 transcriptional activity. In silico analysis revealed that rs2067079 and rs6790 both have a strong feature of expression Quantitative Trait Locus (e-QTL) in many tissues, indicating the two SNPs might exert their role through impacting the expression of target genes (Supplementary Table 4). Moreover, rs2067079 (C>T) had an obvious effect on GAS5 secondary structure with the minimum free energy (MFE) increased from -111.50 kcal/mol to -109.10 kcal/mol (Figure 3). Considering that the spatial structure was critical for the performance of lncRNA function, we speculated rs2067079 might impact GAS5 transcript stability, thus has a further implication. Both of TargetScan and miRanda predicted that rs2067079 caused three miRNA binding site gain (miR-4727-5p, miR-4769-3p, and miR-6817-5p) and one miRNA binding site loss (miR-6084) for GAS5 (Supplementary Table 5), which inspired us to wonder if there existed a lncRNA-miRNA sponge role of GAS5. Yet, rs6790 didn’t have any effect on the interaction of miRNA and GAS5, indicating there might have other mechanisms for rs6790.
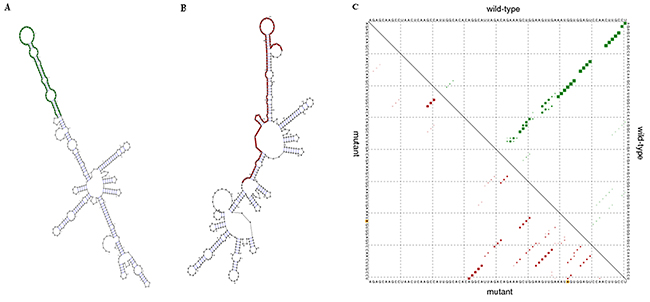
Figure 3: The predicted effect of rs2067079 on GAS5 secondary structure. (A) Minimum free energy structures of the wild-type GAS5. (B) Minimum free energy structures of the mutant-type GAS5. (C) Dot plot of the GAS5 rs2067079 global structure. The upper and lower triangle of the matrix represents the base pair probabilities of wild-type and mutant sequences, respectively. The asymmetry of the two triangle matrix indicates the difference in their structure change.
Though we found some positive associations in the present study, a number of critical points needed to be addressed in order to successfully unravel the genetics of chemoradiotherapy response in the future studies. It is noteworthy that the results of this study require to be validated in another population, since all involved patients were from the same hospital in Hunan province. A multicenter national study will further confirm the clinical value of these predictive biomarkers [32]. Given the fact that chemoradiotherapy response are complex phenotype and affected by multiple factors, it is very difficult to accurately predict their occurrence using a few SNPs. Microarray may help to map the tanglesome traits of the allelic architecture presumably underlying the complex phenotypes. Besides, establishment of risk model including genetic factors and clinical covariants capable of predicting individual likelihood of experiencing treatment resistance or developing side effects after chemoradiotherapy is of clinical significance, which may support the patient and the physician in selecting the best therapeutic approach and avoid unnecessary worsening of quality of life [33, 34].
In conclusion, in this two stage discovery-validation study, we highlighted two potential functional locus, GAS5 rs2067079 and rs6790 for chemoradiotherapy induced severe myelosuppression and severe neutropenia among NPC patients for the first time. Our result provides valuable information for personalized chemoradiotherapy though there is still a long way to go.
MATERIALS AND METHODS
Study subjects recruitment
This study used a two stage discovery-validation approach. A total of 505 newly diagnosed histologically confirmed NPC patients were recruited in Hunan Provincial Cancer Hospital between October 2014 and July 2016. Among the whole patient cohort, 267 patients were assigned to discovery set (October 2014-September 2015), and 238 patients were assigned to validation set (October 2015-July 2016) according to their recruitment date. Patients were enrolled in this study according to the following inclusion criteria: (1) histological confirmed WHO type II or III NPC; (2) Han Chinese ethnicity; (3) received intensity-modulated radiotherapy (IMRT) technique; (4) treated with induction chemotherapy (IC) plus concurrent chemoradiotherapy (CCRT) regimen; (5) had complete follow-ups and clinical information; (6) had an Eastern Cooperative Oncology Group (ECOG) performance status of 0 or 1. The exclusion criteria including: (1) the presence of distant metastasis or recurrence; (2) underwent radiotherapy or chemotherapy or surgery before; (3) had a second malignancy or other concomitant malignant diseases.
This study was performed with the approval of the Independent Ethical Committee of Institute of Clinical Pharmacology, Central South University (CTXY-140007-2). At recruitment, written informed consent was obtained from all participants involved in this study.
Treatment regimen
All the eligible patients received definitive radiotherapy and treated with platinum-based CCRT with IC regimen. The primary tumor and neck lymph nodes were treated with megavoltage photons (6 MV). Radiation was administered five times per week at a dose of 2.27 Gy/day. The accumulated radiation dose was 68-72 Gy to the primary tumor, 60-62 Gy to involved areas of the neck, and 50 Gy to uninvolved areas. There were six chemotherapy regimens involved in this study: platinum plus 5-fluorouracil (FP); platinum plus paclitaxel (TP); platinum plus docetaxel (DP); platinum plus gemcitabine (GP); cisplatin alone (DDP); nedaplatin alone (NDP). The selection of different regimens in individual patients was according to the patient’s clinical status, including performance status, symptoms, tumor burden, ongoing clinical trial and so on.
Evaluation
We reviewed patients’ medical records during the follow-up period to collect demographic data and clinical information. The tumor, node, metastasis classification and tumor staging were evaluated according to the 2002 American Joint Committee on Cancer (AJCC) staging system. The toxic reactions were evaluated weekly during the CCRT treatment period by the Common Terminology Criteria for Adverse Events (CTCAE 3.0) for every patient. Grade 3-4 toxic reactions were considered as severe toxicity and Grade 1-2 were thought as mild toxicity. The response to chemoradiotherapy was evaluated using the Response Evaluation Criteria in Solid Tumor (RECIST) guidelines according to the magnetic resonance imaging (MRI) three months after treatment. A complete response (CR) and a partial response (PR) were considered as treatment sensitivity, whereas stable disease (SD) and progressive disease (PD) were identified as treatment resistance. The endpoints of this study were treatment efficacy, dermatitis, oral mucositis, myelosuppression, neutropenia, leukopenia, anemia, and thrombocytopenia.
SNPs selection
Unlike the traditional tag SNP selection procedure, we used a bioinformatic approach to select SNPs with regulatory feature (5’-untranslated regions [5’- UTR] variant, 3’-untranslated regions [3’- UTR] variant, enhancer variant, splice region variant, miRNA binding site variant) by some online database, including ENCODE (http://genome.ucsc.edu/ENCODE/), ENSEMBL (http://asia.ensembl.org/index.html?redirect=no) and lncRNASNP (http://bioinfo.life.hust.edu.cn/lncRNASNP/). SNPs with a minor allele frequency (MAF) >5% in the Chinese population based on the 1000 Genomes CHS database were included for further study. Overall, 3 SNPs of GAS5 (rs2067079, rs6790, rs17359906) were finally identified, as shown in Table 2.
DNA Extraction and genotyping
3 ml of venous blood was collected from each eligible participant at the time of enrollment and stored at -80°C. Genomic DNA was extracted from lymphocytes using the QIAamp DNA Blood Mini Kit (Qiagen, Valencia, CA) according to the manufacturer’s instructions. DNA purity and concentrations were determined by spectrophotometric measurement of absorbance at 260 and 280 nm by UV spectrophotometer. The candidate SNPs were genotyped using the Sequenom MassARRAY iPLEX platform (Sequenom, Inc., San Diego, CA, USA). A call-rate threshold of ≥95% was the criteria used to identify analyzable SNPs.
Statistical analysis
The differences of demographic variables between two groups were evaluated by the Student’s t-test for continuous variables and the χ2 test for categorical variables. The Hardy-Weinberg equilibrium (HWE) was used to compare the observed genotype frequencies with the expected ones in discovery/validation/combined cohort. The associations between candidate SNPs and chemoradiotherapy efficacy and toxicities were estimated by calculating the adjusted odds ratios (OR) and their 95% confidence interval (CI) from multivariate logistic regression analyses, followed by stratification analysis. All tests were two-sided, and a P value <0.05 was considered the cutoff for statistical significance. The statistical analyses were performed with Statistical Package for Social Sciences software package (version 19.0 for Windows; Chicago, IL, USA) and R package.
Abbreviations
nasopharyngeal carcinoma: NPC; single nucleotide polymorphisms: SNPs; Long non-coding RNA: lncRNA; growth arrest-specific5: GAS5; small nucleolar RNA: snoRNA; intensity-modulated radiotherapy: IMRT; induction chemotherapy: IC; concurrent chemoradiotherapy: CCRT; Eastern Cooperative Oncology Group: ECOG; platinum plus 5-fluorouracil: FP; platinum plus paclitaxel: TP; platinum plus docetaxel: DP; platinum plus gemcitabine: GP; cisplatin: DDP; nedaplatin: NDP; American Joint Committee on Cancer: AJCC; Common Terminology Criteria for Adverse Events: CTCAE; Response Evaluation Criteria in Solid Tumor: RECIST; magnetic resonance imaging: MRI; complete response: CR; partial response: PR; stable disease: SD; progressive disease: PD; minor allele frequency: MAF; Hardy-Weinberg equilibrium: HWE; odds ratio: OR; confidence interval: CI; receiver operating characteristic curve: ROC; area under the curve: AUC; expression Quantitative Trait Locus: e-QTL; minimum free energy: MFE
ACKNOWLEDGMENT AND FUNDING
This work was supported by the National Key Research and Development Program (No.2016YFC0905000), National Natural Science Foundation of China (No.81522048, No.81573511 and No.81472802); National High Technology Research and Development Program of China, “863” Project (No. 2012AA02A518), and Innovation Driven Project of Central South University (No.2016CX024).
CONFLICTS OF INTEREST
We declared no conflicts of interests exist in this study.
REFERENCES
1. Tang LL, Chen WQ, Xue WQ, He YQ, Zheng RS, Zeng YX, Jia WH. Global trends in incidence and mortality of nasopharyngeal carcinoma. Cancer Lett. 2016;374:22-30.
2. Lee AW, Tung SY, Chua DT, Ngan RK, Chappell R, Tung R, Siu L, Ng WT, Sze WK, Au GK, Law SC, O’Sullivan B, Yau TK, et al. Randomized trial of radiotherapy plus concurrent-adjuvant chemotherapy vs radiotherapy alone for regionally advanced nasopharyngeal carcinoma. J Natl Cancer Inst. 2010;102:1188-98.
3. Ghazali N, Shaw RJ, Rogers SN, Risk JM. Genomic determinants of normal tissue toxicity after radiotherapy for head and neck malignancy: a systematic review. Oral Oncol. 2012;48:1090-100.
4. Guo Z, Shu Y, Zhou H, Zhang W, Wang H. Radiogenomics helps to achieve personalized therapy by evaluating patient responses to radiation treatment. Carcinogenesis. 2015;36:307-17.
5. Prensner JR, Chinnaiyan AM. The emergence of lncRNAs in cancer biology. Cancer Discov. 2011;1:391-407.
6. Guo Z, Shu Y, Zhou H, Zhang W. Identification of diagnostic and prognostic biomarkers for cancer: Focusing on genetic variations in microRNA regulatory pathways. Mol Med Rep. 2016;13:1943-52.
7. Smith CM, Steitz JA. Classification of gas5 as a multi-small-nucleolar-RNA (snoRNA) host gene and a member of the 5’-terminal oligopyrimidine gene family reveals common features of snoRNA host genes. Mol Cell Biol. 1998;18:6897-909.
8. Mourtada-Maarabouni M, Pickard MR, Hedge VL, Farzaneh F, Williams GT. GAS5, a non-protein-coding RNA, controls apoptosis and is downregulated in breast cancer. Oncogene. 2009;28:195-208.
9. Pickard MR, Mourtada-Maarabouni M, Williams GT. Long non-coding RNA GAS5 regulates apoptosis in prostate cancer cell lines. Biochim Biophys Acta. 2013;1832:1613-23.
10. Lu X, Fang Y, Wang Z, Xie J, Zhan Q, Deng X, Chen H, Jin J, Peng C, Li H, Shen B. Downregulation of gas5 increases pancreatic cancer cell proliferation by regulating CDK6. Cell Tissue Res. 2013;354:891-6.
11. Zhang H, Guo Y, Song Y, Shang C. Long noncoding RNA GAS5 inhibits malignant proliferation and chemotherapy resistance to doxorubicin in bladder transitional cell carcinoma. Cancer Chemother Pharmacol. 2017;79:49-55.
12. Shi X, Sun M, Liu H, Yao Y, Kong R, Chen F, Song Y. A critical role for the long non-coding RNA GAS5 in proliferation and apoptosis in non-small-cell lung cancer. Mol Carcinog. 2015;54:E1-E12.
13. Liu Y, Zhao J, Zhang W, Gan J, Hu C, Huang G, Zhang Y. lncRNA GAS5 enhances G1 cell cycle arrest via binding to YBX1 to regulate p21 expression in stomach cancer. Sci Rep. 2015;5:10159.
14. Zhao X, Wang P, Liu J, Zheng J, Liu Y, Chen J, Xue Y. Gas5 exerts tumor-suppressive functions in human glioma cells by targeting miR-222. Mol Ther. 2015;23:1899-911.
15. Tu ZQ, Li RJ, Mei JZ, Li XH. Down-regulation of long non-coding RNA GAS5 is associated with the prognosis of hepatocellular carcinoma. Int J Clin Exp Pathol. 2014;7:4303-9.
16. Cao S, Liu W, Li F, Zhao W, Qin C. Decreased expression of lncRNA GAS5 predicts a poor prognosis in cervical cancer. Int J Clin Exp Pathol. 2014;7:6776-83.
17. Renganathan A, Kresoja-Rakic J, Echeverry N, Ziltener G, Vrugt B, Opitz I, Stahel RA, Felley-Bosco E. GAS5 long non-coding RNA in malignant pleural mesothelioma. Mol Cancer. 2014;13:119.
18. Kino T, Hurt DE, Ichijo T, Nader N, Chrousos GP. Noncoding RNA gas5 is a growth arrest- and starvation-associated repressor of the glucocorticoid receptor. Sci Signal. 2010;3:ra8.
19. Kong H, Wu Y, Zhu M, Zhai C, Qian J, Gao X, Wang S, Hou Y, Lu S, Zhu H. Long non-coding RNAs: novel prognostic biomarkers for liver metastases in patients with early stage colorectal cancer. Oncotarget. 2016;7:50428-36. https://doi.org/10.18632/oncotarget.10416.
20. Zheng Y, Song D, Xiao K, Yang C, Ding Y, Deng W, Tong S. LncRNA GAS5 contributes to lymphatic metastasis in colorectal cancer. Oncotarget. 2016;7:83727-34. https://doi.org/10.18632/oncotarget.13384.
21. Sun M, Jin FY, Xia R, Kong R, Li JH, Xu TP, Liu YW, Zhang EB, Liu XH, De W. Decreased expression of long noncoding RNA GAS5 indicates a poor prognosis and promotes cell proliferation in gastric cancer. BMC Cancer. 2014;14:319.
22. Li H, You Y, Lin C, Zheng M, Hong C, Chen J, Li D, Au WW, Chen Z. XRCC1 codon 399Gln polymorphism is associated with radiotherapy-induced acute dermatitis and mucositis in nasopharyngeal carcinoma patients. Radiat Oncol. 2013;8:31.
23. Jin H, Xie X, Wang H, Hu J, Liu F, Liu Z, Zhou J, Zhang Y, Xi X, Hu B, Liao Y, Tang J. ERCC1 Cys8092Ala and XRCC1 Arg399Gln polymorphisms predict progression-free survival after curative radiotherapy for nasopharyngeal carcinoma. PLoS One. 2014;9:e101256.
24. Alsbeih G, El-Sebaie M, Al-Harbi N, Al-Hadyan K, Shoukri M, Al-Rajhi N. SNPs in genes implicated in radiation response are associated with radiotoxicity and evoke roles as predictive and prognostic biomarkers. Radiat Oncol. 2013;8:125.
25. Liu H, Qi B, Guo X, Tang LQ, Chen QY, Zhang L, Guo L, Luo DH, Huang PY, Mo HY, Xiang YQ, Qiu F, Sun R, et al. Genetic variations in radiation and chemotherapy drug action pathways and survival in locoregionally advanced nasopharyngeal carcinoma treated with chemoradiotherapy. PLoS One. 2013;8:e82750.
26. Pickard MR, Williams GT. Regulation of apoptosis by long non-coding RNA GAS5 in breast cancer cells: implications for chemotherapy. Breast Cancer Res Treat. 2014;145:359-70.
27. Pickard MR, Williams GT. The hormone response element mimic sequence of GAS5 lncRNA is sufficient to induce apoptosis in breast cancer cells. Oncotarget. 2016;7:10104-16. https://doi.org/10.18632/oncotarget.7173.
28. García-Claver A, Lorente M, Mur P, Campos-Martín Y, Mollejo M, Velasco G, Meléndez B. Gene expression changes associated with erlotinib response in glioma cell lines. Eur J Cancer. 2013;49:1641-53.
29. Li W, Zhai L, Wang H, Liu C, Zhang J, Chen W, Wei Q. Downregulation of LncRNA GAS5 causes trastuzumab resistance in breast cancer. Oncotarget. 2016;7:27778-86. https://doi.org/10.18632/oncotarget.8413.
30. Dong S, Qu X, Li W, Zhong X, Li P, Yang S, Chen X, Shao M, Zhang L. The long non-coding RNA, GAS5, enhances gefitinib-induced cell death in innate EGFR tyrosine kinase inhibitor-resistant lung adenocarcinoma cells with wide-type EGFR via downregulation of the IGF-1R expression. J Hematol Oncol. 2015;8:43.
31. Yin D, He X, Zhang E, Kong R, De W, Zhang Z. Long noncoding RNA GAS5 affects cell proliferation and predicts a poor prognosis in patients with colorectal cancer. Med Oncol. 2014;31:253.
32. Chanock SJ, Manolio T, Boehnke M, Boerwinkle E, Hunter DJ, Thomas G, Hirschhorn JN, Abecasis G, Altshuler D, Bailey-Wilson JE, Brooks LD, Cardon LR, Daly M, et al. Replicating genotype-phenotype associations. Nature. 2007;447:655-60.
33. De Langhe S, De Meerleer G, De Ruyck K, Ost P, Fonteyne V, De Neve W, Thierens H. Integrated models for the prediction of late genitourinary complaints after high-dose intensity modulated radiotherapy for prostate cancer: making informed decisions. Radiother Oncol. 2014;112:95-9.
34. De Ruyck K, Duprez F, Werbrouck J, Sabbe N, Sofie de L, Boterberg T, Madani I, Thas O, Wilfried de N, Thierens H. A predictive model for dysphagia following IMRT for head and neck cancer: introduction of the EMLasso technique. Radiother Oncol. 2013;107:295-9.