
INTRODUCTION
With the remarkable improvement of social living standard, coronary artery disease (CAD) and ischemic stroke, as the major reason, contribute to increasing morbidity, mortality and disability in developing countries. Maybe the rates would be keeping on increasing [1]. Recently, lots of epidemiological researches have demonstrated an inverse effect between serum high-density lipoprotein cholesterol (HDL-C) levels and CAD morbidity and mortality [2–4]. In addition, each 1% decrease in low-density lipoprotein cholesterol (LDL-C) levels can give rise to 1% decrease the risk of CAD [5], but each 2% increase the risk of CAD can result from each 1% HDL-C levels decrease [6]. Previous researches about cardiovascular disease risk factors which have well-known for us that they would be raised by different gender [7], also be distinguish from age [8] and ethnicity [9], and would be modified by behavioral choices [10], poor diet [11] and exercise lifestyle [12], environmental factors [13], and personal genetic profile [14, 15]. As regards this point, genetic factors can determine approximate 50% of the variation in HDL-C levels according to family and twin researches [16, 17].
Recent GWASes have found several novel loci located at chromosome 12q24, which covers the mevalonate kinase gene (MVK, also known as: MK; LRBP; MVLK; POROK3, Gene ID: 4598, HGNC ID: 7530), methylmalonic aciduria (cobalamin deficiency) cblB type gene (MMAB, also known as: ATR; cob; cblB; CFAP23, Gene ID: 362265, HGNC ID: 19331), all of which can affect HDL-C levels [18, 19]. Because of having effect on lipid levels, this important region has also been revealed by other linkage researches [20–22]. Particularly, MVK and MMAB, as two adjacent genes, take part in metabolic pathways, would also be influenced HDL-C metabolism [23]. A previous GWAS on plasma lipid levels has identified the rs877710 SNP near the MMAB as hyperlipidemia loci in Mexicans and have demonstrated in might be ethnic-specificity [24]. A study in 2011 has shown that the association between the MMAB rs7134594 SNP and MVK rs3759387 SNP and serum lipid levels might have sex-specificity [25]. Sun et al had taken several SNPs into consideration that including MVK (rs3759387, rs2287218) and MMAB (rs12817689, rs22411201, rs11067227, rs7134594, rs877710, rs11067233, rs9593, rs11831226, rs8228), but only found that rs11067233 in MMAB may contribute to the susceptibility of CAD by altering plasma HDL-C levels in Han Chinese [26]. Junyent et al suggested that MMAB-3U3527G/C variants might result in the variation in HDL-C levels, particularly in those individuals with high carbohydrate consumptions [27]. Fogarty et al had found that MMAB rs9593 might be have some effect on serum HDL-C, but they were not sure of that [28]. Whether the MVK/MMAB SNPs are associated with serum lipid levels or whether it shows ethnic- and/or sex-specific association, as the previously reported or not, it remains to explore.
As a multi-ethnic country, China contains 56 ethnic groups. Among all of these ethnic groups, Han is the largest one, and Maonan is one of the 55 minorities with a population of 107,166 (Rank 37) according to the sixth national census statistics of China in 2010. Several previous studies have showed that the genetic relationship between Maonan ethnic group and other ethnic groups in Guangxi [29] was much closer than that between Maonan and Han ethnic groups [30]. The special customs and culture, including their clothing, intra-ethnic marriages, dietary habits and lifestyle factors are different from those of local Han Chinese [31]. The previous studies had shown that sexual dimorphism has been demonstrated as the potential of dyslipidemia. The current study, therefore, was undertaken to find out the association of MVK rs3759387 and MMAB rs7134594, rs877710, rs9593 SNPs and several environmental factors with serum lipid concentrations between sex differences in the Maonan and Han populations.
RESULTS
General characteristics of the subjects
The general characteristics of the subjects between two ethnic groups are shown in Table 1. The values of body weight, body mass index (BMI), waist circumference and the percentages of individuals who alcohol consumed, systolic blood pressure, diastolic blood pressure, pulse pressure and blood glucose level were higher in Maonan than in Han (P < 0.05-0.001), whereas the values of body height, smoked cigarettes percent, HDL-C and apolipoprotein (Apo) A1 levels were lower in Maonan than in Han (P < 0.05). There was no significant difference in the levels of age, sex ratio, total cholesterol (TC), triglyceride (TG), LDL-C, ApoB, and the ratio of ApoA1 to ApoB (P > 0.05 for all).
Table 1: Comparison of demographic, lifestyle characteristics and serum lipid levels between the Han and Maonan populations
Parameter |
Han |
Maonan |
Test-statistic |
P |
|---|---|---|---|---|
Number |
1251 |
1264 |
||
Male/female |
476/775 |
517/747 |
2.024 |
0.155 |
Age (years)1 |
55.88±13.89 |
56.97±15.12 |
1.682 |
0.195 |
Height (cm) |
153.93±7.48 |
153.81±8.17 |
8.175 |
0.004 |
Weight (kg) |
52.69±8.69 |
53.43±10.75 |
41.013 |
1.6×10⁻⁹ |
Body mass index (kg/m2) |
22.23±3.26 |
22.42±3.70 |
5.014 |
0.025 |
Waist circumference |
74.91±7.78 |
76.74±9.07 |
23.110 |
2.2×10⁻⁹ |
Smoking status [n (%)] |
||||
Non-smoker |
936(74.80) |
990(78.32) |
||
≤ 20 cigarettes/day |
275(22.10) |
244(19.30) |
||
> 20 cigarettes/day |
40(3.10) |
30(2.38) |
4.727 |
0.094 |
Alcohol consumption [n (%)] |
||||
Non-drinker |
1008(80.58) |
997(78.88) |
||
≤ 25 g/day |
106(8.47) |
152(12.03) |
||
> 25 g/day |
137 (10.95) |
115(9.10) |
10.1162 |
0.006 |
Systolic blood pressure (mmHg) |
128.44±19.72 |
136.12±23.28 |
29.984 |
8×10⁻⁷ |
Diastolic blood pressure (mmHg) |
80.65±10.83 |
83.32±11.88 |
9.067 |
0.003 |
Pulse pressure (mmHg) |
47.78±14.72 |
52.80±17.41 |
29.277 |
7×10⁻⁷ |
Glucose (mmol/L) |
6.16±1.78 |
6.20±1.42 |
24.878 |
5.5×10⁻⁷ |
Total cholesterol (mmol/L) |
4.95±1.06 |
5.00±1.25 |
0.392 |
0.532 |
Triglyceride (mmol/L)2 |
1.39(0.69) |
1.43(0.71) |
0.037 |
0.854 |
HDL-C (mmol/L) |
1.97±0.85 |
1.67±1.25 |
6.828 |
0.021 |
LDL-C (mmol/L) |
2.87±0.84 |
2.88±0.79 |
1.606 |
0.205 |
ApoA1 (g/L) |
1.40±0.33 |
1.34±0.40 |
4.883 |
0.043 |
ApoB (g/L) |
0.84±0.20 |
0.88±0.20 |
2.898 |
0.089 |
ApoA1/ApoB |
1.75±0.58 |
1.60±0.64 |
1.632 |
0.202 |
HDL-C, high-density lipoprotein cholesterol; LDL-C, low-density lipoprotein cholesterol; Apo, apolipoprotein. The value of triglyceride was presented as median (interquartile range) for not a normal distribution, the difference between the two ethnic groups was determined by the Wilcoxon-Mann-Whitney test.
1 Mean ± SD determined by t-test.
2 Median (interquartile range) tested by the Wilcoxon-Mann-Whitney test.
Genotypic and allelic frequencies
Figure 1 describes the allelic and genotypic frequencies of the selected SNPs. The frequencies of genotype were performed as AA (3.04% vs. 1.98%), AC (29.02% vs. 26.13%) and CC (67.95% vs. 71.89%) in rs3759387 when compared with Han and Maonan minority. The same situations in rs877710 were CC (45.96% vs. 33.01%), CG (46.92% vs. 49.09%) and GG (7.11% vs. 17.89%), rs7134594 were CC (44.52% vs. 44.65%), CT (48.60% vs. 44.02%) and TT (6.87% vs. 11.32%), rs9593 were AA (7.11% vs. 11.16%), AT (43.96% vs. 44.18%) and TT (48.92% vs. 44.66%), respectively. The frequencies of allele were performed as A (17.55% vs. 15.04%) and C (82.45% vs. 84.96%) in rs3759387 when compared with Han and Maonan minority. The same situations in rs877710 were C (69.42% vs. 61.16%) and G (30.58% vs. 38.84%), rs7134594 were C (68.82% vs. 73.79%) and T (31.18% vs. 26.21%), rs9593 were A (70.90% vs. 66.75%) and T (29.10% vs. 33.25%), respectively. There were distinguished Han from Maonan ethnic group (P < 0.05 for all). Besides, four of the selected SNPs were complied with the Hardy-Weinberg equilibrium (P > 0.05).
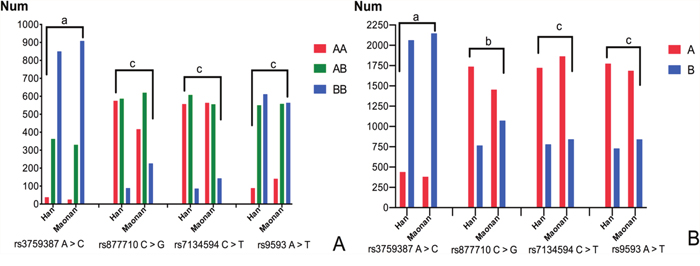
Figure 1: Frequencies of the genotype (A) and allele (B) in the Han and Maonan populations. (A) AA, rs3759387AA, rs877710CC, rs7134594CC, and rs9593AA genotypes; AB, rs3759387AC, rs877710CG, rs7134594CT, and rs9593AT genotypes; BB, rs3759387CC, rs877710GG, rs7134594TT, and rs9593TT genotypes. (B) A, rs3759387A, rs877710C, rs7134594C, and rs9593A alleles; B, rs3759387C, rs877710G, rs7134594T, and rs9593T alleles; aP < 0.05; bP < 0.01; cP < 0.001; PHWE > 0.05 for all.
Genotypes and plasm lipid concentrations
Figure 2 shows the association between genotypes and plasm lipid concentrations. When we analyzed the dominant model associated with serum lipid parameters we can find that the minor allele carriers had higher HDL-C concentrations than the minor allele non-carriers in Han and/or Maonan ethic groups (P < 0.0125 for each). Also, we had found that the minor allele carriers had higher ApoA1 concentrations than the minor allele non-carriers in the combined population of Han and Maonan (rs877710) or only in Han ethic group (rs7134594) (P < 0.0125 for each).
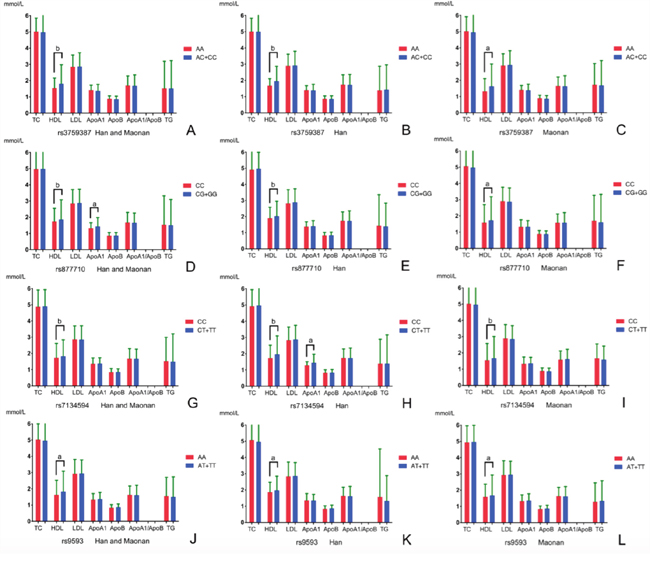
Figure 2: Comparison of the genotypes and serum lipid levels between the Han and Maonan populations. TC, total cholesterol; TG, triglyceride; HDL-C, high-density lipoprotein cholesterol; LDL-C, low-density lipoprotein cholesterol; ApoA1, apolipoprotein A1; ApoB, apolipoprotein B; ApoA1/ApoB, the ratio of apolipoprotein A1 to apolipoprotein B. The value of triglyceride was presented as median (interquartile range), the difference among the genotypes was determined by the Kruskal-Wallis test. P < 0.0125 (corresponding to P < 0.05 after adjusting for 4 independent tests by the Bonferroni correction) was considered statistically significant. The minor allele carriers had higher serum HDL-C and/or ApoA1 levels than the minor allele non-carriers. aP < 0.0125; bP < 0.001.
Haplotypes and serum lipid levels
To detect the integrated effect of four SNPs (the combined sequence was rs3759387, rs877710, rs7134594 and rs9593) in the cluster, a linkage disequilibrium (LD) was noted between four SNPs (Supplementary Figure 1). Five haplotypes were identified in the cluster in both populations, and the rare haplotypes (frequency < 3%) have been dropped. The haplotype of rs3759387C-rs877710C-rs7134594C-rs9593T was the commonest one (57.23%). All of the haplotypes had a significant meaning (P < 0.001). The haplotypes associated with the risk of dyslipidemia in both ethnic groups are also shown in Table 2. The effects of these haplotypes on serum lipid traits are shown in Figure 3. In the meantime, the stratified risk factors and MVK/MMAB haplotypes associated with dyslipidemia in each of (Han or Maonan) populations are clarified in Figure 4.
Table 2: Haplotype frequencies among the 4 SNPs in the Maonan and Han populations [n (%)], and associated with dyslipidemia in both ethic groups
Haplotype |
Total |
Han |
Maonan |
P-value |
OR (95%CI) |
|||
|---|---|---|---|---|---|---|---|---|
A |
B |
C |
D |
|||||
C |
C |
C |
T |
1439(57.23) |
721(57.65) |
718(56.82) |
0.000111 |
0.80(0.71~0.89) |
C |
G |
T |
A |
367(14.60) |
126(10.06) |
241(19.02) |
5.55×10⁻¹⁶ |
1.99(1.69~2.35) |
A |
G |
T |
A |
312(12.41) |
141(11.27) |
171(13.55) |
0.007179 |
1.17(0.97~1.34) |
C |
G |
C |
T |
199(7.91) |
88(7.06) |
111(8.78) |
0.007975 |
1.20(0.98~1.48) |
A |
C |
T |
A |
49(1.93) |
36(2.86) |
13(0.53) |
1.52×10⁻¹⁶ |
0.16(0.09~0.32) |
A, rs3759387 A > C; B, rs877710 C > G; C, rs7134594 C > T; D, rs9593 A > T.
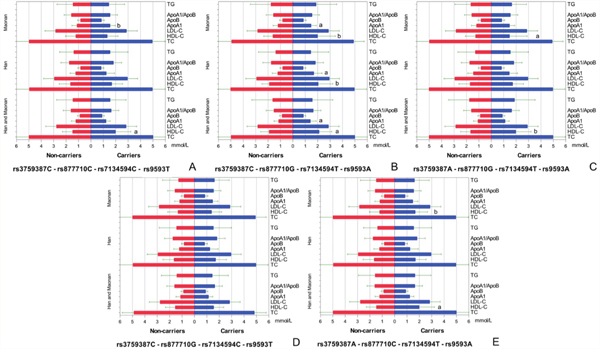
Figure 3: Lipid profiles according to the haplotypes of the two ethnic groups. P < 0.0125 (corresponding to P < 0.05 after adjusting for 4 independent tests by the Bonferroni correction) was considered statistically significant. All of the detected haplotype carriers had higher serum HDL-C and/or ApoA1 levels than the haplotype non-carriers except for rs3759387C-rs877710G-rs7134594C-rs9593T carriers. aP < 0.0125; bP < 0.001.
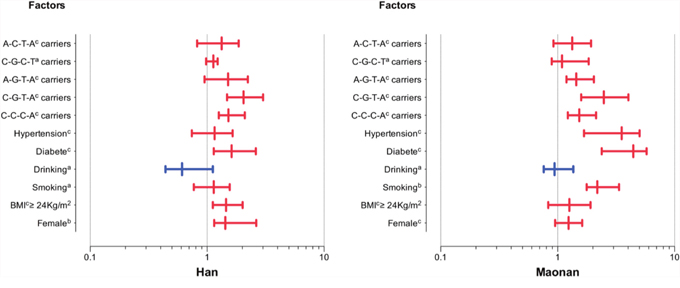
Figure 4: The stratified risk factors and MVK/MMAB haplotypes associated with dyslipidemia in the Han and Maonan populations. Stratified analysis showed an increased risk of dyslipidemia in female, high BMI, smoking, diabetes or hypertension subgroups and haplotype carriers, but not in drinking subgroup. aP < 0.05;bP < 0.01 and cP < 0.001.
Correlated factors for serum lipid parameters
Table 3 descripts the association between serum lipid profiles and four MVK/MMAB alleles and/or genotypes in the Han and Maonan ethnic groups, adjusting for age, sex, BMI, smoking status, alcohol use, and exercise. The genotypes and alleles were associated with HDL-C (rs3759387, rs877710 and rs7134594) in Maonan minority (P < 0.0125); HDL-C (rs3759387 and rs7134594) in Han nationality (P < 0.0125). In addition, serum lipid profiles were also related to some environmental exposures such as gender, time to life, alcohol drinking, cigarette smoking, blood pressure, blood glucose, waist circumference, and BMI in both ethnic groups or in males and females (P < 0.0125-0.001; Table 4).
Table 3: Association between serum lipid parameters and the MVK/MMAB alleles/genotypes in the Han and Maonan populations
Lipid |
SNP |
Affected allele/ Other allele |
Affected genotype/ Other genotype |
Std.error |
Beta |
t |
P |
|---|---|---|---|---|---|---|---|
Han plus Maonan |
|||||||
TC |
rs877710 |
GG+CG/CC |
0.027 |
0.119 |
4.581 |
1.2×10⁻⁵ |
|
HDL-C |
rs3759387 |
AC+CC/AA |
0.004 |
0.169 |
4.943 |
1.4×10⁻⁵ |
|
rs3759387 |
C/A |
0.023 |
0.123 |
3.948 |
8×10⁻⁴ |
||
rs877710 |
GG+CG/CC |
0.026 |
0.237 |
4.351 |
9.3×10⁻⁴ |
||
rs877710 |
G/C |
0.031 |
0.146 |
4.332 |
9×10⁻⁴ |
||
rs7134594 |
CT+TT/CC |
0.056 |
0.478 |
2.237 |
0.006 |
||
rs7134594 |
T/C |
0.023 |
0.141 |
3.422 |
5×10⁻⁴ |
||
rs9593 |
AT+TT/AA |
0.015 |
0.216 |
2.241 |
0.005 |
||
rs9593 |
T/A |
0.044 |
0.147 |
3.958 |
6×10⁻⁴ |
||
ApoA1 |
rs7134594 |
CT+TT/CC |
0.091 |
0.091 |
3.443 |
0.001 |
|
rs7134594 |
T/C |
0.013 |
-0.067 |
-3.048 |
0.002 |
||
Han |
|||||||
HDL-C |
rs3759387 |
AC+CC/AA |
0.028 |
-0.081 |
-2.452 |
0.011 |
|
rs3759387 |
C/A |
0.054 |
0.054 |
2.818 |
0.004 |
||
rs7134594 |
CT+TT/CC |
0.028 |
0.211 |
2.226 |
0.008 |
||
rs7134594 |
T/C |
0.021 |
0.229 |
3.444 |
8.4×10⁻⁴ |
||
ApoA1 |
rs877710 |
G/C |
0.025 |
0.136 |
4.352 |
9.6×10⁻⁴ |
|
Maonan |
|||||||
HDL-C |
rs3759387 |
AC+CC/AA |
0.003 |
0.139 |
4.903 |
1.33×10⁻⁵ |
|
rs3759387 |
C/A |
0.033 |
0.111 |
3.978 |
7.13×10⁻⁴ |
||
rs877710 |
GG+CG/CC |
0.025 |
0.224 |
3.998 |
6.6×10⁻⁴ |
||
rs877710 |
G/C |
0.014 |
0.009 |
2.981 |
0.001 |
||
rs7134594 |
CT+TT/CC |
0.043 |
0.332 |
2.544 |
0.003 |
||
rs7134594 |
T/C |
0.023 |
0.147 |
3.258 |
7.3×10⁻⁴ |
||
ApoA1 |
rs877710 |
G/C |
0.029 |
0.220 |
4.137 |
9.2×10⁻⁴ |
TC, total cholesterol; HDL-C, high-density lipoprotein cholesterol; Apo, apolipoprotein; Beta, standardized coefficient.
Table 4: Association between serum lipid parameters and relative factors in the Han and Maonan populations
Lipid |
Risk factor |
B |
Std.error |
Beta |
t |
P |
|---|---|---|---|---|---|---|
Han plus Maonan |
||||||
TC |
Waist circumference |
0.017 |
0.005 |
0.127 |
3.303 |
0.001 |
Age |
0.009 |
0.002 |
0.113 |
3.958 |
9.45×10⁻⁴ |
|
Alcohol consumption |
-0.497 |
0.053 |
-0.222 |
-9.323 |
1.87×10⁻⁶ |
|
Body mass index |
0.007 |
0.002 |
0.070 |
2.881 |
0.005 |
|
TG |
Waist circumference |
0.169 |
0.038 |
0.106 |
4.500 |
4.34×10⁻⁵ |
Age |
0.388 |
0.126 |
0.089 |
3.068 |
0.002 |
|
Body mass index |
0.079 |
0.025 |
0.076 |
3.128 |
0.002 |
|
Glucose |
0.011 |
0.004 |
0.071 |
2.913 |
0.005 |
|
HDL-C |
Waist circumference |
-0.010 |
0.002 |
-0.206 |
-5.289 |
5.33×10⁻⁵ |
Gender |
0.148 |
0.034 |
0.167 |
4.403 |
3.29×10⁻⁴ |
|
Cigarette smoking |
0.085 |
0.032 |
0.083 |
2.655 |
0.008 |
|
Alcohol consumption |
0.098 |
0.032 |
0.107 |
3.027 |
0.003 |
|
LDL-C |
Ethnic group |
0.022 |
0.006 |
0.144 |
3.917 |
0.003 |
Age |
-0.013 |
0.005 |
-0.108 |
-2.556 |
0.011 |
|
Alcohol consumption |
0.141 |
0.042 |
0.152 |
2.718 |
0.007 |
|
Gender |
-0.007 |
0.003 |
-0.120 |
-2.040 |
0.012 |
|
ApoA1 |
Age |
0.166 |
0.051 |
0.145 |
3.241 |
0.001 |
Glucose |
0.081 |
0.027 |
0.165 |
2.988 |
0.003 |
|
Gender |
0.163 |
0.027 |
0.268 |
6.067 |
7.13×10⁻⁵ |
|
Ethnic group |
0.080 |
0.026 |
0.146 |
3.152 |
0.002 |
|
ApoB |
Glucose |
0.009 |
0.004 |
0.085 |
2.466 |
0.005 |
Ethnic group |
0.028 |
0.010 |
0.147 |
2.731 |
0.006 |
|
ApoA1/ApoB |
Ethnic group |
0.540 |
0.170 |
0.127 |
3.177 |
0.002 |
Age |
-0.103 |
0.035 |
-0.479 |
-2.936 |
0.003 |
|
Gender |
-0.299 |
0.105 |
-0.620 |
-2.854 |
0.004 |
|
Alcohol consumption |
-0.012 |
0.002 |
-0.273 |
-5.069 |
4.41×10⁻⁵ |
|
Han |
||||||
TC |
Waist circumference |
0.021 |
0.003 |
0.336 |
6.305 |
7.88×10⁻⁵ |
Age |
-0.034 |
0.012 |
-0.904 |
-2.938 |
0.005 |
|
TG |
Waist circumference |
-0.127 |
0.040 |
-1.691 |
-3.189 |
9.73×10⁻⁴ |
Glucose |
0.510 |
0.180 |
1.634 |
2.867 |
0.004 |
|
Systolic blood pressure |
0.004 |
0.001 |
0.218 |
4.646 |
4.03×10⁻⁴ |
|
HDL-C |
Gender |
-0.008 |
0.002 |
-0.203 |
-3.752 |
9.93×10⁻⁴ |
Cigarette smoking |
0.173 |
0.046 |
0.204 |
3.745 |
9.96×10⁻⁴ |
|
Weight |
0.297 |
0.073 |
0.216 |
4.409 |
5.92×10⁻⁴ |
|
Alcohol consumption |
0.079 |
0.030 |
0.144 |
2.614 |
0.009 |
|
LDL-C |
Waist circumference |
0.003 |
0.001 |
0.199 |
3.193 |
0.002 |
Gender |
-0.299 |
0.105 |
-0.620 |
-2.854 |
0.004 |
|
Age |
0.067 |
0.017 |
0.207 |
4.028 |
6.16×10⁻⁴ |
|
Cigarette smoking |
0.003 |
0.001 |
0.186 |
3.650 |
9.98×10⁻⁴ |
|
ApoA1 |
Gender |
0.044 |
0.013 |
0.142 |
3.342 |
0.001 |
Alcohol consumption |
0.001 |
0.001 |
0.118 |
2.517 |
0.012 |
|
ApoB |
Glucose |
-0.003 |
0.001 |
-0.138 |
-2.922 |
0.004 |
Age |
0.001 |
0.001 |
0.079 |
2.034 |
0.011 |
|
ApoA1/ApoB |
Glucose |
-0.021 |
0.007 |
-0.091 |
-3.156 |
0.002 |
Gender |
0.147 |
0.019 |
0.173 |
3.805 |
9.97×10⁻⁴ |
|
Maonan |
||||||
TC |
Waist circumference |
0.316 |
0.141 |
1.131 |
2.549 |
0.010 |
Gender |
0.021 |
0.003 |
0.336 |
6.305 |
7.44×10⁻⁵ |
|
Weight |
0.297 |
0.073 |
0.216 |
4.409 |
5.22×10⁻⁴ |
|
Age |
-0.034 |
0.012 |
-0.904 |
-2.938 |
0.005 |
|
TG |
Waist circumference |
-0.127 |
0.040 |
-1.691 |
-3.189 |
9.98×10⁻⁴ |
Alcohol consumption |
0.510 |
0.180 |
1.634 |
2.867 |
0.004 |
|
Height |
0.012 |
0.003 |
0.150 |
3.653 |
9.95×10⁻⁴ |
|
Weight |
0.366 |
0.059 |
0.207 |
6.148 |
7.11×10⁻⁵ |
|
Body mass index |
0.028 |
0.010 |
0.147 |
2.731 |
0.006 |
|
HDL-C |
Waist circumference |
0.540 |
0.170 |
0.127 |
3.177 |
0.002 |
Systolic blood pressure |
-0.103 |
0.035 |
-0.479 |
-2.936 |
0.003 |
|
Diastolic blood pressure |
0.156 |
0.048 |
0.959 |
3.237 |
0.001 |
|
Alcohol consumption |
-0.012 |
0.002 |
-0.273 |
-5.069 |
5.23×10⁻⁵ |
|
Cigarette smoking |
0.157 |
0.044 |
0.192 |
3.601 |
9.92×10⁻⁴ |
|
LDL-C |
Age |
0.019 |
0.007 |
0.152 |
2.611 |
0.009 |
Waist circumference |
0.010 |
0.003 |
0.117 |
3.142 |
0.002 |
|
ApoA1 |
Alcohol consumption |
0.061 |
0.013 |
0.273 |
4.743 |
0.006 |
Cigarette smoking |
0.022 |
0.006 |
0.144 |
3.917 |
0.003 |
|
ApoB |
Waist circumference |
-0.013 |
0.005 |
-0.108 |
-2.556 |
0.011 |
ApoA1/ApoB |
Age |
-0.007 |
0.003 |
-0.120 |
-2.940 |
0.004 |
Alcohol consumption |
0.166 |
0.051 |
0.145 |
3.241 |
0.001 |
TC, total cholesterol; TG, triglyceride; HDL-C, high-density lipoprotein cholesterol; LDL-C, low-density lipoprotein cholesterol; ApoA1, apolipoprotein A1; ApoB, apolipoprotein B; ApoA1/ApoB, the ratio of apolipoprotein A1 to apolipoprotein B; B, unstandardized coefficient; Beta, standardized coefficient.
Relative factors for serum lipid phenotypes
As shown in Figure 5, Pearson correlation analysis demonstrated that the integrative variants and haplotypes connected with the MVK rs3759387 and MMAB rs877710, rs7134594, rs9593 SNPs to lipid variables. A number of environmental exposures such as time to life, sex, cigarette smoking, alcohol drinking and conventional cardiovascular risk factors such as BMI and blood pressure values were also related to plasm lipid phenotypic profiles of both ethnic groups.
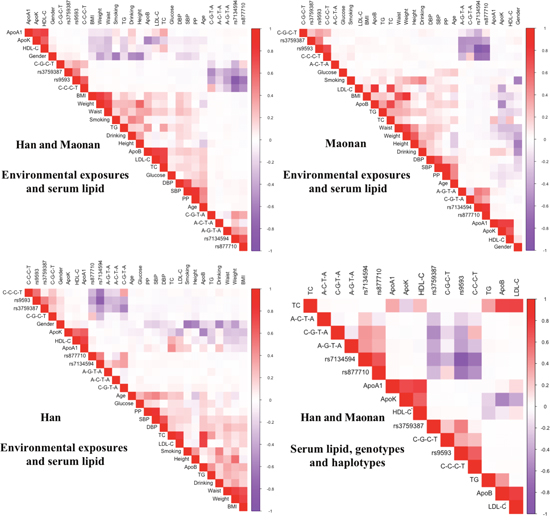
Figure 5: Correlation between environmental exposures and serum lipid variables, as well as the candidate loci. TC, total cholesterol; TG, triglyceride; HDL-C, high-density lipoprotein cholesterol; LDL-C, low-density lipoprotein cholesterol; ApoA1, apolipoprotein A1; ApoB, apolipoprotein B; ApoA1/ApoB, the ratio of apolipoprotein A1 to apolipoprotein B; BMI, body mass index.
DISCUSSION
In the current study, it is the first time we revealed the association of the MVK rs3759387 and MMAB rs877710, rs7134594, rs9593 SNPs and some serum lipid profiles in Maonan minority; the LD status, the haplotype frequencies of the selected SNPs and associated with dyslipidemia in Maonan and/or Han ethnic groups. Furthermore, we also completely duplicated the association of MVK rs3759387 and MMAB rs877710, rs7134594, rs9593 SNPs with the levels of serum HDL-C in the Maonan population; and MVK rs3759387 and MMAB rs877710, rs7134594, rs9593 SNPs with serum HDL-C levels and MMAB rs877710, rs7134594 SNPs with serum ApoA1 in the Han ethnic group. The SNPs of rs877710, rs3759387 and rs7134594 have been associated with HDL-C in some previous studies [24, 25], however nothing can be found about the association of the four SNPs and other serum lipid profiles in previous researches.
Besides, the differences in genotypic and allelic frequencies of four SNPs in current research also have not been found in different racial/ethnic groups previously. In the current study, we have shown that the genotypic and allelic frequencies of the four SNPs were distinguished Maonan from Han ethnic groups. All of the selected SNPs were in the Hardy-Weinberg equilibrium. According to the International 1000 Genomes data-base (https://www.ncbi.nlm.nih.gov/variation/tools/1000genomes/), the rs3759387 frequencies of A allele and AA, AG genotypes were 23.5%, 5.3% and 36.5% in European; the rs7134594 frequencies of C allele and CC, CT genotypes were 48.7%, 25.7% and 46.1% in European; the rs877710 frequencies of C allele and CC, CG genotypes were 48.7%, 25.6% and 46.0% in European; the rs9593 frequencies of A allele and AA, AT genotypes were 50%, 21.7% and 56.7% in European; respectively. All of above frequencies in European were significantly different from Han or Maonan ethnic groups. That means the minor allele or rare homozygote genotype frequencies in European ancestries of the four selected SNPs were different from Asian ethnic groups from the data. These outcomes reveal that the prevalence of the four SNPs’ minor allelic or rare homozygote genotypic frequencies would be shared a racial/ethnic-specificity.
MVK and MMAB are arranged in a head-to-head orientation on chromosome 12. In humans, when MVK mutations in homozygosity can give rise to hyperimmunoglobulinemia D syndrome, which the basic symptoms were fever and high concentrations of immunoglobulins D and A in blood. When the patients suffered from hyperimmunoglobulinemia D syndrome, low HDL-C levels can be found, in accordance with the latest GWASes findings [18, 19]. However, when somebody lacked of cob (I) alamin adenosyltransferase, as an enzyme encoded by MMAB, may contribute to methylmalonic aciduria [32]. But, the exact metabolism by which MMAB influences cholesterol is still unknown. A relevant report about schizophrenia had revealed that urinary methylmalonic acid may negatively correlated with red blood cell membrane cholesterol levels in blood [33]. In addition, MVK and MMAB, which share the same promoter, are both modified by sterol-responsive element-binding protein 2 (SREBP2), which is a transcription factor that controls cholesterol homeostasis. Furthermore, the way in which these two neighboring genes take part in metabolic pathways may have an effect on HDL metabolism had been found. MVK encodes for MVK, play an important role in an initial stage in cholesterol biosynthesis (Supplementary Figure 5) [34]. In contrast, when lacked of cob (I) alamin adenosyltransferase, as an enzyme encoded by MMAB, someone may result to methylmalonic aciduria. The exact reason MMAB can adjust cholesterol metabolism has not been identified, maybe cholesterol synthesis through SREBP2 can explain our findings [35]. The precise mechanism of MVK and MMAB on serum lipid metabolism remains to be investigated, which may provide a promising target for medical therapy.
In the present research, we also showed that there might be a racial/ethnic specific association of the four SNPs and lipid parameters. The association of the other SNPs near MVK/MMAB and lipid profiles has been reported previously [36, 37]. However, no significant association between MVK/MMAB SNPs and HDL-C concentrations was selected in the Japanese population [38]. At the same time, Junyent et al. showed that the MMAB 3U3527G > C variants may result in the variation in HDL-C levels, particularly in those individuals with high carbohydrate consumptions [27]. With these situations, it’s still not exactly to comprehend the reason why these contradictions related to the selected SNPs and serum lipid profiles between both of these ethnic groups. This might be attributed to the distinctions in genetic factor to some extent. In addition, the interaction of gene-gene, gene-environment and environment-environment on lipid parameters remain to be interpreted. Previous researches have revealed that environmental exposures were significantly correlated with serum lipid profiles, including hypertension, obesity, physical activity, dietary patterns and lifestyle [39–45]. There was association of gender, age, BMI, cigarette smoking, alcohol consumption, blood pressure and serum lipid levels in both Maonan and Han populations. Above of the explored data demonstrated several environmental exposures may play dominant part in influencing lipid profiles. The dietary habits were different between the Han and Maonan populations. Rice is the Maonan people’s staple food supplemented with corn, sweet potato and other grains. Maonan people preferred to eat spicy and acid food with lots of oil and salt. This preference of high in carbohydrates may be related to the higher blood glucose levels, weight, BMI and waist circumference in Maonan than in Han people. As well as rich oil and salt can give rise to higher blood pressure, serum TC, LDL-C and ApoB levels in Maonan than in Han people. Previous studies proved that diet alone could account for the variability on serum lipid levels [45, 46]. In the current study, we found that part of participants who consumed alcohol (> 25 g/day) was lower in Maonan than in Han ethnic groups. Whether the alcohol consumption take effects on lipid profiles was still not understood, maybe some differences would exist in kinds of specific patient or the alcohol consumption types, and it seems by different gender and ethnic groups. Thus, we just had better pay more attention to current studies [47].
Another reason might be attributed to the differences in LD pattern among the study ethnic groups. In the present study, we selected that the C-G-T-A, A-G-T-A and A-C-T-A haplotypes’ frequencies were distinguished Maonan from Han ethnic groups. The haplotypes which combined with four SNPs had more power to account for serum lipid variation than any single SNP alone, particularly to HDL-C. For this reason, ethnic distinctions in the LD pattern may account for the contradictions related to the selected SNPs with lipid profiles among diverse ethnic groups.
Besides above, the environmental exposures, genetic factors might also give rise to dyslipidemia [48]. When considered family and twin studies, the genetic factors can explain approximate 40%-60% of the person variation in serum lipid levels [49–51]. Intra-ethnic marriages were popular in Maonan. For example, more than 80% of the Maonan people share the same surname: Tan. Thus, the hereditary characteristics and phenotypes of some lipid metabolism-related genes in Maonan might be different from those in Han. A lot of series reports have found that the genetic polymorphisms of some genes in the Maonan population were different from those in Han Chinese [30, 52]. But this remains to be conclusively determined.
A few potential limitations cannot be ignored. First, compared to many GWASes and replication studies, our sample numbers were relatively small. With these situations, larger sample numbers are needed to determine the consequences in future studies. Next, lots of items cannot be matched in both ethnic groups, including the percentages of smoking or drinking, waist circumference and the body weight. In addition, several confounding factors may have potential effect on serum lipid levels among different genotypes in both ethnic groups, just as time to life, BMI, blood pressure, cigarette smoking, and alcohol consumption, even if we have been adjusted for the statistical analysis. Last but not least, because of not cover the extensive MVK/MMAB locus, a lot of messages from other SNPs would be drop out.
In summary, the genotypic and allelic frequencies of the MVK rs3759387 and MMAB rs877710, rs7134594 and rs9593 SNPs were different between Maonan and Han. Four SNPs were associated with HDL-C in the both ethnic groups; and one SNP with ApoA1 (rs7134594) in Han Chinese. There were five haplotypes identified in our study population. The MVK and MMAB SNPs and C-C-C-T, C-G-T-A, A-G-T-A, A-C-T-A haplotypes are associated with serum lipid traits. The haplotypes had more power to account for serum lipid variation than any single SNP alone, particularly to HDL-C.
MATERIALS AND METHODS
Subjects
The study populations including 1251 unrelated subjects (476 males, 38.05% and 775 females, 61.95%) of Han and 1264 unrelated participants (517 males, 40.83% and 747 females, 59.17%) of Maonan were randomly selected from our previous stratified randomized samples. The participants were all agricultural workers from Huanjiang Maonan Autonomous County, Guangxi Zhuang Autonomous region, People’s Republic of China. The participants’ age ranged from 25 to 80 years with the mean age of 55.88 ± 13.89 years in Han and 56.97 ± 15.12 years in Maonan; respectively. The age distribution and gender ratio were matched between the two groups. All participants were essentially healthy with no history of cardiovascular disease such as CAD, stroke, diabetes, hyper- or hypo-thyroids, and chronic renal disease. They were free from medications known to affect serum lipid levels. The investigations were carried out following the rules of the Declaration of Helsinki of 1975 (http://www.wma.net/en/30publications/10policies/b3/), revised in 2008. The study design was approved by the Ethics Committee of the First Affiliated Hospital, Guangxi Medical University (No: Lunshen-2014-KY-Guoji-001; Mar. 7, 2014). All procedures were performed in accordance with ethical standards. Informed consent was obtained from all participants.
Epidemiological survey
The epidemiological survey was carried out using internationally standardized methods, following a common protocol [53]. Information on demographics, socioeconomic status, and lifestyle factors was collected with standardized questionnaires. Alcohol consumption was categorized into groups of grams of alcohol per day: 0 (non-drinker), < 25 and ≥ 25. Smoking status was categorized into groups of cigarettes per day: 0 (non-smoker), < 20 and ≥ 20. Several parameters such as blood pressure, height, weight, waist circumference, and BMI were measured. The methods of measuring above parameters were referred to a previous study [54].
Biochemical analysis
A fasting venous blood sample of 5 ml was drawn from the participants. A part of the sample (2 mL) was collected into glass tubes and used to determine serum lipid levels. Another part of the sample (3 mL) was transferred to tubes with anticoagulants (4.80 g/L citric acid, 14.70 g/L glucose and 13.20 g/L tri-sodium citrate) and used to extract deoxyribonucleic acid (DNA). Measurements of serum TC, TG, HDL-C, and LDL-C levels in the samples were performed by enzymatic methods with commercially available kits (RANDOX Laboratories Ltd., Ardmore, Diamond Road, Crumlin Co. Antrim, United Kingdom, BT29 4QY; Daiichi Pure Chemicals Co., Ltd., Tokyo, Japan). Serum ApoA1 and ApoB levels were detected by the immunoturbidimetric immunoassay using a commercial kit (RANDOX Laboratories Ltd.). All determinations were performed with an auto-analyzer (Type 7170A; Hitachi Ltd., Tokyo, Japan) in the Clinical Science Experiment Center of the First Affiliated Hospital, Guangxi Medical University [55, 56].
SNPs selection
We selected four SNPs in the MVK/MMAB with the following steps: (1) MVK gene clusters, which were selected from previous GWAS associated with lipid-metabolism. MMAB gene clusters are found to be close to MVK gene clusters and associated with serum lipid level especially HDL. (2) Tagging SNPs, which were established by Haploview (Broad Institute of MIT and Harvard, USA, version 4.2) and functional SNPs predicted to lead to serum lipid changes from current version of online resource (1000 Genome Project Database). (3) SNPs information was obtained from NCBI dbSNP Build 132 (http://www.ncbi.nlm.nih.gov/SNP/); (4) SNPs were restricted to minor allele frequency (MAF) > 1%; (5) SNPs might be associated with the plasma lipid levels or cardiovascular disease in recent studies; and (6) MVK rs3759587, rs7134594 and MMAB rs9593 rs877710, which were selected by the block-based approach. This strategy is enable by the correlations between tagging SNPs as manifested as LD. Although classic is not goal of tagging SNP selection, innovative tagging SNPs selection bias is inevitable.
DNA amplification and genotyping
Genomic DNA of the samples was isolated from peripheral blood leucocytes according to the phenol-chloroform method [55, 56]. Genotyping of 4 mutations was performed by PCR-RFLP and Sanger sequencing. The characteristics of each mutation and the details of each primer pair, annealing temperature, length of the PCR products are summarized in Supplementary Table 1 and Supplementary Figures 2 and 3. The PCR products of the samples were sequenced with a sequencer ABI Prism 3100 Genetic Analyzer (Applied Biosystems, International Equipment Trading Ltd., Vernon Hills, IL, USA) in Shanghai Sangon Biological Engineering Technology & Services Co. Ltd., Shanghai China (Supplementary Figure 4).
Diagnostic criteria
The normal values of serum TC, TG, HDL-C, LDL-C, ApoA1, ApoB levels and the ApoA1/ApoB ratio in our Clinical Science Experiment Center were 3.10–5.17, 0.56–1.70, 1.16–1.42, 2.70–3.10 mmol/L, 1.20–1.60, 0.80–1.05 g/L and 1.00–2.50, respectively. The individuals with TC > 5.17 mmol/L and/or TG > 1.70 mmol/L were defined as hyperlipidaemic [57]. Hypertension was diagnosed according to the 1999 and 2003 criteria of the World Health Organization-International Society of Hypertension Guidelines for the management of hypertension [58, 59]. The diagnostic criteria of overweight and obesity were according to the Cooperative Meta-analysis Group of China Obesity Task Force. Normal weight, overweight and obesity were defined as a BMI < 24, 24–28 and > 28 kg/m2, respectively [60].
Statistical analyses
The statistical analyses were performed with the statistical software package SPSS 22.0 (SPSS Inc., Chicago, Illinois). The quantitative variables were presented as mean ± standard deviation (Because serum TG was not a normal distribution, the levels were presented as medians and interquartile ranges and analysis by Wilcoxon-Mann-Whitney test). Allele frequency was determined via direct counting, and the Hardy-Weinberg equilibrium was verified with the standard goodness-of-fit test. The genotype distribution between the two groups was analyzed by the chi-square test. General characteristics between two ethnic groups were compared by the Student’s unpaired t-test. The association between genotypes and serum lipid parameters was tested by covariance analysis (ANCOVA). Any SNPs associated with the lipid profiles at the value of P < 0.0125 (corresponding to P < 0.05 after adjusting for 4 independent tests by the Bonferroni correction) were considered statistically significant. Gender, age, BMI, blood pressure, alcohol consumption and cigarette smoking were adjusted for the statistical analysis. Haploview (Broad Institute of MIT and Harvard, USA, version 4.2) analyzed the haplotype frequencies and pair-wise LD among the detected SNPs. Unconditional logistic regression was used to assess the correlation between the risk of hyperlipidemia and genotypes. The model of age, gender, BMI, waist circumference, systolic blood pressure, diastolic blood pressure, pulse pressure, cigarette smoking, alcohol consumption and fasting plasma glucose level were adjusted for the statistical analysis. Multivariable linear regression analyses with stepwise modeling were used to determine the correlation between the genotypes (common homozygote genotype = 1, heterozygote genotype = 2, rare homozygote genotype = 3) or alleles (the minor allele non-carrier = 1, the minor allele carrier = 2) and several environmental factors with serum lipid levels in males and females of Han and Maonan populations. Two sides P value < 0.05 was considered statistically significant. The heart-map of inter-locus models was measured by R software (version 3.3.0) [61].
ACKNOWLEDGMENTS
L.M. conceived the study, participated in the design, undertook genotyping, performed the statistical analyses, and drafted the manuscript. R.-X.Y. conceived the study, participated in the design, carried out the epidemiological survey, collected the samples, and helped to draft the manuscript. S.Y. collaborated to the genotyping. S.-L.P., D.-Z.Y. and W.-X.L. carried out the epidemiological survey and collected the samples. All authors read and approved the final manuscript.
CONFLICTS OF INTEREST
The authors have no potential conflicts of interest to report.
FUNDING
The authors acknowledge the essential role of the funding of the National Natural Science Foundation of China (No: 81460169) and the Innovation Project of Guangxi Graduate Education in this motif.
REFERENCES
1. WHO publishes definitive atlas on global heart disease and stroke epidemic. Indian J Med Sci. 2004; 58:405-406.
2. Gordon DJ, Probstfield JL, Garrison RJ, Neaton JD, Castelli WP, Knoke JD, Jacobs DR Jr, Bangdiwala S, Tyroler HA. High-density lipoprotein cholesterol and cardiovascular disease. Four prospective American studies. Circulation. 1989; 79:8-15.
3. Abbott RD, Donahue RP, Kannel WB, Wilson PW. The impact of diabetes on survival following myocardial infarction in men vs women. The Framingham Study. JAMA. 1988; 260:3456-3460.
4. Wilson PW, D'Agostino RB, Levy D, Belanger AM, Silbershatz H, Kannel WB. Prediction of coronary heart disease using risk factor categories. Circulation. 1998; 97:1837-1847.
5. Grundy SM, Cleeman JI, Merz CN, Brewer HB Jr, Clark LT, Hunninghake DB, Pasternak RC, Smith SC Jr, Stone NJ; Coordinating Committee of the National Cholesterol Education P. Implications of recent clinical trials for the National Cholesterol Education Program Adult Treatment Panel III Guidelines. J Am Coll Cardiol. 2004; 44:720-732.
6. Gotto AM Jr, Brinton EA. Assessing low levels of high-density lipoprotein cholesterol as a risk factor in coronary heart disease: a working group report and update. J Am Coll Cardiol. 2004; 43:717-724.
7. Vishram JK, Borglykke A, Andreasen AH, Jeppesen J, Ibsen H, Jorgensen T, Palmieri L, Giampaoli S, Donfrancesco C, Kee F, Mancia G, Cesana G, Kuulasmaa K, et al. Impact of age and gender on the prevalence and prognostic importance of the metabolic syndrome and its components in Europeans. The MORGAM Prospective Cohort Project. PLoS One. 2015; 10:e0128848.
8. Wald NJ, Simmonds M, Morris JK. Screening for future cardiovascular disease using age alone compared with multiple risk factors and age. PLoS One. 2011; 6:e18742.
9. Goh LG, Dhaliwal SS, Welborn TA, Lee AH, Della PR. Ethnicity and the association between anthropometric indices of obesity and cardiovascular risk in women: a cross-sectional study. BMJ Open. 2014; 4:e004702.
10. Chiuve SE, Cook NR, Shay CM, Rexrode KM, Albert CM, Manson JE, Willett WC, Rimm EB. Lifestyle-based prediction model for the prevention of CVD: the Healthy Heart Score. J Am Heart Assoc. 2014; 3:e000954.
11. Weihua Mmed L, Yougang W, Jing W. Reduced or modified dietary fat for preventing cardiovascular disease. J Cardiovasc Nurs. 2013; 28:204-205.
12. Booth FW, Roberts CK, Laye MJ. Lack of exercise is a major cause of chronic diseases. Compr Physiol. 2012; 2:1143-1211.
13. Chum A, O'Campo P. Cross-sectional associations between residential environmental exposures and cardiovascular diseases. BMC Public Health. 2015; 15:438.
14. Thanassoulis G, Vasan RS. Genetic cardiovascular risk prediction: will we get there? Circulation. 2010; 122:2323-2334.
15. Thanassoulis G, Peloso GM, Pencina MJ, Hoffmann U, Fox CS, Cupples LA, Levy D, D'Agostino RB, Hwang SJ, O'Donnell CJ. A genetic risk score is associated with incident cardiovascular disease and coronary artery calcium: the Framingham Heart Study. Circ Cardiovasc Genet. 2012; 5:113-121.
16. Harrap SB, Wong ZY, Scurrah KJ, Lamantia A. Genome-wide linkage analysis of population variation in high-density lipoprotein cholesterol. Hum Genet. 2006; 119:541-546.
17. Goode EL, Cherny SS, Christian JC, Jarvik GP, de Andrade M. Heritability of longitudinal measures of body mass index and lipid and lipoprotein levels in aging twins. Twin Res Hum Genet. 2007; 10:703-711.
18. Willer CJ, Sanna S, Jackson AU, Scuteri A, Bonnycastle LL, Clarke R, Heath SC, Timpson NJ, Najjar SS, Stringham HM, Strait J, Duren WL, Maschio A, et al. Newly identified loci that influence lipid concentrations and risk of coronary artery disease. Nat Genet. 2008; 40:161-169.
19. Deodato F, Boenzi S, Santorelli FM, Dionisi-Vici C. Methylmalonic and propionic aciduria. Am J Med Genet C Semin Med Genet. 2006; 142C:104-112.
20. Feitosa ME, Rice T, Borecki IB, Rankinen T, Leon AS, Skinner JS, Despres JP, Blangero J, Bouchard C, Rao DC. Pleiotropic QTL on chromosome 12q23-q24 influences triglyceride and high-density lipoprotein cholesterol levels: the HERITAGE family study. Hum Biol. 2006; 78:317-327.
21. Bosse Y, Chagnon YC, Despres JP, Rice T, Rao DC, Bouchard C, Perusse L, Vohl MC. Genome-wide linkage scan reveals multiple susceptibility loci influencing lipid and lipoprotein levels in the Quebec Family Study. J Lipid Res. 2004; 45:419-426.
22. Welch CL, Xia YR, Shechter I, Farese R, Mehrabian M, Mehdizadeh S, Warden CH, Lusis AJ. Genetic regulation of cholesterol homeostasis: chromosomal organization of candidate genes. J Lipid Res. 1996; 37:1406-1421.
23. Holleboom AG, Vergeer M, Hovingh GK, Kastelein JJ, Kuivenhoven JA. The value of HDL genetics. Curr Opin Lipidol. 2008; 19:385-394.
24. Teslovich TM, Musunuru K, Smith AV, Edmondson AC, Stylianou IM, Koseki M, Pirruccello JP, Ripatti S, Chasman DI, Willer CJ, Johansen CT, Fouchier SW, Isaacs A, et al. Biological, clinical and population relevance of 95 loci for blood lipids. Nature. 2010; 466:707-713.
25. Jeemon P, Pettigrew K, Sainsbury C, Prabhakaran D, Padmanabhan S. Implications of discoveries from genome-wide association studies in current cardiovascular practice. World J Cardiol. 2011; 3:230-247.
26. Sun J, Qian Y, Jiang Y, Chen J, Dai J, Jin G, Wang J, Hu Z, Liu S, Shen C, Shen H. Association of KCTD10, MVK, and MMAB polymorphisms with dyslipidemia and coronary heart disease in Han Chinese population. Lipids Health Dis. 2016; 15:171.
27. Junyent M, Parnell LD, Lai CQ, Lee YC, Smith CE, Arnett DK, Tsai MY, Kabagambe EK, Straka RJ, Province M, An P, Borecki I, Ordovas JM. Novel variants at KCTD10, MVK, and MMAB genes interact with dietary carbohydrates to modulate HDL-cholesterol concentrations in the Genetics of Lipid Lowering Drugs and Diet Network Study. Am J Clin Nutr. 2009; 90:686-694.
28. Fogarty MP, Xiao R, Prokunina-Olsson L, Scott LJ, Mohlke KL. Allelic expression imbalance at high-density lipoprotein cholesterol locus MMAB-MVK. Hum Mol Genet. 2010; 19:1921-1929.
29. Deng Q, Xu L, Gong J, Zhou L, Li S, Deng X, Luo G, Xie X. Genetic relationships among four minorities in Guangxi revealed by analysis of 15 STRs. J Genet Genomics. 2007; 34:1072-1079.
30. Yao Y, Shi L, Shi L, Lin K, Yu L, Sun H, Huang X, Tao Y, Yi W, Liu S, Chu J. The association between HLA-A, -B alleles and major histocompatibility complex class I polymorphic Alu insertions in four populations in China. Tissue Antigens. 2009; 73:575-581.
31. Li XM, Ouyang Y, Yang YC, Lin R, Xu HB, Xie ZY, Li SL, Shang SM. Distribution of food-borne parasitic diseases and dietary habits in human population in Guangxi. Zhongguo Ji Sheng Chong Xue Yu Ji Sheng Chong Bing Za Zhi. 2009; 27:151-155.
32. Dobson CM, Wai T, Leclerc D, Kadir H, Narang M, Lerner-Ellis JP, Hudson TJ, Rosenblatt DS, Gravel RA. Identification of the gene responsible for the cblB complementation group of vitamin B12-dependent methylmalonic aciduria. Hum Mol Genet. 2002; 11:3361-3369.
33. Ozcan O, Ipcioglu OM, Gultepe M, Basogglu C. Altered red cell membrane compositions related to functional vitamin B(12) deficiency manifested by elevated urine methylmalonic acid concentrations in patients with schizophrenia. Ann Clin Biochem. 2008; 45:44-49.
34. Kuijk LM, Beekman JM, Koster J, Waterham HR, Frenkel J, Coffer PJ. HMG-CoA reductase inhibition induces IL-1beta release through Rac1/PI3K/PKB-dependent caspase-1 activation. Blood. 2008; 112:3563-3573.
35. Murphy C, Murray AM, Meaney S, Gafvels M. Regulation by SREBP-2 defines a potential link between isoprenoid and adenosylcobalamin metabolism. Biochem Biophys Res Commun. 2007; 355:359-364.
36. Sarzynski MA, Jacobson P, Rankinen T, Carlsson B, Sjostrom L, Carlsson LM, Bouchard C. Association of GWAS-based candidate genes with HDL-cholesterol levels before and after bariatric surgery in the Swedish obese subjects study. J Clin Endocrinol Metab. 2011; 96:E953-957.
37. Pare G, Serre D, Brisson D, Anand SS, Montpetit A, Tremblay G, Engert JC, Hudson TJ, Gaudet D. Genetic analysis of 103 candidate genes for coronary artery disease and associated phenotypes in a founder population reveals a new association between endothelin-1 and high-density lipoprotein cholesterol. Am J Hum Genet. 2007; 80:673-682.
38. Nakayama K, Bayasgalan T, Yamanaka K, Kumada M, Gotoh T, Utsumi N, Yanagisawa Y, Okayama M, Kajii E, Ishibashi S, Iwamoto S; Jichi Community Genetics T. Large scale replication analysis of loci associated with lipid concentrations in a Japanese population. J Med Genet. 2009; 46:370-374.
39. Ruixing Y, Yuming C, Shangling P, Fengping H, Tangwei L, Dezhai Y, Jinzhen W, Limei Y, Weixiong L, Rongshan L, Jiandong H. Effects of demographic, dietary and other lifestyle factors on the prevalence of hyperlipidemia in Guangxi Hei Yi Zhuang and Han populations. Eur J Cardiovasc Prev Rehabil. 2006; 13:977-984.
40. Ruixing Y, Qiming F, Dezhai Y, Shuquan L, Weixiong L, Shangling P, Hai W, Yongzhong Y, Feng H, Shuming Q. Comparison of demography, diet, lifestyle, and serum lipid levels between the Guangxi Bai Ku Yao and Han populations. J Lipid Res. 2007; 48:2673-2681.
41. Garcia-Palmieri MR, Tillotson J, Cordero E, Costas R Jr, Sorlie P, Gordon T, Kannel WB, Colon AA. Nutrient intake and serum lipids in urban and rural Puerto Rican men. Am J Clin Nutr. 1977; 30:2092-2100.
42. Sola R, Fito M, Estruch R, Salas-Salvado J, Corella D, de La Torre R, Munoz MA, Lopez-Sabater Mdel C, Martinez-Gonzalez MA, Aros F, Ruiz-Gutierrez V, Fiol M, Casals E, et al. Effect of a traditional Mediterranean diet on apolipoproteins B, A-I, and their ratio: a randomized, controlled trial. Atherosclerosis. 2011; 218:174-180.
43. Valente EA, Sheehy ME, Avila JJ, Gutierres JA, Delmonico MJ, Lofgren IE. The effect of the addition of resistance training to a dietary education intervention on apolipoproteins and diet quality in overweight and obese older adults. Clin Interv Aging. 2011; 6:235-241.
44. Mansfield E, McPherson R, Koski KG. Diet and waist-to-hip ratio: important predictors of lipoprotein levels in sedentary and active young men with no evidence of cardiovascular disease. J Am Diet Assoc. 1999; 99:1373-1379.
45. Joffe YT, Collins M, Goedecke JH. The relationship between dietary fatty acids and inflammatory genes on the obese phenotype and serum lipids. Nutrients. 2013; 5:1672-1705.
46. Serrano-Martinez M, Martinez-Losa E, Prado-Santamaria M, Brugarolas-Brufau C, Fernandez-Jarne E, Martinez-Gonzalez MA. To what extent are the effects of diet on coronary heart disease lipid-mediated? Int J Cardiol. 2004; 95:35-38.
47. Onat A, Hergenc G, Dursunoglu D, Ordu S, Can G, Bulur S, Yuksel H. Associations of alcohol consumption with blood pressure, lipoproteins, and subclinical inflammation among Turks. Alcohol. 2008; 42:593-601.
48. Varga TV, Sonestedt E, Shungin D, Koivula RW, Hallmans G, Escher SA, Barroso I, Nilsson P, Melander O, Orho-Melander M, Renstrom F, Franks PW. Genetic determinants of long-term changes in blood lipid concentrations: 10-year follow-up of the GLACIER study. PLoS Genet. 2014; 10:e1004388.
49. Heller DA, de Faire U, Pedersen NL, Dahlen G, McClearn GE. Genetic and environmental influences on serum lipid levels in twins. N Engl J Med. 1993; 328:1150-1156.
50. Steinmetz J, Boerwinkle E, Gueguen R, Visvikis S, Henny J, Siest G. Multivariate genetic analysis of high density lipoprotein particles. Atherosclerosis. 1992; 92:219-227.
51. Perusse L, Rice T, Despres JP, Bergeron J, Province MA, Gagnon J, Leon AS, Rao DC, Skinner JS, Wilmore JH, Bouchard C. Familial resemblance of plasma lipids, lipoproteins and postheparin lipoprotein and hepatic lipases in the HERITAGE Family Study. Arterioscler Thromb Vasc Biol. 1997; 17:3263-3269.
52. Yao Y, Shi L, Shi L, Kulski JK, Chen J, Liu S, Yu L, Lin K, Huang X, Tao Y, Tokunaga K, Chu J. The association and differentiation of MHC class I polymorphic Alu insertions and HLA-B/Cw alleles in seven Chinese populations. Tissue Antigens. 2010; 76:194-207.
53. An epidemiological study of cardiovascular and cardiopulmonary disease risk factors in four populations in the People's Republic of China. Baseline report from the P.R.C.-U.S.A. Collaborative Study. People's Republic of China--United States Cardiovascular and Cardiopulmonary Epidemiology Research Group. Circulation. 1992; 85:1083-1096.
54. Guo T, Yin RX, Li H, Wang YM, Wu JZ, Yang DZ. Association of the Trp316Ser variant (rs1801690) near the apolipoprotein H (beta2-glycoprotein-I) gene and serum lipid levels. Int J Clin Exp Pathol. 2015; 8:7291-7304.
55. Guo T, Yin RX, Nie RJ, Chen X, Bin Y, Lin WX. Suppressor of cytokine signaling 3 A+930-->G (rs4969168) polymorphism is associated with apolipoprotein A1 and low-density lipoprotein cholesterol. Int J Clin Exp Pathol. 2015; 8:7305-7317.
56. Zhang QH, Yin RX, Gao H, Huang F, Wu JZ, Pan SL, Lin WX, Yang DZ. Association of the SPTLC3 rs3645853 polymorphism and serum lipid profiles in two Chinese ethnic groups. Lipids Health Dis. 2017;16:1.
57. Ramazauskiene V, Petkeviciene J, Klumbiene J, Kriaucioniene V, Sakyte E. Diet and serum lipids: changes over socio-economic transition period in Lithuanian rural population. BMC Public Health. 2011; 11:447.
58. Chalmers J, MacMahon S, Mancia G, Whitworth J, Beilin L, Hansson L, Neal B, Rodgers A, Ni Mhurchu C, Clark T. 1999 World Health Organization-International Society of Hypertension Guidelines for the management of hypertension. Guidelines sub-committee of the World Health Organization. Clin Exp Hypertens. 1999; 21:1009-1060.
59. Whitworth JA; World Health Organization, International Society of Hypertension Writing Group. 2003 World Health Organization (WHO)/International Society of Hypertension (ISH) statement on management of hypertension. J Hypertens. 2003; 21:1983-1992.
60. Zhou BF; Cooperative Meta-Analysis Group of the Working Group on Obesity in China. Predictive values of body mass index and waist circumference for risk factors of certain related diseases in Chinese adults--study on optimal cut-off points of body mass index and waist circumference in Chinese adults. Biomed Environ Sci. 2002; 15:83-96.
61. Zhao S, Guo Y, Sheng Q, Shyr Y. Advanced heat map and clustering analysis using heatmap3. Biomed Res Int. 2014; 2014:986048.