
INTRODUCTION
Myelodysplastic syndromes (MDS) are a group of myeloid hematological malignancies, characterized by varying degrees of cytopenias and a high risk of progression to acute myeloid leukemia (AML) [1, 2]. Due to the conspicuous clinical and biological heterogeneity, an optimized treatment, based on accurate diagnosis and prognostic evaluation for individual patients, is particularly important [3]. The International Prognostic Scoring System (IPSS) and other models have been used for these purposes [3, 4], and the subsequent revision of the IPSS (IPSS-R) further improved the evaluation [5].
Recently, next-generation sequencing (NGS) has successfully been used to determine mutational profiles of different types of cancer, due to its massive parallel sequencing ability and high throughput multiplexing capacity [6]. Characterizing recurrent functional somatic mutations by targeted NGS aids in identifying disease-associated mutations, which is particularly relevant for clinical practice [7]. Currently, knowledge of the molecular pathogenesis of MDS has dramatically improved due to the identification of major mutational targets [8]. These mutations affect genes involved in DNA methylation (DNMT3A, TET2, IDH1/IDH2), chromatin modification (EZH2, ASXL1), transcription (RUNX1, GATA1/GATA2), RNA splicing (SF3B1, U2AF1, SRSF2 and ZRSR2) and signal transduction (JAK2, KRAS/NRAS, CBL) [9–17]. However, the list of gene mutations implicated in the pathogenesis of MDS is still growing [18–20]. Two large studies from the United Kingdom and Japan have discovered oncogenic mutations in 78% and 89.5% of patients with MDS using targeted sequencing and have developed novel prognostic models using molecular sequencing data [21, 22]. Other studies have suggested that the mutational status of multiple gene targets could better predict the clinical outcome of MDS [23, 24], implying that targeted sequencing could offer a cost-effective, front-line diagnostic tool for MDS. In line with this, the European Leukemia Network and a Clinical Advisory Committee have suggested that a conclusive diagnosis and a reliable prognostic evaluation should be performed based on the new development and discovery of gene mutations in MDS, which is being considered by the World Health Organization (WHO) for a revised classification of risk-groups for MDS [20, 25].
Therefore, we investigated the mutational signature of MDS in a Chinese patient-population using targeted NGS to detect whether there are different spectrums of genetic mutations. In addition, this study was aimed at indentifying the genetic differences and relationship between MDS and AML, and integrating the existing results on targeted mutations in MDS into a new gene panel with promising clinical applications.
RESULTS
Landscape of gene mutations
The sequencing depth ranged between 200× and 1897×, and the median depth was 861× (Supplementary Figure 1). The detailed NGS data generation of the 125 patients was in the Supplementary Table 1. In total, 1491 single-nucleotide variants (SNVs) and 701 small insertions and deletions were detected in the target regions, in 125 patients. We focused on the mutations with altered amino acids in coding regions. Steps were taken to remove germline and harmless mutations (Supplementary Methods). A landscape of gene aberrations was generated with respect to clinical information and mutations classified by functional categories (Figure 1a). Consequently, 308 mutations in 61 genes were discovered in 105 of 125 cases (84.0%) (Figure 1b, Supplementary Table 2). The average number of mutations per case was 2.46 (308/125), whereas the number in our previous AML study was 3.60 (342/95) [26]. This may indicate that more mutations are acquired during the translation from MDS to AML.
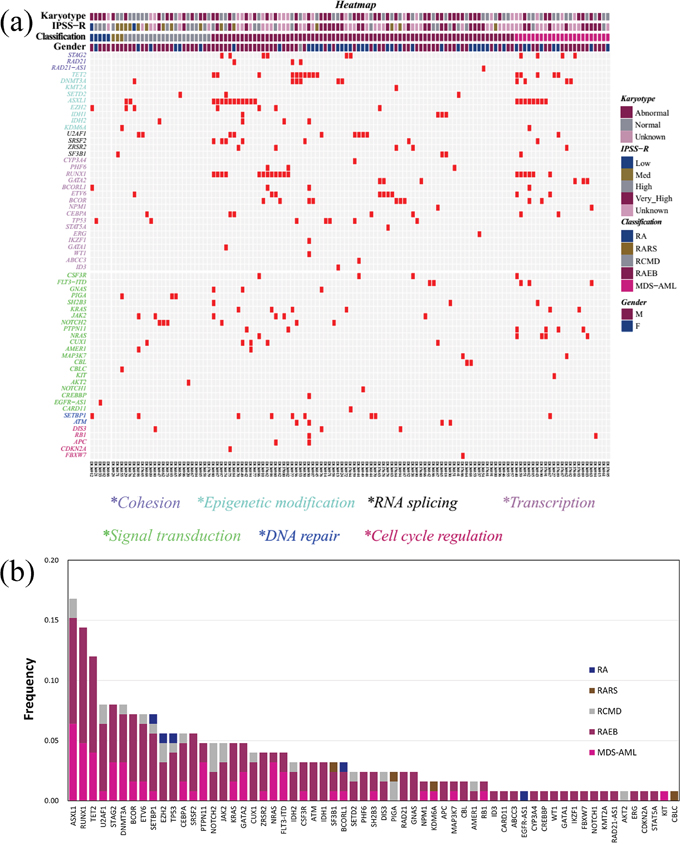
Figure 1: The genomic architecture of MDS. (a) Distribution of mutations in 125 MDS patients. Red boxes indicate mutations. (b) Frequencies of mutations identified in the cohort of 125 subjects, divided according to MDS subtype.
Patterns of genomic lesions
The mutation positions and types of a subset of the 61 genes were shown in Supplementary Figure 2. The base change data in the forward direction was collected for analyses. Nucleotide substitution was the main mutation type (67.9%, 209/308), and the proportions of transitions and transversions were 60.1% (126/209) and 39.7% (83/209), respectively, indicating a predominance of transitions. The respective proportions were 74.6% (167/224), 65.9% (110/167) and 34.1% (57/167) in our previous AML sequencing data [26], indicating a consistency in genomic lesions between MDS and AML (p = 0.094, p = 0.266, p = 0.266, respectively). Interestingly, the C→T transition was the most prevalent nucleotide substitution in MDS, with a significantly higher frequency than in AML (26.3% vs. 15.0%, p = 0.008), whereas the G→A transition was the most prevalent nucleotide substitution in AML with a significantly higher frequency than in MDS (33.7% vs. 22.5%, p = 0.001) [26]. These results suggest that the genomic lesion patterns identified in MDS and AML were both related and different.
Frequency and spectrum of gene mutations
The frequency of each detected gene abnormality is shown in Figure 1b. Of the 61 identified genes, 13 were mutated in more than 5% of MDS subjects. The frequency of mutations was highest in ASXL1 (16.8%), followed by RUNX1 (14.4%) and TET2 (12.0%). The overall distribution of mutations observed in the cohort was mirrored within the categories of MDS (Figure 1b). Mutations in genes other than PIGA, EGFR-AS1, AKT2 and CBLC, were largely distributed in subjects with refractory anemia with excess blasts (RAEB) (n = 56) or the AML with multilineage dysplasia following MDS (MDS-AML) (n = 24). Mutation frequencies of 2 (ASXL1 and TET2) of the top 3 genes with > 10% frequency in MDS (ASXL1, RUNX1 and TET2) were similar to those in AML [26]. For RUNX1, the mutation frequency was higher in MDS than in AML (18/125, 14.4% vs. 5/95, 5.3%). More genes with > 10% mutation frequency (including CEBPA, NPM1, DNMT3A, FLT3-ITD, NRAS, IDH2 and WT1) were found in AML compared to MDS. Specifically, the mutation frequencies of NPM1, FLT3-ITD, NRAS, IDH2 and WT1 were < 5% in MDS. The results suggest that there is consistency and heterogeneity in the spectrum of high-frequency mutated genes between MDS and AML.
Specificity of mutations in MDS
Compared with healthy donators, some gene aberrations were associated with MDS (Figure 2). Mutations in CEBPA and NRAS were typically found in patients with normal karyotypes, followed by mutations in DNMT3A. Abnormal cytogenetics were closely correlated with ATM mutations and only very slightly related to EZH2 mutations (Figure 2a). Notably, mutations in the transcription factor ETV6 were associated with both normal and abnormal karyotypes. Using the IPSS-R evaluation, a strong correlation was found between CEBPA mutations and low risk. Patients at high risk were weakly linked to EZH2 and RUNX1 mutations. However, patients at the very high risk presented with ATM mutations, followed by DNMT3A and NOTCH1 mutations (Figure 2b).
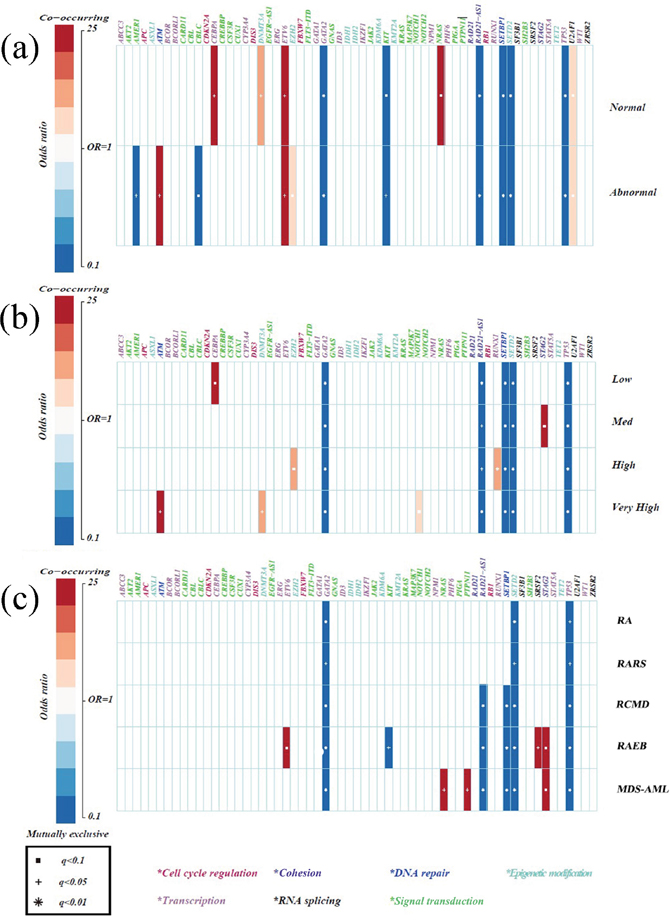
Figure 2: Specificity of mutations in MDS compared with healthy donators. (a) Correlations between gene mutations and chromosomes. (b) Correlations between gene mutations and IPSS-R risk stratifications. (c) Correlations between gene mutations and WHO classifications. Only those associations with a q value (false discovery rate adjusted p value) < 0.1 were shown. Associations are colored by odds ratio. Red colors label genes that were co-mutated in MDS more than expected, and blue colors label mutually exclusive gene mutations in MDS. Gene names are color coded by the different functional pathways below the figure. Due to a high SNP in healthy donators, the results of mutually exclusive genes had little meaning and the co-mutated genes were emphasized.
By analyzing MDS subtypes, we found the coexistence of signal pathway gene mutations (PTPN11 and NRAS) in MDS-AML patients, implying different functions of the same biological pathway genes in specific genomic contexts [21]. Furthermore, ETV6 and SRSF2 appeared to be more frequently mutated in RAEB, whereas STAG2 mutations frequently occurred in both RAEB and MDS-AML, suggesting consistency between the two subtypes (Figure 2c). Further analyses of the subgroups of IPSS-R and MDS subtypes demonstrated that STAG2 and RUNX1 mutations were indeed more frequent in cases at medium and high risk, respectively, while NRAS mutations were moderately associated with MDS-AML, meaning they could potentially have early diagnostic value for MDS-AML. Finally, TP53 and NOTCH1/NOTCH2 mutations more frequently appeared in complex karyotypes (p = 0.005, p = 0.001, respectively).
Subtypes and disease outcome correlate with the number of gene mutations
The average number of mutations per subtype was 1.0 (refractory anemia, RA, 5/5), 1.3 (refractory anemia with ring sideroblasts, RARS, 4/3), 1.14 (refractory anemia with multilineage dysplasia, RCMD, 24/21), 2.36 (RAEB, 172/73) and 2.70 (MDS-AML, 62/23) (p = 0.02). The median PFS was 96.00 (RCMD), 23.49 (RAEB) and 7.80 (MDS-AML) months (p < 0.01), with the 3-year PFS rates being 54.0 ± 11.3% (RCMD), 42.5 ± 7.5% (RAEB) and 1.5 ± 9.5% (MDS-AML) (p < 0.01), respectively. For this study, RA and RARS were not considered due to the limited number of cases. As shown in Figure 3a, a high proportion of patients from every MDS subtype, harbored only one gene mutation (30.4%, 38/125). Complex genetic abnormalities with ≥ 2 mutations were identified in 53.6% (67/125) of cases, most of which could be grouped in the subsets with progressive MDS (RAEB, 64.2%; MDS-AML, 23.9%).
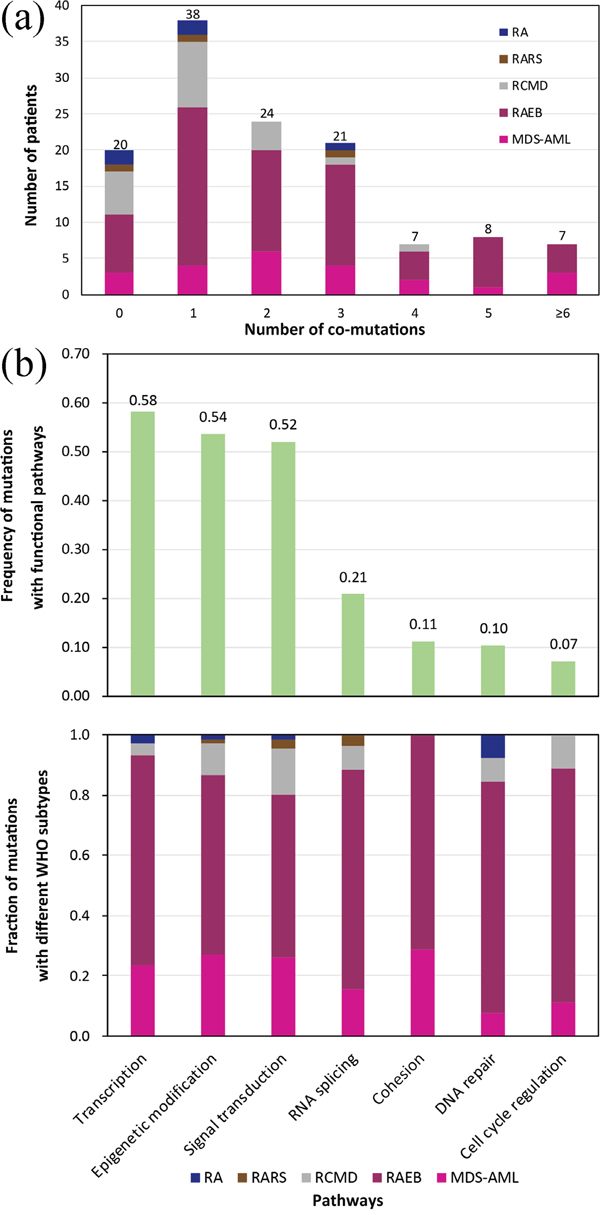
Figure 3: (a) Distribution of the number of co-occurring mutations (including point mutations and indels) relative to MDS subtypes. (b) The number of mutations involved in common functional pathways classified according to different WHO subtypes.
Gene mutations involved in common functional pathways
Considering the targeted sequencing and prognostic discrepancies among various subtypes of MDS, we further analyzed the mutation frequencies in 7 common functional pathways hypothesized to be characteristic for MDS pathogenesis (Figure 3b, Supplementary Table 3). We found that the most frequently mutated pathway was transcription, with mutations identified in 58.4% of patients, followed by epigenetic modification (53.6%), signal transduction (52.0%), RNA splicing (20.8%), cohesion (11.2%), DNA repair (10.4%) and cell cycle regulation (7.2%).
Notably, only mutations affecting epigenetic modification and signal transduction occurred in each MDS subtype. Mutations affecting cohesion only appeared in RAEB and MDS-AML, but not in RCMD. The most common mutations in RCMD were those involved in signal transduction (41.7%), but decreased significantly in RAEB (20.3%) (p = 0.02). Moreover, mutations in transcription increased from 12.5% in RCMD to a maximum of 29.7% in RAEB (p = 0.078). When comparing RAEB with MDS-AML, there was no significant difference in the ratios of mutations in each functional pathway (p > 0.1). Additionally, RAEB had a higher ratio in every subtype of identified mutations compared to MDS-AML (Figure 3b).
To explore the genetic correlation between progressive MDS (including RAEB and MDS-AML) and AML, the frequencies of different mutations between the two hematologic malignancies were compared using results from this and our previous study [26]. We found that the most common mutations in AML occurred in the transcription pathway and that these were significantly more abundant than in progressive MDS (p = 0.02). On the contrary, mutations in the DNA repair and cell cycle regulation pathways were commonly found in MDS but not in the AML cohort. The percentages of mutations in genes involved in epigenetic modification, signal transduction, RNA splicing and cohesion were similar between MDS and AML (p > 0.05).
Clinical features of patients with mutations in DNA methylation
Considering that mutations in genes related to DNA methylation (TET2, DNMT3A and IDH1/IDH2) were amongst the top 10 mutations identified in progressive MDS and that hypomethylation agents (HMAs) are widely used in treating MDS, we analyzed the clinical features of the patients harboring these mutations. Of the 108 cases with follow-up data, 23 carried 26 mutations in TET2, DNMT3A and/or IDH1/IDH2. Except for TET2/DNMT3A co-mutations in two cases and a TET2/IDH2 co-mutation in one case, all other cases carried mutations in only one of these. Compared to the 85 cases without mutations on DNA methylation, the 23 patients with mutations were older and had progressive diseases, more complex karyotypes and ≥ 2 mutations (age ≥ 60 years: 65.2% vs. 25.9%, p = 0.000; RAEB&MDS-AML: 91.3% vs. 68.2%, p = 0.027; complex karyotypes: 26.3% vs. 8.1%, p = 0.028; ≥ 2 mutations: 87.0% vs. 43.5%, p = 0.000). However, there was no significant difference in OS and PFS between these two groups (p = 0.078 and p = 0.205, respectively), which might be related to the fact that more patients with mutations in DNA methylation received treatment with HMAs (65.2% vs. 31.8%, p = 0.004).
Prognostic significance of the gene mutations
Follow-up data were available for 108 patients (Table 1). To assess the prognostic significance of identified mutations, we focused on 22 genes with ≥ 5% mutation frequency (ASXL1, RUNX1, TET2, U2AF1, STAG2, DNMT3A, ETV6, SETBP1, EZH2, TP53, CEBPA, SRSF2, BCOR/BCORL1, KRAS/NRAS, GATA1/GATA2, NOTCH1/NOTCH2 and IDH1/IDH2) and considered factors including: age (< 60 yr vs. ≥ 60 yr), WHO classifications (progressive MDS vs. non-progressive MDS), treatment strategy (HSCT vs. non-HSCT) as well as IPSS-R and IPSS-R-M (molecular maker).
Table 1: Baseline characteristics of patients (N = 125)
Demographics |
N = 125 |
|---|---|
Gender |
|
Male |
83 (66%) |
Female |
42 (34%) |
Age |
|
< 60 |
83 (66%) |
≥ 60 |
42 (34%) |
MDS classification (WHO 2008) |
N = 125 |
RA |
5 (4%) |
RARS |
3 (2%) |
RCMD |
21 (17%) |
RAEB1 |
21 (17%) |
RAEB2 |
51 (41%) |
MDS-AML# |
24 (19%) |
Cases with follow-up |
N = 108 |
Median follow-up (OS/PFS) |
18 Months/13 Months |
3-year Cumulative OS |
62.4 ± 5.6% |
3-year Cumulative PFS |
51.1 ± 5.5% |
Median OS |
/ |
Median PFS |
41 Months |
Blood counts at diagnosis |
N = 108 |
Hemoglobin level |
77.8 ± 20.8 g/L |
Neutrophil count* |
0.5 (0.3, 0.8) × 109/L |
Platelet count* |
57.0 (21.0, 93.0) × 109/L |
Marrow blast (%) |
N = 108 |
≤ 2 |
3 (3%) |
> 2 and <5 |
26 (24%) |
≥ 5 and ≤10 |
24 (22%) |
> 10 |
55 (51%) |
Cytogenetics |
N = 108 |
Normal |
43 (40%) |
Abnormal |
50 (46%) |
Failed/not done |
15 (14%) |
IPSS-R risk group |
N = 108 |
Very low |
0 (0%) |
Low |
2 (2%) |
Intermediate |
15 (14%) |
High |
24 (22%) |
Very high |
35 (32%) |
Unknown |
32 (30%) |
Therapy strategy |
N = 108 |
Supportive |
27 (25%) |
HMAs |
42 (39%) |
HSCT without HMAs pre-treatment |
32 (30%) |
HSCT bridged by HMAs pre-treatment |
7 (6%) |
# Patients had ≥ 20% blasts with a history of MDS, which is classified as AML with multilineage dysplasia following MDS according to the 2008 WHO classification.
* median (P25, P75)
Based on univariate analyses, the age of ≥ 60 years was unfavorable for both OS and PFS. Patients without HSCT treatment had worse OS and those with progressive MDS had shorter PFS (p < 0.05) (Table 1). Mutations (Figure 4) in GATA1/GATA2, DNMT3A and TP53 negatively affected OS (p < 0.05), while mutations in RUNX1, KRAS/NRAS, SRSF2 and TET2 were associated with shorter PFS (p < 0.05). PFS also tended to be shorter in patients with complex genetic abnormalities harboring ≥ 2 mutations (p = 0.189).
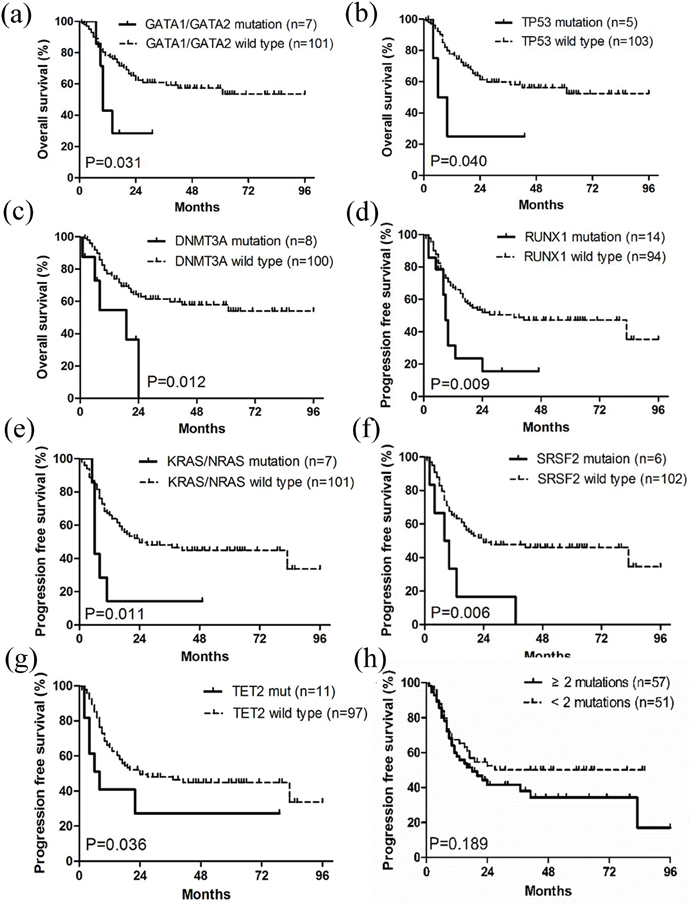
Figure 4: Kaplan-Meier curves of overall survival (OS) and progression free survival PFS. (a-c) Patients with GATA1/GATA2, TP53 and DNMT3A mutations had worse OS than wild type groups. (d-g) Patients with RUNX1, KRAS/NRAS, SRSF2 and TET2 mutations had worse PFS than wild type groups. (h) Patients with ≥ 2 mutations tended to have shorter PFS than those with < 2 mutations. OS and PFS were stratified by univariate prognostic factors. P values were calculated using the log-rank test.
Multivariate COX regression analyses, displayed in Table 2, indicated that the age of ≥ 60 years was an independent factor for both poor OS and PFS (p < 0.05). Progressive MDS, based on WHO-classification, unfavorably affected PFS independently (p < 0.05). Mutations in KRAS/NRAS, GATA1/GATA2 and DNMT3A independently contributed to poor OS, whereas IDH1/IDH2 mutations were associated with a relatively higher PFS. Lastly, complex genetic abnormalities with ≥ 2 mutations were an ominous sign for PFS (p < 0.05).
Table 2: Univariate and multivariate analyses for OS and PFS
N=108 |
Univariate |
Multivariate* |
||
|---|---|---|---|---|
OS (HR, 95%CI) |
PFS (HR, 95%CI) |
OS (HR, 95%CI) |
PFS (HR, 95%CI) |
|
Age (≥ 60 vs. < 60 year) |
2.456 (1.340-4.504) |
1.846 (1.094-3.115) |
2.230 (1.192-4.170) |
2.278 (1.320-3.931) |
HSCT vs. non-HSCT |
1.993 (1.021-3.888) |
- - |
- - |
- - |
Progressive MDS vs. non-progressive MDS) |
- - |
2.190 (1.127-4.258) |
- - |
1.819 (1.418-2.332) |
GATA1/GATA2 mutation |
2.703 (1.048-6.970) |
- - |
3.714 (1.341-10.287) |
- - |
TP53 mutation |
3.160 (1.117-59.320) |
- - |
- - |
- - |
DNMT3A mutation |
3.106 (1.211-7.971) |
- - |
2.842 (1.070-7.547) |
- - |
RUNX1 mutation |
- - |
2.208 (1.136-4.293) |
- - |
- - |
KRAS/NRAS mutation |
- - |
2.678 (1.137-6.307) |
3.525 (1.288-9.650) |
- - |
SRSF2 mutation |
- - |
2.870 (1.225-6.722) |
- - |
- - |
TET2 mutation |
- - |
2.248 (1.103-10.060) |
- - |
- - |
IDH1/IDH2 mutation |
- - |
- - |
- - |
0.273 (0.081-0.919) |
≥ 2 mutations vs. <2 mutations |
- - |
- - |
- - |
3.364 (1.428-7.925) |
*Multiple variables were selected for the Cox proportional hazard model: age (≥ 60 vs. < 60 year), white blood cell count, platelet count, hemoglobin, bone marrow blast, IPSS-R, administered treatment therapy (HSCT vs. non-HSCT), diagnosis (progressive MDS vs. non-progressive MDS) and mutations (including mutations with frequency ≥ 5% and those involved in epigenetic modification: RUNX1, BCOR/BCORL1, U2AF1, KRAS/NRAS, GATA1/GATA2, ETV6, NOTCH1/NOTCH2, STAG2, SETBP1, SRSF2, TP53, CEBPA, ASXL1, TET2, DNMT3A, IDH1/IDH2, EZH2, SETD2, KDM6A, KMT2A. And when analyzing “ ≥ 2 mutations vs. <2 mutations”, the mutation variables were removed.
Abbreviations: OS, overall survival; PFS, progression-free survival.
The 76 patients with IPSS-R information could be classified into 4 subgroups (low risk, intermediate risk, high risk, and very high risk), with no significant difference in survival, especially between the intermediate and high-risk subgroups (Figure 5a, 5b). The fraction of patients with MDS-related genetic lesions increased to 92.0% when sequencing data of gene mutations (84.0%) were combined with cytogenetics (42.4%), suggesting that molecular markers could be more common. Therefore, we used the integration of molecular marker-based system and IPSS-R to form the new IPSS-R-M system recently proposed by Chen’s group to optimize the prognostic stratification [27]. Based on the IPSS-R-M model, our patients were more accurately classified into 3 prognostic subgroups and the new prognosis data were consistent with previous reports (Figure 5c, 5d) [21, 22].
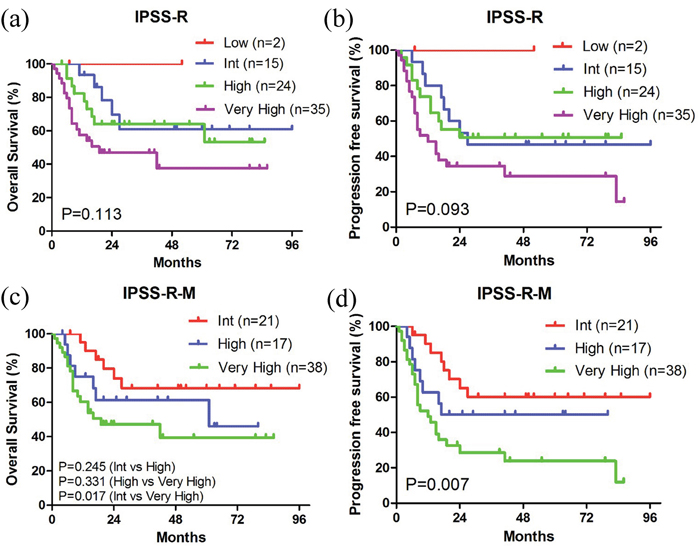
Figure 5: Kaplan-Meier curves of survival according to the IPSS-R and IPSS-R-M systems. (a, c) Kaplan-Meier curves of OS. (b, d) Kaplan-Meier curves of PFS.
A candidate target gene panel for MDS patients
Based on the analysis of the targeted sequencing data of MDS, 17 candidate genes (DNMT3A, GATA1, GATA2, TP53, RUNX1, KRAS, NRAS, SRSF2, TET2, IDH1, IDH2, ETV6, EZH2, BCOR, PTPN11, STAG2, U2AF1) were identified. These genes have the following characteristics: high frequency, disease specificity, prognostic value and are associated with progressive disease. Combined with a comprehensive literature research for recurrent gene abnormalities in MDS [20-22, 27], especially for genes associated with prognosis, we generated a final candidate panel comprsing 11 genes (EZH2, TET2, ASXL1, TP53, DNMT3A, RUNX1, ETV6, SRSF2, U2AF1, IDH1, IDH2) for targeted sequencing in MDS. This 11-gene IPSS-R-M model was preliminarily evaluated on the currently available 76 patients (Supplementary Table 4-5), and our patients were also accurately classified into 3 prognostic subgroups as the same as those of the Chen’s IPSS-M gene panel [27] (Supplementary Figure 3).
DISCUSSION
In this study, high-throughput deep sequencing of 111 target genes in 125 MDS patients in combination with clinical phenotype analyses identified a comprehensive landscape of genetic lesions in MDS in the Chinese population. Differential mutations were identified in different karyotypes of the MDS patients. Specific gene lesions were also identified in the MDS subgroups defined by the IPSS-R and WHO classifications, highlighting the diagnostic value of these genetic changes. Different pathway mutations could be associated with progression of MDS. Combining with our previous targeted sequencing data in AML, we found that similar genomic signatures might exist between RAEB/MDS-AML and AML, supporting the hypothesis that the two diseases might share common etiologic factors and be affected by similar DNA impairments. The multivariate COX regression analyses revealed that mutation burdens are related to poor survival, supported by the fact that patients with ≥ 2 mutation had shorter PFS. Mutations in GATA1/GATA2, DNMT3A and KRAS/NRAS were also associated with shorter OS. Based on the IPSS-R-M system, these MDS patients could be further stratified. Finally, with a comprehensive analysis and preliminary validation, a new panel of 11 genes was recommended for targeted sequencing in MDS.
Compared with previous studies, several parallels and differences in genomic variants, population coverage and lesions could be observed. The number of identified SNVs and indels were similar between our data (2192 from 61 genes), Haferlach’s and Papaemmanuil’s large scale studies (2764 from 96 genes; 2260 from 43 genes) [21, 22]. Furthermore, this study revealed similar mutational population coverage (84.0%, 105/125) to Haferlach’s study (89.5%, 845/944, p = 0.066) [22], but notably exceeded that in Papaemmanuil’s data (74.4%, 549/738, p = 0.020) [21].
The spectrum of frequent mutations in this study is similar to that reported in large MDS populations [8, 21, 22]. ASXL1, RUNX1 and TET2 with mutation frequency >10% in this study were also mutated >10% in studies by Haferlach et al. [22] and Bejar et al. [8], while Papaemmanuil et al. only for ASXL1 and TET2 mutation [21]. However, mutation frequency differences could also be observed, possibly because there were more patients with progressive MDS (RAEB, 58%; MDS-AML, 19%) in this study than in the other studies (i.e. Papaemmanuil’s: RAEB, 23%; MDS-AML, 5% [21]), and many mutations have various tendency to different MDS subtypes. For example, due to RUNX1 mutations being associated with an increased risk of progression to AML [8], a higher frequency of this mutation could be observed in our study than in Papaemmanuil’s study (14.4% vs. ~7%) [21]. Moreover, RNA splicing factor mutations (SRSF2 5.6%, U2AF1 8.0%, SF3B1 3.2%, ZRSR2 4.0%) were less in our data compared to Haferlach’s study (SRSF2 17.6%, U2AF1 7.7%, SF3B1 32.9%, ZRSR2 7.9%) [22], possibly because of differences in the study cohorts.
The relationships between different mutations and karyotypes or IPSS-R or WHO subtypes were interesting when comparing the MDS patients with healthy donators, which has not previously been studied. For example, although mutations in the DNA methylation gene DNMT3A were associated with normal karyotype, they were strongly correlated with very high risk subgroup and poor OS [28]. NRAS mutations were also prone to normal cytogenetics and were significantly more frequent in MDS-AML, implying they might increase the risk of leukemic transformation in cytogenetically normal MDS [20] and have diagnostic value for MDS-AML. ETV6 mutations cause loss of function, thereby resulting in incapability of transcription repression [20] and exhibited dominant negative effects on survival [23], regardless of the normalcy of karyotypes in our study. Results also indicated that RUNX1 mutations are more common in high-risk MDS patients with short survival, which was consistent with previous findings [29]. In contrast, although in our cohort EZH2 mutations were more common in high-risk patients and had no prognostic value, a previous study identified a group of lower-risk MDS patients with EZH2 mutations and worse-than-expected prognosis [24]. Mutations in the splicing factor gene SRSF2 were notably rich in RAEB in our study and might negatively affect prognosis based on previous studies [30], different from a report of favorable prognosis by Bejar et al. [24]. The discrepancies above might result from diversities of the study populations, sequencing methods and scopes of target gene among these studies. Nevertheless, these differences should inspire more exploration using systems suitable for varying cohorts with consistent methodology and clinically significant genes. We proposed a panel of 11 genes for targeted sequencing as a step to address this problem. Future comprehensive studies are warranted to validate this panel.
Patterns of genomic lesions are considered as genomic signatures in cancer [31, 32]. In this study, we found that nucleotide substitutions were the main type of mutations with transitions being the dominant form. The most prevalent changes were C→T transitions, followed by G→A/A→G/T→C transitions, which was similar to the pattern seen in MDS and AML in previous exome sequencing/whole-genome sequencing studies [14, 27, 33, 34]. These results confirmed that the pattern of genomic lesions was a signature of MDS, regardless of the sequencing method, and that there is a close relationship between MDS and AML in terms of pathogenesis [19].
To explore the molecular pathogenesis of MDS progression [20, 35], the target genes were grouped into 7 functional pathways, as previously reported [22]. The three most frequently mutated pathways were transcription (58.4%), epigenetic modification (53.6%) and signal transduction (52.0%). However, a higher mutation frequency in RNA splicing (64%) and lower frequencies in transcription (28%) and signal transduction (15%) were observed in Haferlach’s data [22]. Additionally, mutated genes in the epigenetic modification and signal transduction pathways appeared in each subtype of MDS, consistent with common molecular mechanisms of MDS reported in several studies [20]. DNA methylation-related mutations occurred early in disease evolution and could trigger MDS through cooperation with other mutations frequently found in hematologic malignancies [10, 20]. Mutations in genes involved in signal transduction were often associated with the pathogenesis of MDS and contributed to the progression of MDS [20, 36]. Furthermore, signal transduction was the most commonly mutated pathway in RCMD but rarely mutated in RAEB (p = 0.02), whereas mutations in transcription reached a maximum ratio in RAEB and also accounted for a large proportion in MDS-AML. Mutations affecting the cohesion pathway were only found in RAEB and MDS-AML. All these changes might underlie the evolution from non-progressive MDS to progressive MDS. Finally, RAEB and MDS-AML had fairly similar mutational profiles, implying a mechanism correlation between the two diseases [37].
The molecular mechanisms of progressive MDS and de novo AML require joint actions of factors involved in epigenetic modification, signal transduction, RNA splicing and cohesion pathways [10, 27], the absence of mutations in DNA repair and cell cycle regulation as well as the increase of transcription-related mutations (other than those in NPM1 and WT1), which might indicate a progressive expansion capacity of abnormal clones in de novo AML [27]. In particular, this notion is consistent with previous results which have shown that NPM1 is rarely mutated in MDS [27, 35]. Hence, the molecular discrepancies used for distinguishing progressive MDS and de novo AML might be found in the functional pathways affected by genetic lesions, which could possibly aid in identifying patients with progressive disease before symptoms associated with higher-risk disease are manifested.
DNA methylation might play an important role in the pathogenesis of MDS. In parallel, MDS patients appear to benefit from treatments with HMAs [38–40]. However, it remains unclear how mutations in DNA methylation can be utilized to predict benefits of HMAs [41]. We found that patients with mutations in DNA methylation carried more unfavorable features. However, the OS and PFS of these patients were not significantly different from those without mutations in DNA methylation. We noted that more patients in the former group were treated with HMAs, which could have improved the situations in this group, and might, therefore, explain the similar OS and PFS aforementioned [39, 42, 43]. Nevertheless, further study is warranted to clarify the use of mutational information in DNA methylation as a reference for HMAs treatment.
Previous analyses of survival suggested that heavier mutational burdens might be associated with poorer prognosis [21]. We found that RAEB patients had a considerably higher average number of mutations compared to RCMD patients. Accordingly RAEB patients had reduced PFS (p < 0.05). In addition, the average number of mutations in MDS-AML was the highest in our study and these patients had the lowest survival (p < 0.05). We also found that patients with ≥ 2 co-occurring mutations had significantly shorter PFS than those with <2 mutations (HR, 3.364; 95%CI, 1.428-7.925). The correlation between mutational burdens in MDS subtypes and survival was also consistent with Chen’s findings [27].
In our COX regression analysis, mutations in GATA1/GATA2, DNMT3A and KRAS/NRAS were related to shorter OS (p < 0.05), consistent with previous studies [9, 20], Interestingly, patients harboring IDH1/IDH2 mutations had prolonged PFS (p < 0.05). Previous studies had controversial findings about how IDH1/IDH2 mutations affected the prognosis of MDS patients [23, 44]. A recent meta-analysis including 1782 patients showed poor survival in patients with mutant IDH1/IDH2 [45]. It is worth noting that our results were limited by the small sample size, probably explaining the discrepancies between our findings and certain previous studies [21, 22]. Based on the novel IPSS-R-M system derived from Chen’s study [27], our patients were further stratified into higher and lower risk groups, which could potentially be used to predict prognosis of MDS patients more accurately, identify disease progression and guide refined therapeutic strategies. Compared to Chen’s gene panel (21-gene panel) [27], although the 11-gene panel only included half the number of the genes, it exhibited equal prognostic value with the same reasonable classification (Figure 5, Supplementary Figure 3). This panel remains to be validated in large-scale patient studies and could be useful in clinical application.
In conclusion, we performed NGS to screen 111 genes in 125 patients with MDS, analyzed the mutational profiles and prognosis of these patients and compared our findings with previous studies. Our study provides new insights into the underlying genetic mechanisms of Chinese MDS patients. We proposed a panel of 11 genes that might be used for the genetic profiling of MDS and guide the development of individualized therapies. This panel remains to be validated in future larger-scale studies.
MATERIALS AND METHODS
Ethics statement
The study protocol was approved by the Ethics Committee of the General Hospital of Chinese People’s Liberation Army, and was conducted in accordance with the Declaration of Helsinki. Written informed consents were obtained from all participants and/or their legal guardian.
Patients
A total of 125 newly diagnosed MDS patients and 81 healthy volunteers who visited our Hematology Department and Bone Transplantation Center between August 2008 and September 2014 were enrolled in the study (Table 1). 5 ml EDTA-anticoagulated bone marrow samples from MDS patients or peripheral blood samples from healthy volunteers were collected. Genomic DNAs were extractedusing a DNA Purification Kit (Promega, USA). The charts, electronic medical records and laboratory records were reviewed by two trained hematologists. Data on demographic characteristics, diagnosis and treatment of MDS, survival status, etc. were collected and recorded in the case report form. Finally, all the data were put into an Excel database and further evaluated by a third trained hematologist.
The diagnosis and classification of MDS were based on the WHO 2008 classification, and MDS-AML was defined as AML with multilineage dysplasia following MDS [46]. Of the 125 patients, 42 were women and 83 were men. The median age was 49 years (range, 14-82 years). Refractory anemia with excess blasts (RAEB) was the main subtype (58%, 72/125) and 24 cases (19%) progressed to MDS-AML. From the 108 patients with available outcome data, 50 (46%) had abnormal cytogenetics and 74 (69%) cases were in the intermediate or above risk group. The median follow-up was 18 months for OS and 13 months for PFS (Table 1).
Targeted-sequencing and study controls
The sequencing panel targets ~250 kb genomic content that covers the entire coding sequences of 111 genes relevant to the pathogenesis of MDS. In this panel, 42 genes originated from the hematopoietic diagnosis and treatment guidelines published by the National Comprehensive Cancer Network (NCCN) and WHO, and 69 genes were selected based on a literature search for recurrent gene abnormalities in MDS (Supplementary Table 6).
Genomic DNA extracted from bone marrow (MDS patients, n = 125) or peripheral blood (healthy volunteers, n = 81) was examined for mutations in 111 known genes by targeted sequencing. Germline DNAs were not available. In our previous report [26], the reliability of healthy adults as controls has been proved compared to the patients’ matched saliva controls. Therefore, 81 healthy volunteers (females and males: 42 and 39, respectively; median age: 29 years, range 23-56 years) were used as controls to remove germline and harmless mutations. If a mutation occurred in at least 1 of the 81 healthy individuals, it would be removed (details in Supplementary Method).
NimbelGenSeqCap EZ Choice was used according to the manufacturer’s protocol with modifications. Multiplexed libraries were sequenced using 100-bp paired-end runs on an Illumina HiSeq 2500. Reads were aligned using the Burrows-Wheeler alignment (BWA) tool to human genomic reference sequences (HG19, NCBI built 37) [47]. To identify single nucleotide polymorphisms (SNPs) and short insertions and deletions (INDELs), MuTect2 with recommended parameters was performed [48]. All mutations were annotated by the ANNOVAR software using some resources (details in Supplementary Method) [49]. A subset of somatic mutations was randomly selected for validation using Sanger sequencing (Supplementary Table 7). Cell line dilution was prepared for evaluation of sensitivity and specificity (details in Supplementary Method, Supplementary Table 8, Supplementary Figure 4).
Statistical analyses
The demographics and characteristics were summarized using descriptive statistics. Student’s t test or Mann-Whitney U-test were used to compare the differences in continuous variables. Analysis of frequencies was performed using the Fisher’s exact test or Pearson’s χ2 test. Survival analysis was performed by Kaplan-Meier method and a Cox proportional hazard model was used to assess the prognostic significance of the clinical variables. OS was defined as the time from diagnosis to death from any cause since last follow-up. PFS was defined as the time from diagnosis to progression (the classification of MDS at diagnosis progressing to the next stage, i.e. RCMD to RAEB1, or AML or death from any cause), or last follow-up. A two-sided p-value < 0.05 was considered statistically significant. All statistical analyses were performed with the SPSS software version 19.0 (IBM Corp., Armonk, NY, USA).
Author contributions
YYX and LY designed the research. YYX, YL, CJC and LY performed the research. YYX, YL and QYX performed the statistical analysis and drafted the manuscript. YLC, JG and XLW analyzed or interpreted the data. NL, YHL and LY critically revised the manuscript. YJ, LPD, JB and LLW provided valuable advice and also revised the manuscript. All authors have read and approved the final manuscript.
CONFLICTS OF INTEREST
The authors declare there is no conflicts of interests.
FUNDING
This work was supported by the National Natural Science Foundation of China (8167016, 81370635, 81170518, 81270611, 81570137, 81470010 and 81400135), Capital Medical Development Scientific Research Fund (SF2001-5001-07), Beijing Natural Science Foundation (7151009), National Public Health Grant Research Foundation (No.201202017) and The capital of the public health project (Z111107067311070). The funders had no role in study design, data collection and analysis, decision to publish, or preparation of the manuscript.
REFERENCES
1. Tefferi A, Vardiman JW. Myelodysplastic syndromes. N Engl J Med. 2009; 361:1872-85. https://doi.org/10.1056/NEJMra0902908.
2. Arber DA, Orazi A, Hasserjian R, Thiele J, Borowitz MJ, Le Beau MM, Bloomfield CD, Cazzola M, Vardiman JW. The 2016 revision to the World Health Organization classification of myeloid neoplasms and acute leukemia. Blood. 2016; 127:2391-405. https://doi.org/10.1182/blood-2016-03-643544.
3. Cazzola M, Della Porta MG, Travaglino E, Malcovati L. Classification and prognostic evaluation of myelodysplastic syndromes. Semin Oncol. 2011; 38:627-34. https://doi.org/10.1053/j.seminoncol.2011.04.007.
4. Greenberg P, Cox C, LeBeau MM, Fenaux P, Morel P, Sanz G, Sanz M, Vallespi T, Hamblin T, Oscier D, Ohyashiki K, Toyama K, Aul C, et al. International scoring system for evaluating prognosis in myelodysplastic syndromes. Blood. 1997; 89:2079-88.
5. Miyazaki Y. [Revised international prognostic scoring system (IPSS-R) for myelodysplastic syndromes]. Rinsho Ketsueki. 2013; 54:545-51.
6. Kohlmann A, Grossmann V, Nadarajah N, Haferlach T. Next-generation sequencing - feasibility and practicality in haematology. Br J Haematol. 2013; 160:736-53. https://doi.org/10.1111/bjh.12194.
7. Garraway LA. Genomics-driven oncology: framework for an emerging paradigm. J Clin Oncol. 2013; 31:1806-14. https://doi.org/10.1200/JCO.2012.46.8934.
8. Bejar R, Levine R, Ebert BL. Unraveling the molecular pathophysiology of myelodysplastic syndromes. J Clin Oncol. 2011; 29:504-15. https://doi.org/10.1200/JCO.2010.31.1175.
9. Walter MJ, Ding L, Shen D, Shao J, Grillot M, McLellan M, Fulton R, Schmidt H, Kalicki-Veizer J, O'Laughlin M, Kandoth C, Baty J, Westervelt P, et al. Recurrent DNMT3A mutations in patients with myelodysplastic syndromes. Leukemia. 2011; 25:1153-8. https://doi.org/10.1038/leu.2011.44.
10. Langemeijer SM, Kuiper RP, Berends M, Knops R, Aslanyan MG, Massop M, Stevens-Linders E, van Hoogen P, van Kessel AG, Raymakers RA, Kamping EJ, Verhoef GE, Verburgh E, et al. Acquired mutations in TET2 are common in myelodysplastic syndromes. Nat Genet. 2009; 41:838-42. https://doi.org/10.1038/ng.391.
11. Kosmider O, Gelsi-Boyer V, Slama L, Dreyfus F, Beyne-Rauzy O, Quesnel B, Hunault-Berger M, Slama B, Vey N, Lacombe C, Solary E, Birnbaum D, Bernard OA, et al. Mutations of IDH1 and IDH2 genes in early and accelerated phases of myelodysplastic syndromes and MDS/myeloproliferative neoplasms. Leukemia. 2010; 24:1094-6. https://doi.org/10.1038/leu.2010.52.
12. Nikoloski G, Langemeijer SM, Kuiper RP, Knops R, Massop M, Tonnissen ER, van der Heijden A, Scheele TN, Vandenberghe P, de Witte T, van der Reijden BA, Jansen JH. Somatic mutations of the histone methyltransferase gene EZH2 in myelodysplastic syndromes. Nat Genet. 2010; 42:665-7. https://doi.org/10.1038/ng.620.
13. Gelsi-Boyer V, Trouplin V, Adelaide J, Bonansea J, Cervera N, Carbuccia N, Lagarde A, Prebet T, Nezri M, Sainty D, Olschwang S, Xerri L, Chaffanet M, et al. Mutations of polycomb-associated gene ASXL1 in myelodysplastic syndromes and chronic myelomonocytic leukaemia. Br J Haematol. 2009; 145:788-800. https://doi.org/10.1111/j.1365-2141.2009.07697.x.
14. Papaemmanuil E, Cazzola M, Boultwood J, Malcovati L, Vyas P, Bowen D, Pellagatti A, Wainscoat JS, Hellstrom-Lindberg E, Gambacorti-Passerini C, Godfrey AL, Rapado I, Cvejic A, et al. Somatic SF3B1 mutation in myelodysplasia with ring sideroblasts. N Engl J Med. 2011; 365:1384-95. https://doi.org/10.1056/NEJMoa1103283.
15. Graubert TA, Shen D, Ding L, Okeyo-Owuor T, Lunn CL, Shao J, Krysiak K, Harris CC, Koboldt DC, Larson DE, McLellan MD, Dooling DJ, Abbott RM, et al. Recurrent mutations in the U2AF1 splicing factor in myelodysplastic syndromes. Nat Genet. 2012; 44:53-7. https://doi.org/10.1038/ng.1031.
16. Levine RL, Loriaux M, Huntly BJ, Loh ML, Beran M, Stoffregen E, Berger R, Clark JJ, Willis SG, Nguyen KT, Flores NJ, Estey E, Gattermann N, et al. The JAK2V617F activating mutation occurs in chronic myelomonocytic leukemia and acute myeloid leukemia, but not in acute lymphoblastic leukemia or chronic lymphocytic leukemia. Blood. 2005; 106:3377-9. https://doi.org/10.1182/blood-2005-05-1898.
17. Grand FH, Hidalgo-Curtis CE, Ernst T, Zoi K, Zoi C, McGuire C, Kreil S, Jones A, Score J, Metzgeroth G, Oscier D, Hall A, Brandts C, et al. Frequent CBL mutations associated with 11q acquired uniparental disomy in myeloproliferative neoplasms. Blood. 2009; 113:6182-92. https://doi.org/10.1182/blood-2008-12-194548.
18. Walter MJ, Shen D, Shao J, Ding L, White BS, Kandoth C, Miller CA, Niu B, McLellan MD, Dees ND, Fulton R, Elliot K, Heath S, et al. Clonal diversity of recurrently mutated genes in myelodysplastic syndromes. Leukemia. 2013; 27:1275-82. https://doi.org/10.1038/leu.2013.58.
19. Walter MJ, Shen D, Ding L, Shao J, Koboldt DC, Chen K, Larson DE, McLellan MD, Dooling D, Abbott R, Fulton R, Magrini V, Schmidt H, et al. Clonal architecture of secondary acute myeloid leukemia. N Engl J Med. 2012; 366:1090-8. https://doi.org/10.1056/NEJMoa1106968.
20. Ganguly BB, Kadam NN. Mutations of myelodysplastic syndromes (MDS): An update. Mutat Res Rev Mutat Res. 2016; 769:47-62. https://doi.org/10.1016/j.mrrev.2016.04.009.
21. Papaemmanuil E, Gerstung M, Malcovati L, Tauro S, Gundem G, Van Loo P, Yoon CJ, Ellis P, Wedge DC, Pellagatti A, Shlien A, Groves MJ, Forbes SA, et al. Clinical and biological implications of driver mutations in myelodysplastic syndromes. Blood. 2013; 122:3616-27; quiz 99. https://doi.org/10.1182/blood-2013-08-518886.
22. Haferlach T, Nagata Y, Grossmann V, Okuno Y, Bacher U, Nagae G, Schnittger S, Sanada M, Kon A, Alpermann T, Yoshida K, Roller A, Nadarajah N, et al. Landscape of genetic lesions in 944 patients with myelodysplastic syndromes. Leukemia. 2014; 28:241-7. https://doi.org/10.1038/leu.2013.336.
23. Bejar R, Stevenson K, Abdel-Wahab O, Galili N, Nilsson B, Garcia-Manero G, Kantarjian H, Raza A, Levine RL, Neuberg D, Ebert BL. Clinical effect of point mutations in myelodysplastic syndromes. N Engl J Med. 2011; 364:2496-506. https://doi.org/10.1056/NEJMoa1013343.
24. Bejar R, Stevenson KE, Caughey BA, Abdel-Wahab O, Steensma DP, Galili N, Raza A, Kantarjian H, Levine RL, Neuberg D, Garcia-Manero G, Ebert BL. Validation of a prognostic model and the impact of mutations in patients with lower-risk myelodysplastic syndromes. J Clin Oncol. 2012; 30:3376-82. https://doi.org/10.1200/JCO.2011.40.7379.
25. Malcovati L, Hellstrom-Lindberg E, Bowen D, Ades L, Cermak J, Del Canizo C, Della Porta MG, Fenaux P, Gattermann N, Germing U, Jansen JH, Mittelman M, Mufti G, et al. Diagnosis and treatment of primary myelodysplastic syndromes in adults: recommendations from the European LeukemiaNet. Blood. 2013; 122:2943-64. https://doi.org/10.1182/blood-2013-03-492884.
26. Wang B, Liu Y, Hou G, Wang L, Lv N, Xu Y, Xu Y, Wang X, Xuan Z, Jing Y, Li H, Jin X, Deng A, et al. Mutational spectrum and risk stratification of intermediate-risk acute myeloid leukemia patients based on next-generation sequencing. Oncotarget. 2016; 7:32065-78. https://doi.org/10.18632/oncotarget.7028.
27. Xu L, Gu ZH, Li Y, Zhang JL, Chang CK, Pan CM, Shi JY, Shen Y, Chen B, Wang YY, Jiang L, Lu J, Xu X, et al. Genomic landscape of CD34+ hematopoietic cells in myelodysplastic syndrome and gene mutation profiles as prognostic markers. Proc Natl Acad Sci U S A. 2014; 111:8589-94. https://doi.org/10.1073/pnas.1407688111.
28. El Ghannam D, Taalab MM, Ghazy HF, Eneen AF. DNMT3A R882 mutations in patients with cytogenetically normal acute myeloid leukemia and myelodysplastic syndrome. Blood Cells Mol Dis. 2014; 53:61-6. https://doi.org/10.1016/j.bcmd.2014.01.004.
29. Christiansen DH, Andersen MK, Pedersen-Bjergaard J. Mutations of AML1 are common in therapy-related myelodysplasia following therapy with alkylating agents and are significantly associated with deletion or loss of chromosome arm 7q and with subsequent leukemic transformation. Blood. 2004; 104:1474-81. https://doi.org/10.1182/blood-2004-02-0754.
30. Thol F, Kade S, Schlarmann C, Loffeld P, Morgan M, Krauter J, Wlodarski MW, Kolking B, Wichmann M, Gorlich K, Gohring G, Bug G, Ottmann O, et al. Frequency and prognostic impact of mutations in SRSF2, U2AF1, and ZRSR2 in patients with myelodysplastic syndromes. Blood. 2012; 119:3578-84. https://doi.org/10.1182/blood-2011-12-399337.
31. Chen T, Wang Z, Zhou W, Chong Z, Meric-Bernstam F, Mills GB, Chen K. Hotspot mutations delineating diverse mutational signatures and biological utilities across cancer types. BMC Genomics. 2016; 17:394. https://doi.org/10.1186/s12864-016-2727-x.
32. Papaemmanuil E, Gerstung M, Bullinger L, Gaidzik VI, Paschka P, Roberts ND, Potter NE, Heuser M, Thol F, Bolli N, Gundem G, Van Loo P, Martincorena I, et al. Genomic Classification and Prognosis in Acute Myeloid Leukemia. N Engl J Med. 2016; 374:2209-21. https://doi.org/10.1056/NEJMoa1516192.
33. Yoshida K, Sanada M, Shiraishi Y, Nowak D, Nagata Y, Yamamoto R, Sato Y, Sato-Otsubo A, Kon A, Nagasaki M, Chalkidis G, Suzuki Y, Shiosaka M, et al. Frequent pathway mutations of splicing machinery in myelodysplasia. Nature. 2011; 478:64-9. https://doi.org/10.1038/nature10496.
34. Cancer Genome Atlas Research N. Genomic and epigenomic landscapes of adult de novo acute myeloid leukemia. N Engl J Med. 2013; 368:2059-74. https://doi.org/10.1056/NEJMoa1301689.
35. Cargo CA, Rowbotham N, Evans PA, Barrans SL, Bowen DT, Crouch S, Jack AS. Targeted sequencing identifies patients with preclinical MDS at high risk of disease progression. Blood. 2015; 126:2362-5. https://doi.org/10.1182/blood-2015-08-663237.
36. Harada H, Harada Y. Recent advances in myelodysplastic syndromes: Molecular pathogenesis and its implications for targeted therapies. Cancer Sci. 2015; 106:329-36. https://doi.org/10.1111/cas.12614.
37. Jiang Y, Dunbar A, Gondek LP, Mohan S, Rataul M, O'Keefe C, Sekeres M, Saunthararajah Y, Maciejewski JP. Aberrant DNA methylation is a dominant mechanism in MDS progression to AML. Blood. 2009; 113:1315-25. https://doi.org/10.1182/blood-2008-06-163246.
38. Hasegawa N, Oshima M, Sashida G, Matsui H, Koide S, Saraya A, Wang C, Muto T, Takane K, Kaneda A, Shimoda K, Nakaseko C, Yokote K, et al. Impact of combinatorial dysfunctions of Tet2 and Ezh2 on the epigenome in the pathogenesis of myelodysplastic syndrome. Leukemia. 2016. https://doi.org/10.1038/leu.2016.268.
39. Meldi K, Qin T, Buchi F, Droin N, Sotzen J, Micol JB, Selimoglu-Buet D, Masala E, Allione B, Gioia D, Poloni A, Lunghi M, Solary E, et al. Specific molecular signatures predict decitabine response in chronic myelomonocytic leukemia. J Clin Invest. 2015; 125:1857-72. https://doi.org/10.1172/JCI78752.
40. Yun S, Vincelette ND, Abraham I, Robertson KD, Fernandez-Zapico ME, Patnaik MM. Targeting epigenetic pathways in acute myeloid leukemia and myelodysplastic syndrome: a systematic review of hypomethylating agents trials. Clin Epigenetics. 2016; 8:68. https://doi.org/10.1186/s13148-016-0233-2.
41. Voso MT, Santini V, Fabiani E, Fianchi L, Criscuolo M, Falconi G, Guidi F, Hohaus S, Leone G. Why methylation is not a marker predictive of response to hypomethylating agents. Haematologica. 2014; 99:613-9. https://doi.org/10.3324/haematol.2013.099549.
42. Traina F, Visconte V, Elson P, Tabarroki A, Jankowska AM, Hasrouni E, Sugimoto Y, Szpurka H, Makishima H, O'Keefe CL, Sekeres MA, Advani AS, Kalaycio M, et al. Impact of molecular mutations on treatment response to DNMT inhibitors in myelodysplasia and related neoplasms. Leukemia. 2014; 28:78-87. https://doi.org/10.1038/leu.2013.269.
43. Bejar R, Lord A, Stevenson K, Bar-Natan M, Perez-Ladaga A, Zaneveld J, Wang H, Caughey B, Stojanov P, Getz G, Garcia-Manero G, Kantarjian H, Chen R, et al. TET2 mutations predict response to hypomethylating agents in myelodysplastic syndrome patients. Blood. 2014; 124:2705-12. https://doi.org/10.1182/blood-2014-06-582809.
44. Lin TL, Nagata Y, Kao HW, Sanada M, Okuno Y, Huang CF, Liang DC, Kuo MC, Lai CL, Lee EH, Shih YS, Tanaka H, Shiraishi Y, et al. Clonal leukemic evolution in myelodysplastic syndromes with TET2 and IDH1/2 mutations. Haematologica. 2014; 99:28-36. https://doi.org/10.3324/haematol.2013.091249.
45. Jin J, Hu C, Yu M, Chen F, Ye L, Yin X, Zhuang Z, Tong H. Prognostic value of isocitrate dehydrogenase mutations in myelodysplastic syndromes: a retrospective cohort study and meta-analysis. PLoS One. 2014; 9:e100206. https://doi.org/10.1371/journal.pone.0100206.
46. Vardiman JW, Thiele J, Arber DA, Brunning RD, Borowitz MJ, Porwit A, Harris NL, Le Beau MM, Hellstrom-Lindberg E, Tefferi A, Bloomfield CD. The 2008 revision of the World Health Organization (WHO) classification of myeloid neoplasms and acute leukemia: rationale and important changes. Blood. 2009; 114:937-51. https://doi.org/10.1182/blood-2009-03-209262.
47. Kimura K, Koike A. Ultrafast SNP analysis using the Burrows-Wheeler transform of short-read data. Bioinformatics. 2015; 31:1577-83. https://doi.org/10.1093/bioinformatics/btv024.
48. Cibulskis K, Lawrence MS, Carter SL, Sivachenko A, Jaffe D, Sougnez C, Gabriel S, Meyerson M, Lander ES, Getz G. Sensitive detection of somatic point mutations in impure and heterogeneous cancer samples. Nat Biotechnol. 2013; 31:213-9. https://doi.org/10.1038/nbt.2514.
49. Wang K, Li M, Hakonarson H. ANNOVAR: functional annotation of genetic variants from high-throughput sequencing data. Nucleic Acids Res. 2010; 38: e164. https://doi.org/10.1093/nar/gkq603.