
INTRODUCTION
Hepatocellular carcinoma (HCC) is the fifth most common cause of cancer and responsible for a third of the cancer-related deaths worldwide. The occurrence of HCC comprises many changes such as gene mutations, chromosomal aberrations and molecular pathways which always accompanied by cell cycle dysregulation, evasion of apoptosis [1]. So far, the best therapeutic approach for the HCC patients is liver transplantation which can eliminate HCC. However, recurrence rates remain high. Methods for early HCC detection are often evaluated on specificity and sensitivity [2] and many guidelines have been established for the early liver cancer diagnosis [3].
To identify potentially useful biomarkers and targets for the early diagnosis of HCC, the molecular mechanism of the cancer has been studied intensely especially the onset of HCC [4-8]. SPRTN could decrease DNA replication stress in DNA replication and G2/M-checkpoint regulation and the mutation of SPRTN could cause early onset of hepatocellular carcinoma [9]. In order to determine candidate genes and the most significant pathways associated with the early stage of HCC, we performed the individual and gene set level analysis by use of a series of bioinformatics approaches. Especially, the differential expressed genes (DEGs) were screened out using the SAM method and the pathways enrichment was performed using Ingenuity Pathway Analysis (IPA). Furthermore, in order to avoid the drawback of individual gene analysis, GSEA was performed to verify the former result. Then, we built the PPI network from DEGs to identify the key genes using cytoHubba plugin. And then the co-expression network was built from the key genes by use of the geneMANIA plugin based on Cytoscape.
RESULTS
Microarray analysis and data pre-processing
In order to guarantee the quality of every chip before the next analysis, we performed quality control (QC) for every raw file. The results of QC plot and box plot before and after normalization were shown in Figure 1.
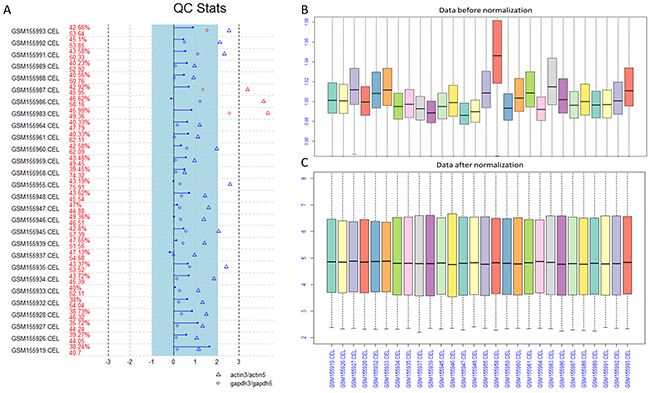
Figure 1: The QC plot and box plot before and after normalization. (A) The quality control (QC) plot analysis of the raw data. (B) The box plot for the data before normalization. (C) The box plot for the data after normalization.
Identification of DEGs
A total of 981probes were screened out at the delta = 2.44 with the FDR<0.1% (Figure 2A) (Supplementary Table 1). The minimum FDR value was reserved if several probes corresponded the same gene. At last, 797 DEGs between the early HCC and normal controls were screened out using SAM, including 421 up-regulated and 376 down-regulated genes (Supplementary Table 1). All of these DEGs are classed into 14 types according to IPA as shown in Figure 2B.
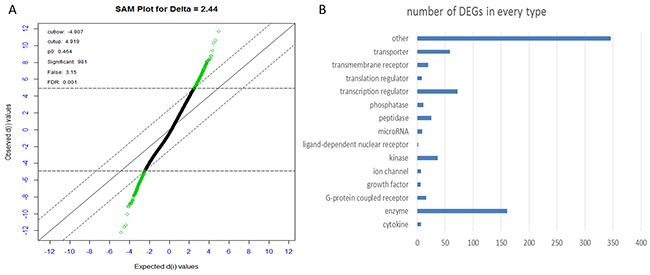
Figure 2: (A) Plot of the observed d-values vs. the ordered expected d-values. Each gene is represented by a dot, and the differentially expressed genes are colored in green. Compared to control group, there are 421 genes being significantly up-regulated (green dots above) and 376 genes being significantly down-regulated in HCC (green dots below) at an FDR of 0.1%. (B) Plot of the number of significant genes vs. types identified from DEGs from IPA.
According to the classification, enzymes, TFs, transporter, kinase composed most of the DEGs.
Canonical pathway analysis
We compared the early HCC group with the control group using IPA tool. 78 canonical pathways were identified with a p-value<0.05 and the top 26 pathways associated with the onset of HCC are shown in Figure 3. Cell Cycle: G2/M DNA Damage Checkpoint Regulation, LXR/RXR Activation, Folate Transformations I, Interferon Signaling, Superpathway of Serine and Glycine Biosynthesis I, Role of NFAT in Regulation of the Immune Response are the most significant changed pathways in HCC. Notably, 11 genes participated in G2/M DNA damage checkpoint regulation are all up-regulated.
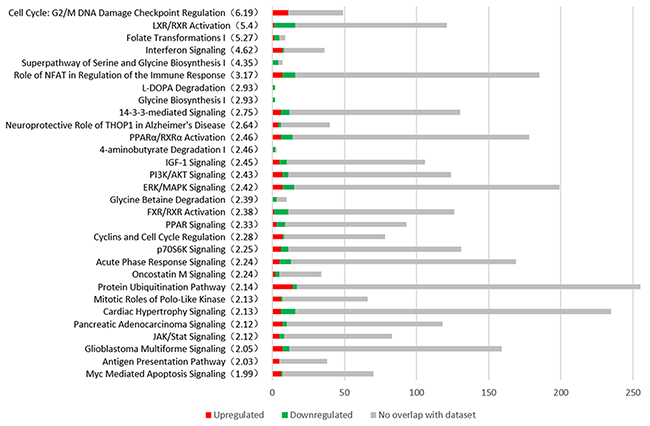
Figure 3: The most representative canonical pathways associated with the early stage of HCC are shown from Ingenuity Pathway Analysis (IPA). The number of DEGs are shown in the figure. Red represents the up-regulated genes, the green represents the down-regulated genes and the grey represents the no overlap genes with dataset. The significance (-log p value) of every pathway is indicated in parenthesis.
The upstream regulator analysis
The upstream regulator analysis was performed by IPA and 7 transcription factors (TFs) were predicted to be activated and 6TFs be inhibited as shown in Table 1. The 7 predicted activated TFs and their target genes are shown in Figure 4. The DEGs regulated by FOXO1 participate in cell cycle mainly.
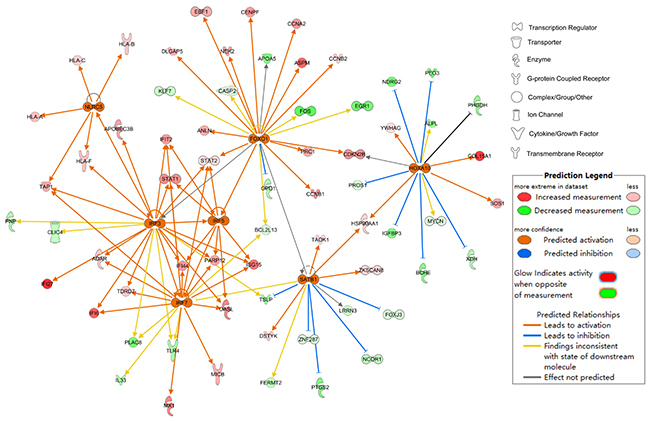
Figure 4: Upstream regulator analysis of differentially expressed genes at the early stage of HCC. 7 TFs which was predicted to be activated as determined by IPA.
Table 1: Upstream regulator analysis of differentially expressed genes in the early stage of HCC
Upstream regulator |
Predicted activation state |
Activation z-score |
p-Value of overlap |
Target molecules in dataset |
|---|---|---|---|---|
IRF3 |
Activated |
2.248 |
0.0000463 |
ADAR,APOBEC3B,CLIC4,HLA-F,IFI27,IFI44,IFI6,IFIT2,ISG15, |
IRF7 |
Activated |
2.367 |
0.0000635 |
ADAR,BCL2L13,IFI44,IFI6,IFIT2,IL33,ISG15,MICB,MX1,OASL, |
NLRC5 |
Activated |
2.182 |
0.000528 |
HLA-A,HLA-B,HLA-C,HLA-F,TAP1 |
HOXA10 |
Activated |
2.335 |
0.00442 |
ALPL,BCHE,CDKN2B,COL15A1,HSP90AA1,IGFBP3,MYCN, |
IRF5 |
Activated |
2.607 |
0.0105 |
IFI44,IFIT2,ISG15,OASL,PARP12,STAT1,STAT2 |
SATB1 |
Activated |
2.373 |
0.0316 |
DSTYK,FERMT2,FOXJ3,HSP90AA1,LRRN3,NCOR1,PTGS2, |
FOXO1 |
Activated |
2.005 |
0.0357 |
ANLN,APOA5,ASPM,BCL2L13,CASP2,CCNA2,CCNB1,CCNB2, |
TP53 |
Inhibited |
-2.388 |
1.93E-09 |
ABAT,ACAA2,ADGRB3,ALB,ANLN,AQP3,ASPM,ATAD2,AURKA, |
HNF1A |
Inhibited |
-2.256 |
0.0000157 |
ABCC9,ADH6,ALB,ANKS4B,APOH,AQP3,C8A,C8B,CYP1A2, |
HMGA1 |
Inhibited |
-2.206 |
0.000605 |
ALPL,COL4A1,EGR1,ESR1,FOS,GHR,IDI1,IER2,IGFALS, |
TRIM24 |
Inhibited |
-2.525 |
0.00217 |
IFI44,IFIT2,ISG15,OASL,PARP12,PLAC8,SAMHD1,STAT1, |
IRF4 |
Inhibited |
-2.975 |
0.0322 |
ALPL,CCNB1,CDKN2A,ENTPD1,IL33,ISG15,PDCD6, |
ELK1 |
Inhibited |
-2.146 |
0.0329 |
CDKN2A,EGR1,FOS,PTGS2,TPD52L1 |
Gene set enrichment analysis confirmed the enrichment of G2/M checkpoint at the early stage of HCC
The results from IPA showed that G2/M checkpoint regulation was the most significantly changed biological process which relates to cell proliferation closely. So we selected 14 gene sets related to the G2/M checkpoint from all 15142 gene sets in GSEA to confirm the enrichment of G2/M checkpoint or related process (Supplementary Table 2). We set the number of permutations was 1000, the permutation type was gene-set, the max and min size of gene sets selected was 500 and 10 respectively with the other parameters were default. As a result, 13/14 genes sets were up-regulated in HCC with 7 gene sets were significantly enriched at FDR<25% and one gene set was enriched at nominal p-value<0.05. 1/14 gene sets was up-regulated in the control group (BHATI_G2M_ARREST_BY_2METHOXYESTRADIOL_DN). The enrichment plot of 8 up-regulated gene sets are shown in Figure 5.
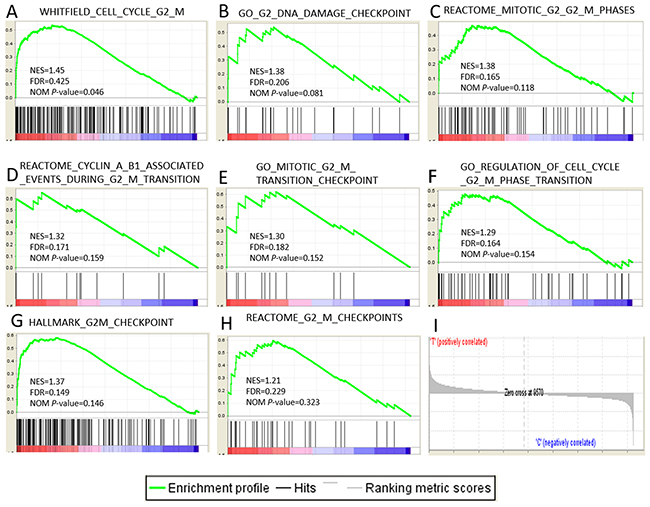
Figure 5: Gene expression profiling identifies pathways upregulated at the early stage of HCC. (A-H) The 7 significantly enriched gene sets in HCC. The normalized enrichment score, the false discovery rates (FDR) and the nominal p-value score(NES) are indicated for each gene set. Each bar at the bottom of each panel represents a member gene of the respective pathway from plot A-H and (I) shows its relative location in the ranked list of genes.
Leading edge analysis
In order to determine which genes appeared frequently in 8 genes sets associated with G2/M checkpoint and explore the genes that have the highest impact on G2/M checkpoint, 8 gene sets were dedicated to perform the leading edge analysis as shown in Figure 6. Three terms from GO overlapped mostly. CCNA2 appeared in 7 gene sets, CDC25B appeared in 6 gene sets, and NEK2,NBN,CCNB1,CDC7,ATM,XPO1,MRE11A,CENPF,TAOK3 appeared in 3 gene sets.
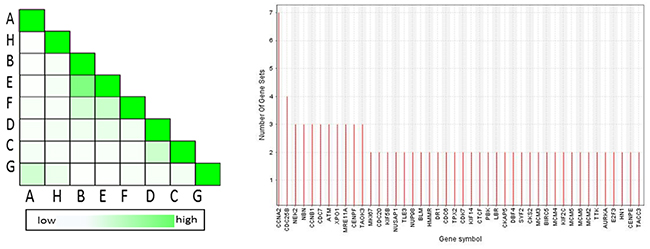
Figure 6: Set-to-set and gene in subsets from the leading edge analysis. The left graph showed the overlap between 8 subsets: the darker the color, the greater the overlap between the subsets. The intensity of the cell A and B corresponds to an X/Y ratio which is the number of leading edge genes from set A and Y is the union of leading edge genes in sets A and B. The right graph shows each gene and the number of subsets in which it appears.
PPI network construction and analysis from all DEGs
From the 797 DEGs, a network with 721 nodes and 30900 edges was constructed using GeneMANIA plugin. And eleven scoring methods including the newly developed algorithms MCC were performed by use of cytoHubba plugin. At last, 15 genes were screened out according to local-based method MCC and global-based method bottleneck and stress. The co-expression network from the 15 top-ranked genes was constructed as shown in Figure 7. 14 out 15 genes were up regulated and only C8A down regulated. 6 out of 20 top related genes were DEGs and were all up regulated. Most of these genes related to cell cycle.
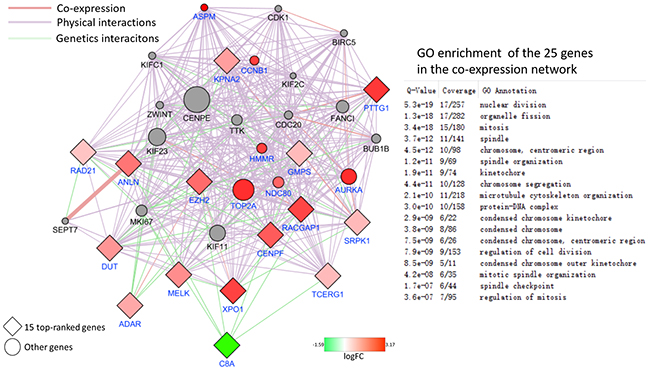
Figure 7: PPI network of 15 top-ranked DEGs and top 20 most related genes associated with the onset of HCC. The genes belong to DEGs colored by their logFC. The network was generated using the GeneMANIA plugin. The networks legend indicates the types of interactions between genes.
Kaplan-Meier survival analysis
In order to find the relationship between the key genes and survival of the HCC patients, we performed the Kaplan-Meier Survival analysis. The data showed the High expression of XPO1, KPNA2, GMPS, MELK were correlated with high risk, poor prognosis and shorter overall survival time significantly as shown in Figure 8. Kaplan-Meier survival curves indicated the patients in high risk group had obviously shorter OS time than those in low risk(p<0.05).
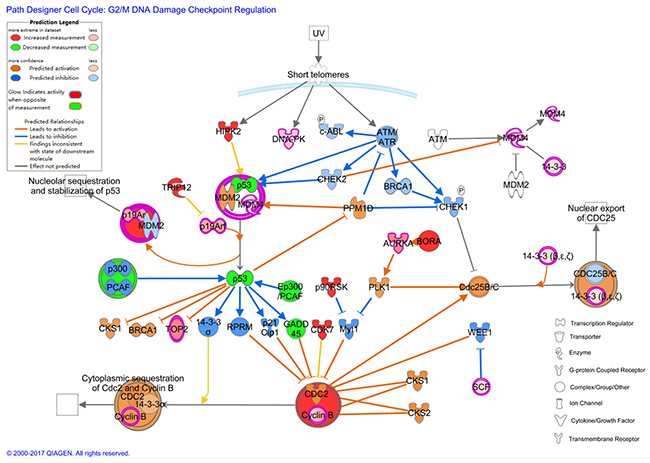
Figure 8: The molecular activation prediction (MAP) figure based on IPA.
DISCUSSION
In order to explore the most significantly dysregulated pathways and key genes which play roles at the early stage of HCC and gain an insight into the onset of HCC which could be applied to the early diagnosis and therapy, a series of bioinformatics methods were performed. According to our studies, the Cell Cycle: G2/M checkpoint regulation was the most dysregulated pathways with 11 DEGs are all up regulated. As the second checkpoint within the cell cycle, G2/M checkpoint prevents cells with damaged DNA from entering the M phase so that these DNAs could be repaired. This kind of regulation is critical to prevent cells from going through malignant transformation.
The deficiency of p53 in most human cancers make G1 checkpoint defective. The S-phase checkpoint slows rather than arrest of the cell cycle. So the cancer cell with damaged DNA could accelerate through the cell cycle and arrest at the G2 checkpoint. All the above makes the G2 checkpoint an attractive therapeutic target for anticancer therapy [10]. It has been demonstrated that Polo-like kinase (PLK) may be an early diagnostic marker for the development of HCC by regulating the G2/M checkpoint [11]. lncRNA16 is a promising biomarker for early diagnosis of lung cancer by promoting the G2/M transition by regulating the transcription of cyclin B2. As a promising antitumor agent, Isocorydine(ICD) could induce G2/M cycle arrest of HCC through activation of GADD45A-p21 pathway [12]. So, we inferred the dysregulation of this pathway is very important to the onset of HCC.
In order to confirm the result, GSEA was performed from the gene set level. GSEA is a computational method which determines whether an a priori defined set of genes shows statically significant between two biological states at the level of gene sets instead of an individual gene. GSEA can make up for the deficiency of traditional strategies which focused on the DEGs. The result of 13 gene sets associated with G2/M checkpoint upregulated in HCC and 1 upregulated in control confirmed that the G2/M checkpoint changed significantly. In order to determine the genes which contributed most to the enrichment result of 13 gene sets, the leading edge analysis was performed. 11 genes including CCNA2 (DEG), CDC25B, NEK2 (DEG), NBN, CCNB1(DEG), CDC7, ATM, XPO1(DEG), MRE11A, CENPF(DEG), TAOK3 appeared most often in several gene sets. The transcriptional factor FOXO1 was predicted active and the target genes regulated by it were associated with cell cycle most. The crosstalk of genes participated in the G2/M checkpoint is shown in Figure 9. from the molecular activity predictor(MAP).
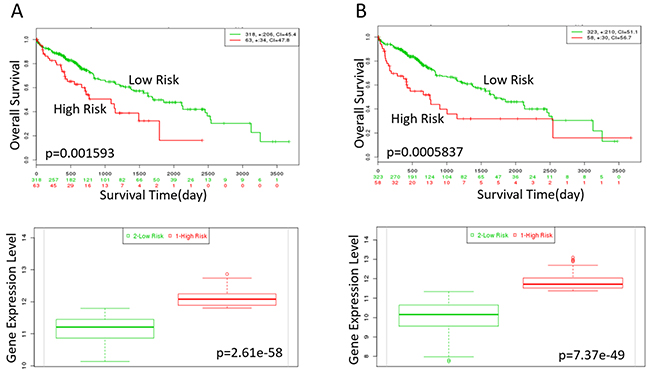
Figure 9: Kaplan-Meier curves of XPO1 and KPNA2 in TCGA liver cancer dataset (https://tcga-data.nci.nih.gov/publications/tcga) with SurvExpress (n=381). Censoring samples are shown as “+” marks.Horizontal axis represents time (day) to event. Outcome event, time scale, condordance index (CI) and p-value of the log-rank test are shown. Red and green curves represent High and Low-risk groups. The number below horizontal axis represents the number of individuals not presenting the event of the corresponding risk groups along time. (A) High expression of XPO1 is correlated with high risk, poor prognosis and shorter overall survival time. (B) High expression of KPNA2 indicates high risk, poor prognosis and shorter overall survival time. The down panel shows box plot across risk groups with the p-value.
As a plugin in cytoscape, cytoHubba provides an effective method to identify important nodes in biological networks. It could accomplish the computation of eleven methods in one stop shopping way including four local-based methods and seven global-based methods with the Maximal Clique Centrality (MCC) is a new method in order to increase the sensitivity and specificity. Through the combination of MCC, bottleneck and stress, 15 DEGs are screened out including SRPK1, XPO1, GMPS, MELK, DUT, TCERG1, RAD21, CENPF, PTTG1, EZH2, ANLN, KPNA2, RACGAP1, ADAR, C8A. All the above genes except C8A are upregulated and most of them participate in the cell cycle. From the analysis of co-expression network, we can find that the co-expressed genes which belong to DEGs upreguated too. Notably, XPO1 and CENPF is also screened out in the leading edge analysis.
SR (serine/arginine-rich domain) proteins play a critical role in many process including nuclear export of mature mRNA, polymerase II transcription and nonsense-mediated mRNA decay. SRPK1 (Serine/threonine-protein kinase) can phosphorylate SR proteins through its PKc superfamily kinase domain. But, SRPK1 displays pleiotropic effects in various cancers and regulates different cellular properties which might be related to preferential activation of different downstream signaling pathways [13-20]. Expression of SRPK1 was significantly upregulated frequently in HCC cell lines and HCC samples compared with the normal tissue sample both at the mRNA and protein level [21]. In the study of HCC, SRPK1 may be located downstream of AKT and activated AKT may induce the autophosphorylation of SRPK1 which lead to the phosphorylation of downstream splicing factors [20]. SRPK1 may be associated with FAK signaling, MAPK signaling, Wnt/β-catenin signaling and angiogenesis [13, 22]. More research implied that SRPK1 may be a novel target for cancer diagnosis and therapy. But the detailed roles and mechanisms of SRPK1 in cancer especially in HCC are not clear.
KPNA2 (karyopherin alpha 2) may participate in carcinogenesis by regulating the translocation of some cargo proteins which are involved in cancer. It was demonstrated that KPNA2 promotes cell proliferation and tumorigenicity in epithelial ovarian carcinoma by regulating c-Myc and FOXO3a [23]. The knockdown of KPNA2 could inhibit proliferation of several cancer cells including liver and lung and KPNA2 may be a useful prognostic biomarker to monitor cancer prognosis [24, 25].
To date, over 230 kinds of proteins were verified as the cargo of XPO1(Chromosome region maintenance 1,CRM1) including p53, p21, IkB, ribosomal subunits and so on [26]. XPO1 plays a vital role in nucleo-cytoplasmic transport through RanGTP dependent mechanism. For most typical tumor suppressive proteins such as p21, they play different functions according to their subcellular localization which elucidate that XPO1 plays an vital role in the process of cancer and may lead to a new method for cancer therapy which associated with cell cycle arrest and induction of apoptosis [27-29].
As glutamine amidotransferases involved in de novo purine biosynthesis, GMPS (GMP synthetase) was shown to have a striking role in cell proliferation. Under genomic stress, GMPS plays a vital role in the relay of p53 stabilization by TRIM21-GMPS-USP7 molecular cascade. The guanine nucleotides is essential for nucleotide formation, energy storage and nuclear transport which could be provided by guanine biosynthesis pathway in cancer cells [30, 31]. Repression of GMPS by p53 through p21 is a functionally relevant part of the p53-mediated process in inhibiting tumor cell growth in liver cancer [32].
It is supposed that MELK (maternal embryonic leucine zipper kinase) plays critical roles in many aspects including cell cycle, cell proliferation, embryogenesis and oncogenesis due to its overexpression in many kinds of cancers. MELK is associated with early HCC recurrence and poor patients’ survival but the mechanism has not been elucidated [33]. MELK knockdown or deletion in GC (gastric cancer) and ovarian cancer cells activates G2/M arrest and enhances apoptosis [34, 35].
Previous studies have revealed that amplified CENPF (centromere protein F) may play a role as common cancer-driver genes in human cancers. CENPF contains many leucine zipper motifs and is regulated in a cell cycle-dependent manner [36]. It amplified and overexpressed not only in HCC but also in many other types of human cancer including breast cancer, colorectal cancer, prostate cancer [37, 38]. Silence of CENPF arrests HCC cells at the G2/M transition with the accumulation of MPF (mature promoting factor) and CCNB1/CDC2 complex [39]. In consistence with these studies, the present study found that CENPF is identified as a key gene not only in DEGs but also in leading edge analysis which based on gene set level.
As the single down regulated one in all the key genes, C8A (complement component alpha) involves in the complement system and participates in the formation of MAC (membrane attack complex) combined with other complement proteins such as C5b, C6, C7, C8 and C9. In addition, the expression of several other complement components or subunits are all down regulated ,including C1S, C2, C5, C6, C7, C8B, C8G, C9. Obviously, it is not coincidence. That is to say, the activity of complement system down regulated at the early stage of HCC. The transcription of C8A and C5 is regulated by HNF1α (hepatocyte nuclear factor 1 alpha) both are essential components of MAC [40]. The relationship between C8A and cancer is not clear yet.
G2/M checkpoint provides an opportunity for DNA repair by increasing the time for repair and by transcriptionally inducing gene expression and stopping the proliferation of damaged cells [41]. To the best of our knowledge, G2/M checkpoint transition activated at the early stage of HCC was provided for the first time through the microarray analysis. The negligent G2/M checkpoint enhanced the possibility for DSB (double strand breakage). And the unrepaired DSBs before mitosis will pose a higher risk for genomic instability and tumor cell development [42]. So, the defect of G2/M checkpoint may play a critical role at the onset of HCC.
MATERIALS AND METHODS
Data source
The gene expression dataset GSE6764 were downloaded from the Gene Expression Omnibus (GEO) database by Wurmbach E et.al (https://www.ncbi.nlm.nih.gov/geo/). 75 tissue samples obtained from patients undergoing resection or liver transplantation were divided into 8 groups from pre-neoplastic lesions to HCC and normal liver were used as control (http://www.ncbi.nlm.nih.gov/geo/). We combined very early and early HCC to the case group including 18 tissue samples altogether, and the control group, with 10 normal liver tissue. All tissue samples are hybridized on the human U133 plus 2.0 array (Affymetrix).
Microarray data analysis and identification of differentially expressed genes (DEGs) using SAM
Robust Multi-array Average (RMA) algorithm including background correction, normalization and summarization was performed to convert the .CEL raw file to expression data which based on R language [43]. The simpleaffy package was utilized to perform the quality control. Once the signal value for each probe set calculated in every microarray, the t-test based significance analysis of microarrays (SAM) which make use of permutations to simulate for every gene a situation in which there is no difference between the two groups was utilized to determine the DEGs. SAM method adjusts the p-value to false discovery rate (FDR) to reduce the false-positive through multiple testing. A <0.1% False discovery rate (FDR) cut-off was used for all differential expression calculations [44].
Ingenuity pathway analysis
Ingenuity Pathway Analysis (IPA) is a functional analysis tool (Ingenuity Systems, Mountain view, CA, USA). We use IPA to identify the most significant pathways (including 302 metabolic pathways and 360 signaling pathways) and construct molecular interaction networks from the DEGs. In brief, we uploaded the DEGs list file containing gene symbols, FC, p-values to IPA and performed the core analysis. In general settings, the node types, data sources, confidence, species, tissues & cell lines and mutation were specified.
The IPA upstream transcriptional regulator analysis
In order to explain the biological activities due to the DEGs, we identified the cascade of upstream transcriptional regulators with p-value of overlap <0.05 and the absolute activation z-score>2.
Gene set enrichment analysis (GSEA) and leading edge analysis
GSEA is a kind of gene enrichment method considering the full list of genes different from single gene method [45]. In GSEA, genes are ranked by their correlation with phenotype and every enrichment gene set will get an enrichment score (ES). In this study, 2000 gene permutations were used to generate a null distribution for ES, then each pathway will attain a normalization enrichment score(NES). Gene sets with considered significantly enriched with a relatively relax p-value and FDR<0.25. A leading edge analysis was performed to elucidate key genes associated with the early stage of HCC, especially the G2/M checkpoint regulation [46].
Construction of PPI network from all DEGs and the screening of key genes
In order to comprehend the specific molecular mechanism of early HCC, we constructed the PPI network based on GeneMANIA plugin and calculated the key DEGs using cytoHubba plugin [47, 48]. At last, we built the co-expression network of top-ranked genes from all DEGs and performed the visualization and analysis by use of Cytoscape 3.4.0(http://cytoscape.org/).
Kaplan-Meier survival analysis
SurvExpress(http://bioinformatica.mty.itesm.mx:8080/Biomatec/SurvivaX.jsp) was employed to perform the survival analysis in the datasets TCGA-liver cancer containing 422 samples provided by SruvExpress using the key genes as an input. For the duplicated genes, all probe sets/records will be averaged per sample using the original (Quantile-Normalized) data. The maximum risk groups were selected for the cox survival analysis. This method uses an optimization algorithm from the ordered PI to produce risk groups as described in the tutorial provided in SurvExpress website [49].
CONCLUSION
The combinatorial effect of the GSEA, DEGs, and leading edge analysis output shed a light on the elucidating of key pathways and genes which genetically dysregulated at the early stage of HCC. The study unveiled that the G2/M checkpoint plays a vital role at the onset of HCC. And the genes SRPK1, XPO1, GMPS, MELK, DUT, TCERG1, RAD21, CENPF, PTTG1, EZH2, ANLN, KPNA2, RACGAP1, ADAR, C8A could be considered as critical genes for this process. These findings contributed to a better understanding of the onset of HCC. Further studies were required to elucidate the mechanism of the process.
ACKNOWLEDGMENTS
This study was supported by the national basic research 973 Pre-research Program of China (No. 2012CB722304), Natural Science Foundation of China (No. 31572270 and No.31201093).
CONFLICTS OF INTEREST
The authors declare that they have no conflicts of interest.
REFERENCES
1. Schlachterman A, Craft WW Jr, Hilgenfeldt E, Mitra A, Cabrera R. Current and future treatments for hepatocellular carcinoma. World J Gastroenterol. 2015; 21:8478-8491.
2. Cristea CG, Gheonea IA, Sandulescu LD, Gheonea DI, Ciurea T, Purcarea MR. Considerations regarding current diagnosis and prognosis of hepatocellular carcinoma. J Med Life. 2015; 8:120-128.
3. Lopez PM, Villanueva A, Llovet JM. Systematic review: evidence-based management of hepatocellular carcinoma--an updated analysis of randomized controlled trials. Aliment Pharmacol Ther. 2006; 23:1535-1547.
4. Bao L, Zhao J, Dai X, Wang Y, Ma R, Su Y, Cui H, Niu J, Bai S, Xiao Z, Yuan H, Yang Z, Li C, et al. Correlation between miR-23a and onset of hepatocellular carcinoma. Clin Res Hepatol Gastroenterol. 2014; 38:318-330.
5. Dooley S, Weng H, Mertens PR. Hypotheses on the role of transforming growth factor-beta in the onset and progression of hepatocellular carcinoma. Dig Dis. 2009; 27:93-101.
6. Kao WY, Yang SH, Liu WJ, Yeh MY, Lin CL, Liu CJ, Huang CJ, Lin SM, Lee SD, Chen PJ, Yu MW. Genome-wide identification of blood DNA methylation patterns associated with early-onset hepatocellular carcinoma development in hepatitis B carriers. Mol Carcinog. 2017; 56:425-435.
7. Stender S, Chakrabarti RS, Xing C, Gotway G, Cohen JC, Hobbs HH. Adult-onset liver disease and hepatocellular carcinoma in S-adenosylhomocysteine hydrolase deficiency. Mol Genet Metab. 2015; 116:269-274.
8. Wong N, Yeo W, Wong WL, Wong NL, Chan KY, Mo FK, Koh J, Chan SL, Chan AT, Lai PB, Ching AK, Tong JH, Ng HK, et al. TOP2A overexpression in hepatocellular carcinoma correlates with early age onset, shorter patients survival and chemoresistance. Int J Cancer. 2009; 124:644-652.
9. Lessel D, Vaz B, Halder S, Lockhart PJ, Marinovic-Terzic I, Lopez-Mosqueda J, Philipp M, Sim JC, Smith KR, Oehler J, Cabrera E, Freire R, Pope K, et al. Mutations in SPRTN cause early onset hepatocellular carcinoma, genomic instability and progeroid features. Nat Genet. 2014; 46:1239-1244.
10. Bucher N, Britten CD. G2 checkpoint abrogation and checkpoint kinase-1 targeting in the treatment of cancer. Br J Cancer. 2008; 98:523-528.
11. Sun W, Su Q, Cao X, Shang B, Chen A, Yin H, Liu B. High expression of polo-like kinase 1 is associated with early development of hepatocellular carcinoma. Int J Genomics. 2014; 2014:312130.
12. Chen L, Tian H, Li M, Ge C, Zhao F, Zhang L, Li H, Liu J, Wang T, Yao M and Li J. Derivate isocorydine inhibits cell proliferation in hepatocellular carcinoma cell lines by inducing G2/M cell cycle arrest and apoptosis. Tumour Biol. 2016; 37:5951-5961.
13. Bullock N, Oltean S. The many faces of SRPK1. J Pathol. 2016.
14. Bullock N, Potts J, Simpkin AJ, Koupparis A, Harper SJ, Oxley J, Oltean S. Serine-arginine protein kinase 1 (SRPK1), a determinant of angiogenesis, is upregulated in prostate cancer and correlates with disease stage and invasion. J Clin Pathol. 2016; 69:171-175.
15. Gammons MV, Lucas R, Dean R, Coupland SE, Oltean S, Bates DO. Targeting SRPK1 to control VEGF-mediated tumour angiogenesis in metastatic melanoma. Br J Cancer. 2014; 111:477-485.
16. Gong L, Song J, Lin X, Wei F, Zhang C, Wang Z, Zhu J, Wu S, Chen Y, Liang J, Fu X, Lu J, Zhou C, Song L. Serine-arginine protein kinase 1 promotes a cancer stem cell-like phenotype through activation of Wnt/beta-catenin signalling in NSCLC. J Pathol. 2016; 240:184-196.
17. Liu H, Hu X, Zhu Y, Jiang G, Chen S. Up-regulation of SRPK1 in non-small cell lung cancer promotes the growth and migration of cancer cells. Tumour Biol. 2016; 37:7287-7293.
18. Mavrou A, Brakspear K, Hamdollah-Zadeh M, Damodaran G, Babaei-Jadidi R, Oxley J, Gillatt DA, Ladomery MR, Harper SJ, Bates DO, Oltean S. Serine-arginine protein kinase 1 (SRPK1) inhibition as a potential novel targeted therapeutic strategy in prostate cancer. Oncogene. 2015; 34:4311-4319.
19. van Roosmalen W, Le Devedec SE, Golani O, Smid M, Pulyakhina I, Timmermans AM, Look MP, Zi D, Pont C, de Graauw M, Naffar-Abu-Amara S, Kirsanova C, Rustici G, et al. Tumor cell migration screen identifies SRPK1 as breast cancer metastasis determinant. J Clin Invest. 2015; 125:1648-1664.
20. Zhou B, Li Y, Deng Q, Wang H, Wang Y, Cai B, Han ZG. SRPK1 contributes to malignancy of hepatocellular carcinoma through a possible mechanism involving PI3K/Akt. Mol Cell Biochem. 2013; 379:191-199.
21. Zhang J, Jiang H, Xia W, Jiang Y, Tan X, Liu P, Jia H, Yang X, Shen G. Serine-arginine protein kinase 1 is associated with hepatocellular carcinoma progression and poor patient survival. Tumour Biol. 2016; 37:283-290.
22. Hayes GM, Carrigan PE, Miller LJ. Serine-arginine protein kinase 1 overexpression is associated with tumorigenic imbalance in mitogen-activated protein kinase pathways in breast, colonic, and pancreatic carcinomas. Cancer Res. 2007; 67:2072-2080.
23. Huang L, Wang HY, Li JD, Wang JH, Zhou Y, Luo RZ, Yun JP, Zhang Y, Jia WH, Zheng M. KPNA2 promotes cell proliferation and tumorigenicity in epithelial ovarian carcinoma through upregulation of c-Myc and downregulation of FOXO3a. Cell Death Dis. 2013; 4:e745.
24. Zhou LN, Tan Y, Li P, Zeng P, Chen MB, Tian Y, Zhu YQ. Prognostic value of increased KPNA2 expression in some solid tumors: a systematic review and meta-analysis. Oncotarget. 2017; 8:303-314. https://doi.org/10.18632/oncotarget.13863.
25. Tsukagoshi M, Araki K, Yokobori T, Altan B, Suzuki H, Kubo N, Watanabe A, Ishii N, Hosouchi Y, Nishiyama M, Shirabe K, Kuwano H. Overexpression of karyopherin-a2 in cholangiocarcinoma correlates with poor prognosis and gemcitabine sensitivity via nuclear translocation of DNA repair proteins. Oncotarget. 2017; 8:42159-42172. https://doi.org/10.18632/oncotarget.15020.
26. Ohkoshi S, Yano M, Matsuda Y. Oncogenic role of p21 in hepatocarcinogenesis suggests a new treatment strategy. World J Gastroenterol. 2015; 21:12150-12156.
27. Dickmanns A, Monecke T, Ficner R. Structural basis of targeting the exportin CRM1 in cancer. Cells. 2015; 4:538-568.
28. Koyama M, Matsuura Y. Mechanistic insights from the recent structures of the CRM1 nuclear export complex and its disassembly intermediate. Biophysics (Nagoya-shi). 2012; 8:145-150.
29. Lu C, Figueroa JA, Liu Z, Konala V, Aulakh A, Verma R, Cobos E, Chiriva-Internati M, Gao W. Nuclear export as a novel therapeutic target: the CRM1 connection. Curr Cancer Drug Targets. 2015; 15:575-592.
30. Guarnieri AL, Espinosa JM. Back to bases: how a nucleotide biosynthetic enzyme controls p53 activation. Mol Cell. 2014; 53:365-367.
31. Reddy BA, van der Knaap JA, Bot AG, Mohd-Sarip A, Dekkers DH, Timmermans MA, Martens JW, Demmers JA, Verrijzer CP. Nucleotide biosynthetic enzyme GMP synthase is a TRIM21-controlled relay of p53 stabilization. Mol Cell. 2014; 53:458-470.
32. Holzer K, Drucker E, Roessler S, Dauch D, Heinzmann F, Waldburger N, Eiteneuer EM, Herpel E, Breuhahn K, Zender L, Schirmacher P, Ori A, Singer S. Proteomic analysis reveals GMP synthetase as p53 repression target in liver cancer. Am J Pathol. 2017; 187:228-235.
33. Xia H, Kong SN, Chen J, Shi M, Sekar K, Seshachalam VP, Rajasekaran M, Goh BK, Ooi LL, Hui KM. MELK is an oncogenic kinase essential for early hepatocellular carcinoma recurrence. Cancer Lett. 2016; 383:85-93.
34. Li S, Li Z, Guo T, Xing XF, Cheng X, Du H, Wen XZ, Ji JF. Maternal embryonic leucine zipper kinase serves as a poor prognosis marker and therapeutic target in gastric cancer. Oncotarget. 2016; 7:6266-6280. https://doi.org/10.18632/oncotarget.6673.
35. Kohler RS, Kettelhack H, Knipprath-Meszaros AM, Fedier A, Schoetzau A, Jacob F, Heinzelmann-Schwarz V. MELK expression in ovarian cancer correlates with poor outcome and its inhibition by OTSSP167 abrogates proliferation and viability of ovarian cancer cells. Gynecol Oncol. 2017; 145:159-166.
36. Ma L, Zhao X, Zhu X. Mitosin/CENP-F in mitosis, transcriptional control, and differentiation. J Biomed Sci. 2006; 13:205-213.
37. Kim HE, Kim DG, Lee KJ, Son JG, Song MY, Park YM, Kim JJ, Cho SW, Chi SG, Cheong HS, Shin HD, Lee SW, Lee JK. Frequent amplification of CENPF, GMNN and CDK13 genes in hepatocellular carcinomas. PLoS One. 2012; 7:e43223.
38. Aytes A, Mitrofanova A, Lefebvre C, Alvarez MJ, Castillo-Martin M, Zheng T, Eastham JA, Gopalan A, Pienta KJ, Shen MM, Califano A, Abate-Shen C. Cross-species regulatory network analysis identifies a synergistic interaction between FOXM1 and CENPF that drives prostate cancer malignancy. Cancer Cell. 2014; 25:638-651.
39. Dai Y, Liu L, Zeng T, Zhu YH, Li J, Chen L, Li Y, Yuan YF, Ma S, Guan XY. Characterization of the oncogenic function of centromere protein F in hepatocellular carcinoma. Biochem Biophys Res Commun. 2013; 436:711-718.
40. Pontoglio M, Pausa M, Doyen A, Viollet B, Yaniv M, Tedesco F. Hepatocyte nuclear factor 1alpha controls the expression of terminal complement genes. J Exp Med. 2001; 194:1683-1689.
41. Paulovich AG, Toczyski DP, Hartwell LH. When checkpoints fail. Cell. 1997; 88:315-321.
42. Lobrich M, Jeggo PA. The impact of a negligent G2/M checkpoint on genomic instability and cancer induction. Nat Rev Cancer. 2007; 7:861-869.
43. Gautier L, Cope L, Bolstad BM, Irizarry RA. affy--analysis of Affymetrix GeneChip data at the probe level. Bioinformatics. 2004; 20:307-315.
44. Grace C, Nacheva EP. Significance analysis of microarrays (SAM) offers clues to differences between the genomes of adult Philadelphia positive ALL and the lymphoid blast transformation of CML. Cancer Inform. 2012; 11:173-183.
45. Subramanian A, Kuehn H, Gould J, Tamayo P, Mesirov JP. GSEA-P: a desktop application for Gene Set Enrichment Analysis. Bioinformatics. 2007; 23:3251-3253.
46. Fleming DS, Miller LC. Leading edge analysis of transcriptomic changes during pseudorabies virus infection. Genom Data. 2016; 10:104-106.
47. Montojo J, Zuberi K, Rodriguez H, Kazi F, Wright G, Donaldson SL, Morris Q, Bader GD. GeneMANIA Cytoscape plugin: fast gene function predictions on the desktop. Bioinformatics. 2010; 26:2927-2928.
48. Chin CH, Chen SH, Wu HH, Ho CW, Ko MT, Lin CY. cytoHubba: identifying hub objects and sub-networks from complex interactome. BMC Syst Biol. 2014; 8:S11.
49. Aguirre-Gamboa R, Gomez-Rueda H, Martinez-Ledesma E, Martinez-Torteya A, Chacolla-Huaringa R, Rodriguez-Barrientos A, Tamez-Pena JG, Trevino V. SurvExpress: an online biomarker validation tool and database for cancer gene expression data using survival analysis. PLoS One. 2013; 8:e74250.