
INTRODUCTION
Gastric cancer (GC) is a major cancer-related threat to global health [1, 2]. In 2015, it was the second most common type of cancer, and the third leading cause of cancer deaths in China, accounting for an estimated 339,300 deaths [3]. GC prognosis remains poor because typical symptoms are usually absent in the early stages, resulting in delayed diagnosis and treatment. There is also a lack of reliable biomarkers available for screening targeted therapies and predicting prognosis. Immunotherapy has been considered as an anticancer treatment [4]. The suppression of immune checkpoint pathways may be the most promising approach. This includes the cytotoxic T-lymphocyte–associated protein 4(CTLA-4) and programmed cell death 1(PD-1) pathways [5].
PD-1 and its ligand PD-L1/PD-L2 are a group of negative co-stimulatory molecules that can suppress T cell proliferation in carcinoma [6–8]. The clinical efficacy of PD-1/PD-L1 inhibition has been observed for various malignancies, such as melanoma, non-small cell lung cancer (NSCLC), and renal cell carcinoma (RCC). In addition, clinical trials have shown that positive expression of PD-L1 is associated with a higher response rate to anti-PD-1/PD-L1 treatment [9]. PD-1/PD-L1 might be useful biomarkers for predicting cancer survival. A fraction of patients with PD-L1-negative tumors responded to PD-1 inhibitors in clinical trials [10], suggesting that PD-L2 may predict treatment response.
The stroma of gastric cancer is infiltrated with numerous T lymphocytes [11]. This implies that gastric cancer development is more related to the immune microenvironment than that of other cancers. Therefore, tumor microenvironment-based biomarkers might be more valuable in predicting GC prognosis. PD-L1 and PD-L2 are expressed not only in the tumor cells (TCs), but also in the tumor-infiltrating immune cells (TIICs) [12, 13]. Patients with positive PD-L1 expression in the TIICs have a greater response to anti-PD-1/PD-L1 treatment. The immune stroma-based PD-L1/L2 expression may be clinically valuable. Meanwhile, researchers have begun to follow the relationship between PD-L1 expression in TIICs and cancer prognosis with great interest, but the results have failed to give rise to consistent conclusions [14–16]. Thus, the assessment of PD-L1/L2 expression in TIICs in our cohort may be beneficial in providing new insights into the utility of the PD-1 and PD-L1/L2 pathway in the prediction of GC prognosis.
Infection promotes the susceptibility to, and development of, gastric cancer. Helicobacter pylori (H. pylori; Hp) and Epstein-Barr virus (EBV) infections are the most common infection-related risk factors of gastric cancer [17, 18]. H. pylori infection is positively associated with early inflammatory, precancerous lesions of GC [19]. Similar to H. pylori, EBV can stimulate the oncogenic process of GC by promoting chronic inflammation and increased tissue damage [20]. Hp and EBV infections promote the formation of the tumor immune microenvironment [21, 22].
A comprehensive molecular classification of gastric adenocarcinomas was reported by The Cancer Genome Atlas (TCGA), and the EBV-positive GC (EBVaGC) accounted for 5.0-17.9% of gastric cancers [23, 24]. EBV-positive GC is characterized by increased levels of genes encoding PD-1, PD-L1, and PD-L2 [24]. H. pylori-infected GC and EBV-positive GC may have different states of immunity compared with other types of GC and may lead to an increased PD-1 and PD-L1/L2 expression. In a Western cohort, abundant PD-L1 expression was found in EBV-infected gastric cancers. In a large Asian cohort, PD-1 and PD-L1/L2 expression could not be definitively correlated with H. pylori-infected or EBV-positive GC.
In the current study, we evaluated PD-1 and PD-L1/L2 expression in tumor cells (TCs) and tumor-infiltrating immune cells (TIICs). We determined the Helicobacter pylori (Hp) and Epstein-Barr virus (EBV) infection status in a large GC cohort, then analyzed the relationship between the expression of PD-1, PD-L1/L2 and GC prognosis.
RESULTS
Subject characteristics
In a total of 357 cases, 6 patients died of postoperative complications within 30 days, and 11 patients were lost to follow-up at the first time point. These 17 patients were excluded from our study, and the remaining 340 gastric cancer patients who underwent surgical resection were included in the final analysis. The median follow-up time was 48 months (ranging from 1 to 111 months). During follow-up, 169 (50.0%) patients died of GC, 2 (0.5%) patients died from other causes, 134 (39.0%) patients were still alive, and 35 (10.0%) patients were lost to follow-up (Figure 1). There were 254 (74.7%) males in our study, and the median age was 62 (range 26–87) years. The other characteristics of the GC patient cohort are summarized in Table 1.
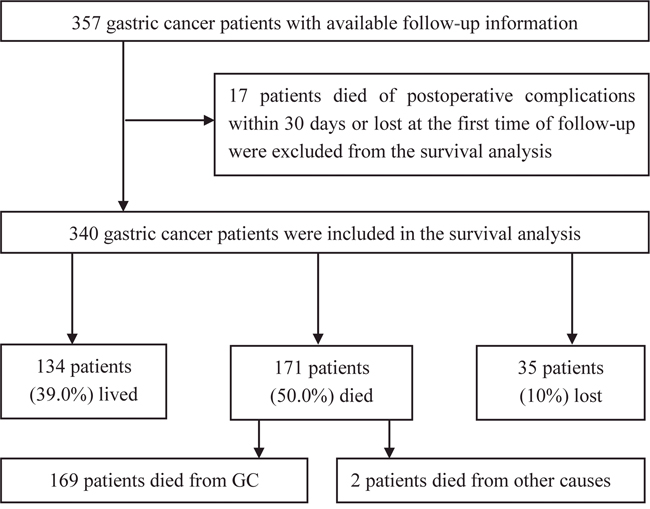
Figure 1: Flow chart of the subjects enrolled.
Table 1: Characteristics of the GC patients
Characteristics |
N (%) |
|---|---|
Gender |
|
Male |
254(74.7) |
Female |
86(25.3) |
Age |
|
≤45 |
22(6.5) |
>45 |
318(93.5) |
EBV |
|
Positive |
17(5.0) |
Negative |
323(95.0) |
Helicobacter pylori |
|
Positive |
62(60.8) |
Negative |
40(39.2) |
WHO classification |
|
Tubularadenocarcinoma |
244(71.8) |
Signet ring cell |
36(10.6) |
Other |
60(17.6) |
Histological grade |
|
low grade |
89(26.2) |
high grade |
251(73.8) |
Tumor size |
|
<5cm |
118(34.7) |
≥5cm |
222(65.3) |
Vascular invasion |
|
Negative |
73(21.5) |
Positive |
267(78.5) |
Neural invasion |
|
Negative |
124(36.5) |
Positive |
216(63.5) |
Depth of invasion |
|
T1/T2 |
34(10.0) |
T3/T4 |
306(90.0) |
Lymph metastasis |
|
N0 |
65(19.1) |
N1/N2/N3 |
275(80.9) |
Distant metastasis |
|
M0 |
325(95.6) |
M1 |
15(4.4) |
TNM stage |
|
I – II |
96(28.2) |
III-IV |
244(71.8) |
Chemotherapy |
|
None |
234(68.8) |
XELOXa |
12(3.5) |
FLOFOXb |
8(2.4) |
Otherc |
86(25.3) |
a, a combination of capecitabine and oxaliplatinat least three cycles; b, a combination of 5-fluorouracil, leucovorin, and oxaliplatinat least three cycles; c, other chemotherapy at least three cycles.
PD-1, PD-L1 and PD-L2 expression in TCs and TIICs, according to H. pylori status and EBV status
PD-1 expression was observed in the TIICs of 77 (22.6%) gastric cancer patients, especially in the lymph follicles (Figure 2A, 2B). PD-L1 and PD-L2 expression was observed in both TCs and TIICs (Figure 2C to 2L). Membranous and cytoplasmic expression was both regarded as positive expression. In TCs, the IRS values for PD-L1 and PD-L2 expression both ranged from 0 to 6 (median 2 for PD-L1; median 1 for PD-L2). A total of 137 (40.3%) patients were positive for PD-L1 in TCs, and 183 (53.8%) patients were positive for PD-L2 in TCs. For the TIICs, the prevalence of positive PD-L1 and PD-L2 expression was 60.0% and 60.9%, respectively. PD-L1 expression patterns in TCs were divided into ‘diffuse type’ (Figure 2C, 2D) and ‘interface type’ (Figure 2E, 2F). We observed PD-L1 overexpression in the neoplastic nerve fibers (Figure 2M), and PD-L2 overexpression in the intestinal metaplasia of the gastric epithelium (Figure 2N).
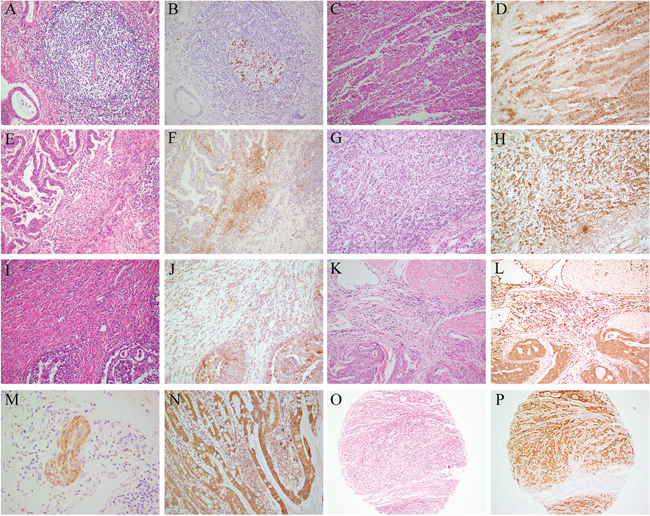
Figure 2: PD-1, PD-L1, and PD-L2 expression in TCs and TIICs of GC patients. Routine H&E staining (A, C, E, G, I, K and O). (B) Positive PD-1 expression in the lymph follicles (IHC). (D) Positive PD-L1 expression in tumor cells with a ‘diffuse type’ phenotype (IHC). (F) Positive PD-L1 expression at the interface between tumor and non-neoplastic tissues (IHC). (H) Positive PD-L2 expression in the tumor cells (IHC). (J) Positive PD-L1 expression in the TIICs (IHC). (L) Positive PD-L2 expression in the TIICs (IHC). (M) Positive PD-L1 expression in the neoplastic nerve fibers (IHC). (N) Positive expression of PD-L2 in the intestinal metaplasia of gastric epithelium (IHC). (P) Positive detection of EBV in tumor microarrays of gastric cancer (IHC). Magnification: 200× (A-L), 400× (M-N), and 100× (O-P).
H. pylori infection status data were available for 102 patients, and Hp infection was found in 62 (60.8%) cases. There were no associations between the expression of PD-1, PD-L1, or PD-L2 and Hp status (Table 2). EBV status was evaluated in all 340 patients, and the prevalence of EBV infection was 5.0% (see Figure 2O, 2P). Positive PD-L1 expression in the TCs was more frequent in EBV-infected GC patients (P<0.01). EBV-infected GC patients also had greater PD-L1 expression in the TIICs (P<0.01). We found no association between the expression of PD-1 and PD-L2 with EBV status (Supplementary Figure 1, Table 2).
Table 2: PD-1 and PD-L1/L2 expression in TCs and TIICs, according to H. pylori status and EBV status
ALL N=340 |
H. pylori status |
P |
EBV status |
P |
|||
|---|---|---|---|---|---|---|---|
Positive(n=62) |
Negative(n=40) |
Positive(n=17) |
Negative(n=323) |
||||
PD-1 in TIICs |
|||||||
Positive |
77(22.6%) |
15(24.2%) |
10(25.0%) |
0.926 |
5(29.4%) |
72(22.3%) |
0.494 |
Negative |
263(77.4%) |
47(75.8%) |
30(75.0%) |
12(70.6%) |
251(77.7%) |
||
PD-L1 in TCs |
|||||||
Positive |
137(40.3%) |
24(38.7%) |
19(47.5%) |
0.380 |
12(70.6%) |
125(38.7%) |
0.009 |
Negative |
203(59.7%) |
38(61.3%) |
21(52.5%) |
5(29.4%) |
198(61.3%) |
||
PD-L1 in TIICs |
|||||||
Positive |
204(60.0%) |
36(58.1%) |
26(65.0%) |
0.484 |
16(94.1%) |
188(58.2%) |
0.003 |
Negative |
136(40.0%) |
26(41.9%) |
14(35.0%) |
1(5.9%) |
135(41.8%) |
||
PD-L2 in TCs |
|||||||
Positive |
183(53.8%) |
24(38.7%) |
21(52.5%) |
0.171 |
7(41.2%) |
176(54.5%) |
0.283 |
Negative |
157(46.2%) |
38(61.3%) |
19(47.5%) |
10(58.8%) |
147(45.5%) |
||
PD-L2 in TIICs |
|||||||
Positive |
207(60.9%) |
29(46.8%) |
24(60.0%) |
0.192 |
10(58.8%) |
197(61.0%) |
0.858 |
Negative |
133(39.1%) |
33(53.2%) |
16(40.0%) |
7(41.2%) |
126(39.0%) |
||
Clinicopathological characteristics associated with the expression of PD-1, PD-L1, and PD-L2 in TCs and TIICs
PD-1 expression was more prevalent in the younger patients (≤45) than in the older patients (P=0.002), and it was more prevalent in patients with smaller tumors (diameter<5 cm) than in those with larger tumors (P=0.024) (Table 3). In TCs, the prevalence of positive PD-L1 expression was higher in patients with tubular adenocarcinoma, tumors with diameters larger than 5 cm, invasive depth of T3/T4, absence of lymph metastasis and lower TNM stage (P<0.05). PD-L1 expression in TIICs was positively correlated with males, tumor type of tubular adenocarcinoma, larger tumor size, tumor with neural invasion, and lower TNM stages (P<0.05) (Table 4). No associations were found between PD-L2 expression and clinicopathological characteristics in either TCs or TIICs (Supplementary Table 1).
Table 3: Clinicopathological characteristics of patients according to the expression of PD-1
Characteristics |
PD-1 positive |
PD-1 negative |
P |
|---|---|---|---|
(N=77) |
(N=263) |
||
Gender |
|||
Male |
60(23.6%) |
194(76.4%) |
0.460 |
Female |
17(19.8%) |
69(80.2%) |
|
Age |
|||
≤45 |
11(50.0%) |
11(50.0%) |
0.002 |
>45 |
66(20.8%) |
252(79.2%) |
|
WHO classification |
|||
Tubular adenocarcinoma |
51(20.9%) |
193(79.1%) |
0.124 |
Signet ring cell |
13(36.1%) |
23(63.9%) |
|
Other |
13(21.7%) |
47(78.3%) |
|
Histological grade |
|||
low grade |
20(22.5%) |
69(77.5%) |
0.963 |
high grade |
57(22.7%) |
194(77.3%) |
|
Tumor size |
|||
<5cm |
35(29.7%) |
83(70.3%) |
0.024 |
≥5cm |
42(18.9%) |
180(81.1%) |
|
Vascular invasion |
|||
Negative |
16(21.9%) |
57(78.1%) |
0.867 |
Positive |
61(22.8%) |
206(77.2%) |
|
Neural invasion |
|||
Negative |
31(25.0%) |
93(75.0%) |
0.432 |
Positive |
46(21.3%) |
170(78.07%) |
|
Depth of invasion |
|||
T1/T2 |
11(32.4%) |
23(67.6%) |
0.154 |
T3/T4 |
66(21.6%) |
240(78.4%) |
|
Lymph metastasis |
|||
N0 |
13(20.0%) |
52(80.0%) |
0.571 |
N1/N2/N3 |
64(23.3%) |
211(77.4%) |
|
Distant metastasis |
|||
M0 |
75(23.1%) |
250(76.9%) |
0.378 |
M1 |
2(13.3%) |
13(86.7%) |
|
TNM stage |
|||
I-II |
24(25.0%) |
72(75.0%) |
0.516 |
III-IV |
53(21.7%) |
191(78.3%) |
Table 4: Clinicopathological characteristics of patients according to the expression of PD-L1
Characteristics |
PD-L1 positive |
PD-L1 negative |
P |
PD-L1 positive |
PD-L1 negative |
P |
|---|---|---|---|---|---|---|
Gender |
||||||
Male |
109(42.9%) |
145(57.1%) |
0.091 |
162(63.8%) |
92(36.2%) |
0.014 |
Female |
28(32.6%) |
58(67.4%) |
42(48.8%) |
44(51.2%) |
||
Age |
||||||
≤45 |
5(22.7%) |
17(77.3%) |
0.082 |
9(40.9%) |
13(59.1%) |
0.059 |
>45 |
132(41.5%) |
186(58.5%) |
195(61.3%) |
123(38.7%) |
||
WHO classification |
||||||
Tubular adenocarcinoma |
108(44.3%) |
136(55.7%) |
0.002 |
154(63.1%) |
90(36.9%) |
<0.001 |
Signet ring cell |
5(13.9%) |
31(86.1%) |
10(27.8%) |
26(72.2%) |
||
Other |
24(40.0%) |
36(60.0%) |
40(66.7%) |
20(33.3%) |
||
Histological grade |
||||||
low grade |
34(38.2%) |
55(61.8%) |
0.640 |
52(58.4%) |
37(41.6%) |
0.724 |
high grade |
103(41.0%) |
148(59.0%) |
152(60.6%) |
99(39.4%) |
||
Tumor size |
||||||
<5cm |
31(26.3%) |
87(73.7%) |
<0.001 |
61(51.7%) |
57(48.3%) |
0.023 |
≥5cm |
106(47.7%) |
116(52.3%) |
143(64.4%) |
79(35.6%) |
||
Vascular invasion |
||||||
Negative |
29(39.7%) |
44(60.3%) |
0.911 |
34(46.6%) |
39(53.4%) |
0.008 |
Positive |
108(40.4%) |
159(59.6%) |
170(63.7%) |
97(36.3%) |
||
Neural invasion |
||||||
Negative |
52(41.9%) |
72(58.1%) |
0.640 |
74(59.7%) |
50(40.3%) |
0.927 |
Positive |
85(39.4%) |
131(60.6%) |
130(60.2%) |
86(39.8%) |
||
Depth of invasion |
||||||
T1/T2 |
8(23.5%) |
26(76.5%) |
0.036 |
18(52.9%) |
16(47.1%) |
0.376 |
T3/T4 |
129(42.2%) |
177(57.8%) |
186(60.8%) |
120(39.2%) |
||
Lymph metastasis |
||||||
N0 |
34(52.3%) |
31(47.7%) |
0.028 |
43(66.2%) |
22(33.8%) |
0.260 |
N1/N2/N3 |
103(37.5%) |
172(62.5%) |
161(58.5%) |
114(41.5%) |
||
Distant metastasis |
||||||
M0 |
132(40.6%) |
193(59.4%) |
0.574 |
196(60.3%) |
129(39.7%) |
0.590 |
M1 |
5(33.3%) |
10(66.7%) |
8(53.3%) |
7(46.7%) |
||
TNM stage |
||||||
I-II |
50(52.1%) |
46(47.9%) |
0.005 |
67(69.8%) |
29(30.2%) |
0.021 |
III-IV |
87(35.7%) |
157(64.3%) |
137(56.1%) |
107(43.9%) |
Survival analysis of PD-1 and PD-L1/L2 pathway
Tumor size ≥5 cm, positive vascular invasion, and positive neural invasion were associated with poor GC prognosis (Supplementary Table 2). Patients with depth of invasion of T1/T2 had a longer OS than patients with depth of invasion of T3/T4 (log-rank P=0.027). Patients without lymph metastasis or any distant metastasis lived longer than patients with lymph metastasis or any distant metastasis (P<0.001 and P=0.003). Overall, patients with TNM stages I-II had better survival than those with TNM stages III-IV (P<0.001).
In univariate analysis, patients expressing PD-1 showed a better overall survival rate (log-rank P=0.024). The overexpression of PD-L1 in the TIICs appeared to be associated with better overall survival, although it did not reach statistical significance (log-rank P=0.063). PD-L2 expression in TCs and TIICs was not associated with overall survival (log-rank P=0.919 and P=0.452). Tumors were defined as overall positive for PD-L1 if PD-L1 was expressed in either TCs or TIICs. The same rule was applied to PD-L2. Patients with PD-1/PD-L1 co-expression had better prognosis (log-rank P=0.019). Patients with PD-1/PD-L2 co-expression also had better overall survival, although this did not reach statistical significance (log-rank P=0.065) (Figure 3 and Table 5).
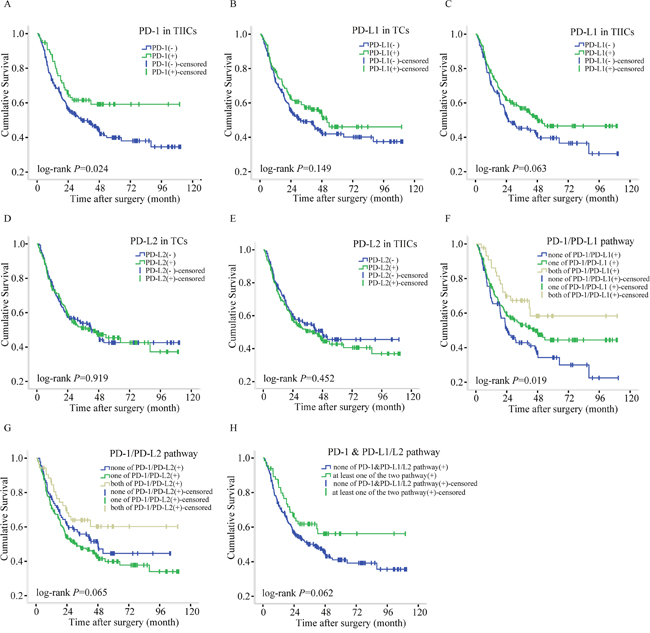
Figure 3: Survival plots for PD-1, PD-L1, and PD-L2 expression of gastric cancer. (A) Survival plots for PD-1 in TCs of gastric cancer. (B) Survival plots for PD-L1 in TCs of gastric cancer. (C) Survival plots for PD-L1 in TIICs of gastric cancer. (D) Survival plots for PD-L2 in TCs of gastric cancer. (E) Survival plots for PD-L2 in TIICs of gastric cancer. (F) Survival plots for PD-1/PD-L1 pathway of gastric cancer. (G) Survival plots for PD-1/PD-L2 pathway of gastric cancer. (H) Survival plots for PD-1 & PD-L1/L2 pathway of gastric cancer.
Table 5: Univariate and multivariate Cox regression test for PD-1 and PD-L1/L2 expression
Characteristics |
Patient(N) |
Death N (%) |
HR(95%CI) |
P |
HR(95%CI)a |
Pa |
|---|---|---|---|---|---|---|
PD-1 in TIICs |
||||||
Negative |
263 |
143(54.37) |
1.00 |
0.024 |
1.00 |
0.052 |
Positive |
77 |
29(37.66) |
0.63(0.42-0.94) |
0.67(0.45-1.00) |
||
PD-L1 in TCs |
||||||
Negative |
203 |
110(54.19) |
1.00 |
0.150 |
1.00 |
0.075 |
Positive |
137 |
62(45.25) |
0.80(0.58-1.09) |
0.74 (0.53-1.03) |
||
PD-L1 in TIICs |
||||||
Negative |
136 |
76(55.88) |
1.00 |
0.064 |
1.00 |
0.042 |
Positive |
204 |
96(47.06) |
0.75(0.56-1.02) |
0.72(0.53-0.99) |
||
PD-L1 overall |
||||||
Negative |
124 |
69(55.64) |
1.00 |
0.094 |
1.00 |
0.058 |
Positive |
216 |
103(47.69) |
0.77(0.57-1.05) |
0.74(0.54-1.01) |
||
PD-L2 in TCs |
||||||
Negative |
183 |
92(50.27) |
1.00 |
0.919 |
1.00 |
0.820 |
Positive |
157 |
80(50.96) |
1.02(0.75-1.37) |
0.97(0.71-1.31) |
||
PD-L2 in TIICs |
||||||
Negative |
133 |
64(48.12) |
1.00 |
0.452 |
1.00 |
0.342 |
Positive |
207 |
108(52.17) |
1.13(0.83-1.53) |
1.16(0.85-1.59) |
||
PD-L2 overall |
||||||
Negative |
117 |
56(47.86) |
1.00 |
0.352 |
1.00 |
0.366 |
Positive |
223 |
116(52.02) |
1.16(0.85-1.60) |
1.16(0.84-1.60) |
||
PD-1/PD-L1 pathway |
||||||
none of PD-1/PD-L1(+) |
91 |
55(60.43) |
1.00 |
1.00 |
||
one of PD-1/PD-L1 (+) |
204 |
101(49.51) |
0.74 (0.53-1.03) |
0.071 |
0.70(0.50-0.99) |
0.043 |
both of PD-1/PD-L1(+) |
45 |
16(35.56) |
0.47(0.27-0.83) |
0.009 |
0.48(0.27-0.84) |
0.010 |
PD-1/PD-L2 pathway |
||||||
none of PD-1/PD-L2(+) |
92 |
45(48.91) |
1.00 |
1.00 |
||
one of PD-1/PD-L2 (+) |
195 |
108(55.38) |
1.22(0.86-1.73) |
0.257 |
1.20(0.84-1.70) |
0.323 |
both of PD-1/PD-L2(+) |
53 |
19(35.85) |
0.71(0.41-1.21) |
0.203 |
0.75(0.44-1.28) |
0.289 |
PD-1 & PD-L1/L2 pathway |
||||||
none of PD-1& PD-L1/L2 pathway(+) |
274 |
146(53.28) |
1.00 |
1.00 |
||
at least one of the two pathway(+) |
66 |
26(30.39) |
0.67(0.44-1.02) |
0.064 |
0.68(0.45-1.04) |
0.076 |
HR: Hazard ratio a: 95%CI and P values were calculated with multivariate Cox regression with the enter method including the variables that P<0.05 from the univariate analysis, such as tumor size, vascular invasion, neural invasion and TNM stage.
Multivariate Cox regression showed that PD-1 expression in TIICs seemed to be correlated with better survival, but this association did not reach statistical significance (Table 5; Hazard Ratio (HR)=0.67, 95%CI: 0.45-1.00, P=0.052). PD-L1 expression in TIICs was independently associated with better GC prognosis (HR=0.72, 95%CI: 0.53-0.99, P=0.042). The co-expression of PD-1 and PD-L1 was independently associated with better prognosis of GC, and indicated a dose-effect on the mortality risk of cancer patients (P-value for trend=0.005). Compared to the group with no PD-1/PD-L1 expression, the HR of the group with either PD-1 or PD-L1 expression was 0.70 (95%CI=0.50-0.99, P=0.043). In the PD-1/PD-L1 co-expression group, the HR was 0.48 (95%CI=0.27-0.84, P=0.010). PD-L2 was not independently associated with GC prognosis, in either TCs or TIICs (P>0.05). The presence of at least one of the PD-1/PD-L1 or PD-1/PD-L2 combinations was positively connected and almost correlated with better survival, but without statistical significance (HR=0.68, 95%CI: 0.26-1.00, P=0.076). Additionally, a higher TNM stage was always independently associated with worse prognosis of GC (P<0.001, data not shown).
PD-1 and PD-L1/L2 mRNA expression
Among the 340 GC patients for whom IHC staining was conducted, twenty-one GC patients were randomly selected from the ‘EBV positive’ (7 cases) and ‘EBV negative’ (14 cases) groups to determine PD-1, PD-L1, and PD-L2 mRNA expression by qRT-PCR. The overall expression level of PD-1 was increased in 16 (76.19%) GC samples (Figure 4A). PD-L1 and PD-L2 were both up-regulated in 18 (85.71%) GC samples (Figure 4B and 4C), which indicates that the expression of PD-1, PD-L1 and PD-L2 mRNA was frequently up-regulated in gastric cancer tissues. We also found that the expression of PD-L1 and PD-L2 was positively correlated with PD-1 expression (rs=0.445, P=0.043 and rs=0.562, P=0.008, respectively). PD-L2 expression also increased as PD-L1 expression increased (Figure 4D to 4F). To confirm our results, we analyzed mRNA levels of the same genes in 444 gastric cancer and 32 normal samples from the TCGA database. Consistent with our results, the PD-1, PD-L1, and PD-L2 mRNA levels were up-regulated in the GC tissues compared to the normal samples (P=0.010, P<0.001 and P=0.018, respectively) and positively correlated with one other (Supplementary Table 3).
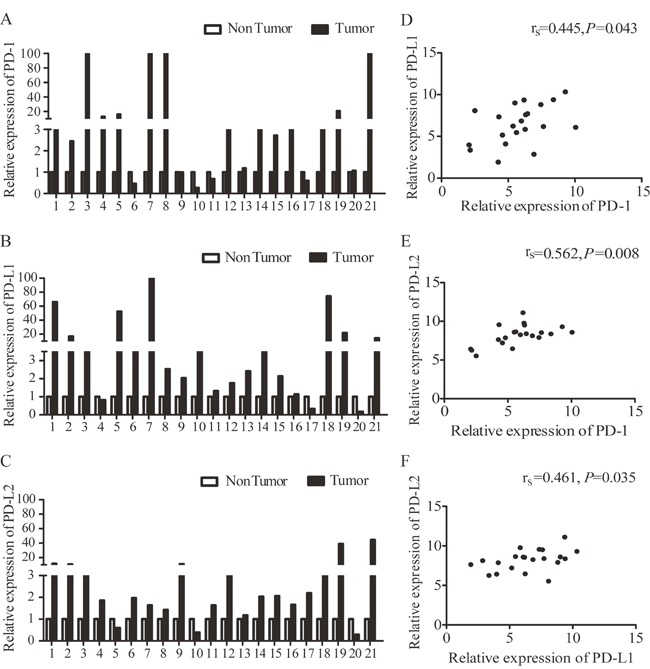
Figure 4: Expression of PD-1 and PD-L1/L2 mRNA. (A) PD-1 expression in GC tumors and paired adjacent tissues (located > 3 cm away from the tumor). (B) PD-L1 expression in GC tumors and paired adjacent tissues. (C) PD-L2 expression in GC tumors and paired adjacent tissues. (D) Correlation of mRNA levels of PD-1 and PD-L1. (E) Correlation of mRNA levels between PD-1 and PD-L2. (F) Correlation of mRNA levels between PD-L1 and PD-L2. rs represents Spearman’s correlation coefficient.
Unlike the protein levels, the PD-L1 mRNA levels did not display significant differences between the EBV-positive and EBV-negative patients (P=0.582). To better understand this, we next analyzed the correlation between PD-L1 mRNA and protein levels. We found that PD-L1 mRNA expression in the PD-L1 protein-positive group was not different from that in the PD-L1 protein-negative group (Supplementary Figure 2).
DISCUSSION
The present study was performed on a large and well-characterized cohort to simultaneously evaluate the expression of PD-1, PD-L1, and PD-L2 in TCs and TIICs of GC patients. PD-L1 was over-expressed in EBV-infected GC patients. The levels of PD-1, PD-L1, and PD-L2 mRNA were up-regulated in GC tissues and positively correlated with each other. The co-expression of PD-1 and PD-L1 was found to be a favorable prognostic factor in gastric cancer.
A meta-analysis of 10 studies showed PD-L1 in the TCs of 25% to 65% of Asian (especially in Japanese and Chinese) patients [25], similar to our results (40.3% in TCs). As the TCGA revealed, EBV-positive GC might have PD-L1 gene amplification, and EBV-positive GC has often been characterized by a marked lymphoid infiltration and higher immune response [24, 26]. Considering these findings, EBV-positive GC might have higher PD-L1 expression. In fact, PD-L1 was more frequently expressed in EBV-infected GC cases in both TCs and TIICs in our study, consistent with another study in a Japanese cohort [27]. However, no difference in PD-L1 mRNA level was found between the EBV-positive and EBV-negative patients. Over 70% of EBV-infected GC patients did not receive any radiotherapy or chemotherapy after surgery. EBV-positive patients may benefit from the PD-L1 targeted therapy due to up-regulated PD-L1 expression, but the EBV infection itself had limited value in predicting the prognosis of gastric cancer.
We found that PD-L1 protein and mRNA levels were not correlated in gastric cancer. This phenomenon has also been observed in breast cancer [28]. One possible reason could be that the testing for PD-L1 mRNA is always done simultaneously on TCs and TIICs. However, the expression of PD-L1 protein in the TCs and TIICs are evaluated separately and combined as simply positive expression or negative expression. Another possible reason could be that there is some post-transcriptional regulation taking place. Similar to the mRNA expression, biomarkers that expressed in tumor cells or immune cells could not be distinguished by western blot. Western blot also presented a trend that aligned with the IHC results, especially in the patients with positive expression of PD-L1 both in TCs and TIICs (Supplementary Figure 3).
Helicobacter pylori strains were enriched among the cagPAI pathogenicity gene variants in Asian GC patients [29]. A recent study reported that the expression of PD-L1 could be up-regulated through H. pylori type 4 secretion system (T4SS) and CagA protein in H. pylori-infected gastric cancer cell lines [30]. We also compared the levels of PD-L1 mRNA in H. pylori positive and H. pylori negative GC. Using the data from the TCGA, we found that there was no association between the level of PD-L1 mRNA and H. pylori-infected gastric cancer (Supplementary Table 4).
We determined that PD-L1 expression in the TIICs was an independent predictive biomarker in the prognosis of GC, and was associated with better OS. The same result was found in a German cohort [30] and Japanese cohort [27]. However, the meta-analysis reported that PD-L1 expression was associated with poor OS in GC. PD-L1 is expressed in TCs and TIICs [31–33], but most of the studies included in the meta-analysis only assessed PD-L1 expression in TCs.
PD-L1 expression in TIICs can have prognostic value for other cancers, especially in those tumors that are enriched with infiltrating immune cells [34, 35]. PD-L1 expression in TCs and TIICs might involve different mechanisms. A recent transcriptome analysis reported that PD-L1 expression in TCs could be driven by tumor-intrinsic mechanisms, such as the activation of endogenous oncogenes and related signaling pathways [36]. However, PD-L1 expression in TIICs is up-regulated through adaptive mechanisms, including exogenous inflammation-mediated immune attack, which indicates preexisting immunity [35, 37]. PD-L1 expression in TIICs has a stronger relationship with the cancer immune response, and it depends on the tumor microenvironment compared with the tumor-based PD-L1.
Gastric cancer is an inflammation-related disease, and infiltration of tumor-specific T cells has been observed in the process of GC development. Previous studies have shown that the expression of PD-L1 in TIICs was positively correlated with the number of CD4+ T lymphocytes and CD8+ T lymphocytes [38], and a high level of expression of CD4+ and CD8+ T cells has been correlated with better cancer survival [36, 39]. In addition, our results showed that the positive expression of PD-L1 was more common at the interface between the tumor and non-neoplastic tissues and was more frequently seen in patients with TNM stages I-II; thus, to some extent, the expression of PD-L1 indicated an effective immune response in the early stages of cancer progression. Second, most of the mentioned studies have used tumor tissue microarrays (TMAs) to conduct IHC staining. However, TMAs only contain a limited amount of tissue samples (diameter 0.6-2 mm), which result in poor representation of the tumor. The expression of PD-L1 in GC displays intra-tumoral heterogeneity. A recent study investigated the concordance rate of PD-L1 IHC scores between two TMAs and found that the scores were frequently discordant with each other (the discord an cerate was 83.2% in TCs and 65.3% in TIICs) [27]. If only TMAs are used to conduct the IHC staining, there might be a higher risk of non-representation, leading to a higher rate of false-negative results. Furthermore, TMAs are usually constructed with the tumor core with a high concentration of tumor cells. However, tumor inflating immune cells are usually concentrated at the invasion front or stroma, rather than at the central part of tumors. As a result, TMAs are not suitable for evaluating biomarkers that are expressed in TIICs. To solve these problems, we used slides with whole tumor sections to assess the expression of PD-L1 in TCs and TIICs to improve the accuracy of testing. Third, the scoring systems that are used for the assessment of IHC staining are varied. When assessing the expression of PD-L1/L2 in tumor cells, we used the immunoreactive score (IRS) to evaluate the IHC staining. IRS is a semi-quantitative evaluation system and considers the percentages of the stained cells together with the staining intensity. In addition, the percentages of the stained cells were categorical and could be non-uniform, as most of the slides showed low percentages of PD-L1/L2 positive stained cells. Thus, in our opinion, IRS was the appropriate method for testing the expression of PD-L1/L2 in TCs. Additionally, different cutoff values for distinguishing the positive and negative expression of PD-L1 might cause heterogeneity among different studies. Similar to study of Christine et al [30], we used an IRS score of more than 2 as the positive cutoff point when assessing the positive expression of PD-L1 and PD-L2 in TCs. The expression of PD-L1 in TIICs was mainly limited to weak or moderate staining intensity; hence, only the presence or absence of staining was evaluated in most studies that investigated the PD-L1 expression in TIICs [40–42]. Since the minimal expression of PD-L1 might have no effect on tumor biology [30], in our study, “≥5% positive” was classified as “PD-L1-positive in TIICs”.
Though PD-L1 was more frequently expressed in EBV-positive GC patients and PD-L1 positive expression was related to a better survival of GC in our study, EBV infection was not associated with GC prognosis. Further analysis for the clinicopathological features of EBV positive patients indicated that, over 70% EBV infected GC patients not received any radiotherapy or chemotherapy after surgery. In addition to this, only 17 EBV positive GC patients were included in our study, and lead limited statistical power in performing the survival analysis between EBV positive and negative groups.
Through multivariate analysis, we found that PD-1 and PD-L1 co-expression was independently associated with a better prognosis of gastric cancer. Similar results have been observed in a recent study of cutaneous angiosarcoma [43]. The qRT-PCR results also showed that PD-L1 mRNA levels were positively correlated with PD-1 mRNA levels. This suggested that PD-1 and PD-L1 may be co-expressed in cancers. PD-L1 has been associated with increasing numbers of CD4+ and CD8+ T cells [38], both of which express PD-1 [43]. Thus, the binding of PD-1 and PD-L1 might indicate an effective immune response, especially with a favorable immune microenvironment profile [44].
Although the ongoing clinical trials have indicated that PD-L1-positive tumors show higher response rates to anti-PD-1/PD-L1 therapy, good responses to treatment have also been observed in patients with PD-L1-negative tumors [45]. This suggests that besides PD-L1, PD-1 could also bind to other ligands such as PD-L2, and might have effects on the tumor immune response. Our results indicated that PD-L2 was up-regulated in gastric cancer, and this same trend was observed in the TCGA database. We found that overexpression of PD-L2 in TCs or TIICs was not related to the prognosis of GC.
The relationship between PD-L2 expression and cancer prognosis remains controversial. Ohigashi et al [46] reported the positive expression of PD-L2 to be associated with worse prognosis in esophageal cancer patients and in hepatocellular carcinoma [47]. However, the majority of studies have found no correlations between PD-L2 expression and prognosis in other cancers, such as pancreatic cancer, ovarian cancer and pulmonary squamous cell carcinoma, similar to our findings [48–50]. The distinct expression and regulation patterns could partly explain the different predictive values of PD-L1 and PD-L2. First, PD-L1 is widely expressed in a variety of immune cells. When an organism receives strong inflammatory signals, the non-immune cells are also able to up regulate PD-L1 [51, 52]. Compared to PD-L1, PD-L2 expression is much more restricted to the antigen-presenting cells, including macrophages and dendritic cells [53]. This indicates that PD-L1 is more comprehensive in reflecting the immune microenvironment of cancer due to its broader expression. Second, PD-L1 and PD-L2 are differentially regulated by T helper 1 (Th1) and T helper 2 (Th2) cells. In the context of antitumor immunity, Th1 responses are more potent, especially in early stages of tumor progression. Th1/Th2 balance is disrupted as the number of Th2 cells increase, and Th2 responses appear to strengthen tumor immune escape. P’ng Loke et al [54] reported that Th1 cells induce PD-L1 expression, whereas Th2 cells induce PD-L2 expression. Although PD-L2-targeted immune therapy has clinical effects in cancer, the prognostic value of PD-L2 seems to be lower than that of PD-L1.
One limitation of our study is that only a few patients could provide blood samples for the detection of H. pylori infection for the investigation of the association between the expression of PD-1 and PD-L1/L2 and H. pylori-infected GC. This could have affected the level of statistical efficiency. Another limitation was that despite the median follow-up time being over 47 months, only 50% of the patients had died. Therefore, the follow-up period needs to be extended. Our study was based at a single site, and a multi-center study needs to be conducted in the future. The levels and patterns of PD-1 and PD-L1/L2 may change during surgery and treatment, so monitoring those changes may be helpful in predicting tumor recurrence.
MATERIALS AND METHODS
Study population
Patients were recruited from the Department of Gastric and Colorectal Surgery in the First Hospital of Jilin University (Changchun, China) from 2007 to 2014. A total of 357 patients who were newly diagnosed with gastric cancer and had undergone a physical tumorectomy for adenocarcinoma of the stomach qualified for the study. Before surgery, none of the patients had received chemotherapy, radiotherapy, or anti-PD-1/PD-L1 treatment. Two independent pathologists confirmed each patient’s diagnosis. The principal clinical characteristics included gender, age, WHO classification of the primary tumor, tumor sizes, TNM stage according to AJCC/UICC, 2010 classifications, and chemotherapy status.
All patients underwent follow-up after the tumorectomy in the third month, sixth month, and every year until death or the last scheduled follow-up. The duration from the date of surgery to the date of death or the last successful interview date was defined as the survival time. Patients who died due to complications of the surgical procedure during the perioperative period or were lost at the first time of interview were excluded in the survival analysis. Before enrollment, all participants signed informed consent forms. All of the analyses in our study were performed after surgery. Our study was approved by the Institutional Review Board of the First Hospital of Jilin University.
Tests of H. pylori and Epstein-Barr virus infection
The Helicobacter pylori IgG enzyme-linked immunosorbent assay (ELISA) test (BIOHIT HealthCare, Finland) was used to diagnose H. pylori infection in the patients’ sera. A value of 30 EIU or more indicated H. pylori infection. The tumors were labelled by DNA in situ hybridization (ISH-5021, ZSGB-BIO, China) for EBV infection using tissue microarrays (MiniCore, Alphelys, France). Nuclei stained brown indicated EBV infection.
Immunohistochemistry
Histological sections (4 μm) of 10% formalin-fixed paraffin-embedded tumor specimens of GC patients were used for immunohistochemical (IHC) staining. We have tested different dilutions of antibodies against PD-1, PD-L1/L2 in patients during the preliminary experiment and the optimal IHC dilutions of each antibody had been well determined. From the instructions and related references about the antibodies above, there was no evidence that the antibodies had a neutralizing effect. Finally, the sections were stained with primary monoclonal antibodies against PD-1 (ab52587, dilution: 1/200, Abcam, Cambridge, UK), PD-L1 (E1L3N, dilution: 1/200, Cell Signaling Technology, Cambridge, UK), and PD-L2 (clone #176611, dilution: 1/200, R&D Systems, Minneapolis, USA). After routine dewaxing, the slides were boiled for 2min (20 min for PD-L1) in a pressure cooker in citrate buffer (ethylenediamine tetraaceticacid for PD-L1 without high pressure) for antigen retrieval. Endogenous peroxidase activity was blocked using 3% H2O2. The sections were pre-treated with 10% normal goat serum (MXB, Fuzhou, China) before the primary antibodies were applied for 90 min at room temperature. The sections were further incubated with horseradish peroxidase-labeled secondary antibody (MXB, Fuzhou, China) for 15 min at room temperature. The signals were visualized with 3, 3-diaminobenzidine (DAB), and then the slides were counterstained with Mayer’s hematoxylin.
Evaluation of PD-1, PD-L1, and PD-L2 expression
The PD-1 staining was assessed in TIICs by two experienced pathologists blinded to the clinical data. A proportion of stained cells ≥5% in TIICs with a membranous staining was considered PD-1 positive. For PD-L1 and PD-L2, expression was predominantly observed in the cell membrane and cytoplasm. The IRS system was used to assess the staining intensity and percentages of the tumor cells. The intensity and expression prevalence was subdivided into four categories each: 0 (no immunostaining; <5% expression), 1 (weak; 5 to 19% expression), 2 (moderate; 20 to 49% expression), or 3 (strong; ≥50% expression), and the percentages were subdivided into four grades: 0 (<5% expression), 1 (5 to 19% expression), 2 (20 to 49% expression) and 3 (≥50% expression). Adding the intensity and percentage scores resulted in IRS values ranging from 0 to 6. A total score of more than 2 was defined as positive expression of PD-L1 or PD-L2 in TCs. For the evaluation of the expression of PD-L1 and PD-L2 in TIICs, the cases were simply scored as negative (<5% expression) and positive (≥5% expression).
mRNA quantification
Among the 340 GC patients for whom IHC staining was conducted, total mRNA was extracted from 21 patients’ tumor tissues and paired adjacent non-tumorous tissues (located > 3 cm away from the tumor and confirmed by the pathologists with H&E staining). After reverse transcription, cDNAs were amplified in the presence of primers, and glyceraldehyde 3-phosphate dehydrogenase (GAPDH) was used as the endogenous reference gene. The expression of PD-1, PD-L1, and PD-L2 was quantified using specific primers (Qiagen), and the mRNA levels of these three genes were analyzed with the 2-ΔΔCt method.
Western blot analysis
The total protein of gastric tumor tissues and paired adjacent non-tumorous tissues was extracted using a mammalian protein extraction kit (Kangwei, China), and the concentration of various proteins was measured using a BCA kit (Kangwei, China). The levels of PD-1 (1:200, Abcam), PD-L1 (1:2000, Cell Signaling Technology), PD-L2 (1:500, R&D Systems), and GAPDH (1:1000, Abcam) were measured with ECL reagents (Thermo Fisher Scientific) using Molecular Imager Chemi Dox XRS+ imaging system (Biorad, California, USA).
Statistical analysis
Categorical variables were represented as frequency (percentage) and compared using the χ2 test. Continuous variables with normal distribution were represented as the mean ± standard deviation, and compared by Student’s t-test. Continuous variables with non-normal distribution were represented by the median (Q1-Q3), and compared using Wilcoxon’s rank-sum test. The log-rank test was used to compare Kaplan-Meier survival curves. Univariate and multivariate Cox regressions were performed to assess the hazard ratios (HRs) and 95% CIs of the possible prognostic factors. The correlation between PD-1, PD-L1, and PD-L2 mRNA levels were calculated with Spearman’s rank correlation. P<0.05 was considered to be statistically significant. All of the analyses were conducted with the SPSS program (version 17.0, Chicago, IL, USA) or GraphPad Prism 5.0.
CONCLUSION
PD-L1 was over-expressed in EBV-infected GC. The PD-1, PD-L1, and PD-L2 mRNA levels were up-regulated in GC tissues and positively correlated with one another. Co-expression of PD-1 and PD-L1, but not PD-L2, was a favorable prognostic marker in gastric cancer. The comprehensive evaluation of tumor cells and tumor-infiltrating immune cells could help in predicting the prognosis of gastric cancers and selecting patients who might benefit from targeted treatment.
Abbreviations
PD-1: programmed cell death 1; PD-L1: programmed cell death ligand 1; PD-L2: programmed cell death ligand 2; GC: gastric cancer; TCs: tumor cells; TIICs: tumor-infiltrating immune cells; EBV: Epstein-Barr virus; Hp: Helicobacter pylori; HR: hazard ratio; CI: confidence interval; CTLA-4: cytotoxic T-lymphocyte–associated protein 4; NSCLC: non-small cell lung cancer; RCC: renal cell carcinoma; TCGA: The Cancer Genome Atlas; EBVaGC: EBV positive GC; XELOX: a combination of capecitabine and oxaliplatin; FLOFOX: a combination of 5-fluorouracil, leucovorin and oxaliplatin; IHC: immunohistochemistry; H&E: hematoxylin-eosin; OS: overall survival; T4SS: type 4 secretion system; TMAs: tumor tissue microarrays; IRS: immunoreactive score; Th1: T helper 1; Th2: T helper 2; AJCC/UICC: Union for International Cancer Control/American Joint Committee on Cancer; ELISA: enzyme-linked immunosorbent assay; GAPDH: glyceraldehyde 3-phosphate dehydrogenase.
Author contributions
Jing Jiang and Quan Wang planned experiments. Yanhua Wu, Donghui Cao, Limei Qu, Xueyuan Cao, Zhifang Jia, and Tiancheng Zhao performed experiments and analyzed data. Yanhua Wu and Jing Jiang wrote the manuscript.
CONFLICTS OF INTEREST
No conflicts of interest to report.
FUNDING
This work was supported by National Natural Science Foundation of China (No. 81373084 and 81673145), the Scientific and Technological Development Program of Jilin Province (20160519016JH), the National Natural Science Foundation of Jilin Province (2016487), the Norman Bethune Program of Jilin University (No.2013025), and the Youth Fund of the First Hospital of Jilin University (No. JDYY72016049).
REFERENCES
1. Leung WK, Wu MS, Kakugawa Y, Kim JJ, Yeoh KG, Goh KL, Wu KC, Wu DC, Sollano J, Kachintorn U, Gotoda T, Lin JT, You WC, et al. Screening for gastric cancer in Asia: current evidence and practice. Lancet Oncol. 2008; 9: 279-87. https://doi.org/10.1016/S1470-2045(08)70072-X.
2. Van Cutsem E, Sagaert X, Topal B, Haustermans K, Prenen H. Gastric cancer. Lancet. 2016; 388: 2654-64. https://doi.org/10.1016/S0140-6736(16)30354-3.
3. Chen W, Zheng R, Baade PD, Zhang S, Zeng H, Bray F, Jemal A, Yu XQ, He J. Cancer statistics in China, 2015. CA Cancer J Clin. 2016; 66: 115-32. https://doi.org/10.3322/caac.21338.
4. Alsina M, Moehler M, Hierro C, Guardeno R, Tabernero J. Immunotherapy for gastric cancer: a focus on immune checkpoints. Target Oncol. 2016; 11: 469-77. https://doi.org/10.1007/s11523-016-0421-1.
5. Brahmer JR, Tykodi SS, Chow LQ, Hwu WJ, Topalian SL, Hwu P, Drake CG, Camacho LH, Kauh J, Odunsi K, Pitot HC, Hamid O, Bhatia S, et al. Safety and activity of anti-PD-L1 antibody in patients with advanced cancer. N Engl J Med. 2012; 366: 2455-65. https://doi.org/10.1056/NEJMoa1200694.
6. Park JJ, Omiya R, Matsumura Y, Sakoda Y, Kuramasu A, Augustine MM, Yao S, Tsushima F, Narazaki H, Anand S, Liu Y, Strome SE, Chen L, et al. B7-H1/CD80 interaction is required for the induction and maintenance of peripheral T-cell tolerance. Blood. 2010; 116: 1291-8. https://doi.org/10.1182/blood-2010-01-265975.
7. Boussiotis VA. Molecular and biochemical aspects of the PD-1 checkpoint pathway. N Engl J Med. 2016; 375: 1767-78. https://doi.org/10.1056/NEJMra1514296.
8. Dong Y, Sun Q, Zhang X. PD-1 and its ligands are important immune checkpoints in cancer. Oncotarget. 2017; 8: 2171-86. https://doi.org/10.18632/oncotarget.13895.
9. Zhang T, Xie J, Arai S, Wang L, Shi X, Shi N, Ma F, Chen S, Huang L, Yang L, Ma W, Zhang B, Han W, et al. The efficacy and safety of anti-PD-1/PD-L1 antibodies for treatment of advanced or refractory cancers: a meta-analysis. Oncotarget. 2016; 7: 73068-79. https://doi.org/10.18632/oncotarget.12230.
10. Lote H, Cafferkey C, Chau I. PD-1 and PD-L1 blockade in gastrointestinal malignancies. Cancer Treat Rev. 2015; 41: 893-903. https://doi.org/10.1016/j.ctrv.2015.09.004.
11. Ma HY, Liu XZ, Liang CM. Inflammatory microenvironment contributes to epithelial-mesenchymal transition in gastric cancer. World J Gastroenterol. 2016; 22: 6619-28. https://doi.org/10.3748/wjg.v22.i29.6619.
12. Darb-Esfahani S, Kunze CA, Kulbe H, Sehouli J, Wienert S, Lindner J, Budczies J, Bockmayr M, Dietel M, Denkert C, Braicu I, Johrens K. Prognostic impact of programmed cell death-1 (PD-1) and PD-ligand 1 (PD-L1) expression in cancer cells and tumor-infiltrating lymphocytes in ovarian high grade serous carcinoma. Oncotarget. 2016; 7: 1486-99. https://doi.org/10.18632/oncotarget.6429.
13. Sterlacci W, Fiegl M, Droeser RA, Tzankov A. Expression of PD-L1 identifies a subgroup of more aggressive non-small cell carcinomas of the lung. Pathobiology. 2016; 83: 267-75. https://doi.org/10.1159/000444804.
14. Hou J, Yu Z, Xiang R, Li C, Wang L, Chen S, Li Q, Chen M, Wang L. Correlation between infiltration of FOXP3+ regulatory T cells and expression of B7-H1 in the tumor tissues of gastric cancer. Exp Mol Pathol. 2014; 96: 284-91. https://doi.org/10.1016/j.yexmp.2014.03.005.
15. Kawazoe A, Kuwata T, Kuboki Y, Shitara K, Nagatsuma AK, Aizawa M, Yoshino T, Doi T, Ohtsu A, Ochiai A. Clinicopathological features of programmed death ligand 1 expression with tumor-infiltrating lymphocyte, mismatch repair, and Epstein–Barr virus status in a large cohort of gastric cancer patients. Gastric Cancer. 2016. https://doi.org/10.1007/s10120-016-0631-3.
16. Saito R, Abe H, Kunita A, Yamashita H, Seto Y, Fukayama M. Overexpression and gene amplification of PD-L1 in cancer cells and PD-L1+ immune cells in Epstein–Barr virus-associated gastric cancer: the prognostic implications. Mod Pathol. 2017; 30: 427-39. https://doi.org/10.1038/modpathol.2016.202.
17. Chuah SK, Tsay FW, Hsu PI, Wu DC. A new look at anti-Helicobacter pylori therapy. World J Gastroenterol. 2011; 17: 3971-5. https://doi.org/10.3748/wjg.v17.i35.3971.
18. Lee YC, Chiang TH, Chou CK, Tu YK, Liao WC, Wu MS, Graham DY. Association between Helicobacter pylori eradication and gastric cancer incidence: a systematic review and meta-analysis. Gastroenterology. 2016; 150: 1113-24 e5. https://doi.org/10.1053/j.gastro.2016.01.028.
19. Cardenas-Mondragon MG, Torres J, Flores-Luna L, Camorlinga-Ponce M, Carreon-Talavera R, Gomez-Delgado A, Kasamatsu E, Fuentes-Panana EM. Case-control study of Epstein-Barr virus and Helicobacter pylori serology in Latin American patients with gastric disease. Br J Cancer. 2015; 112: 1866-73. https://doi.org/10.1038/bjc.2015.175.
20. Fuentes-Panana EM, Morales-Sanchez A. Epstein-Barr virus-associated gastric cancer and potential mechanisms of oncogenesis. Curr Cancer Drug Targets. 2016. doi:
21. Chang WJ, Du Y, Zhao X, Ma LY, Cao GW. Inflammation-related factors predicting prognosis of gastric cancer. World J Gastroenterol. 2014; 20: 4586-96. https://doi.org/10.3748/wjg.v20.i16.4586.
22. Yong X, Tang B, Xiao YF, Xie R, Qin Y, Luo G, Hu CJ, Dong H, Yang SM. Helicobacter pylori upregulates Nanog and Oct4 via Wnt/beta-catenin signaling pathway to promote cancer stem cell-like properties in human gastric cancer. Cancer Lett. 2016; 374: 292-303. https://doi.org/10.1016/j.canlet.2016.02.032.
23. Chen XZ, Chen H, Castro FA, Hu JK, Brenner H. Epstein-Barr virus infection and gastric cancer: a systematic review. Medicine (Baltimore). 2015; 94: e792. https://doi.org/10.1097/md.0000000000000792.
24. Cancer Genome Atlas Research Network. Comprehensive molecular characterization of gastric adenocarcinoma. Nature. 2014; 513: 202-9. https://doi.org/10.1038/nature13480.
25. Zhang M, Dong Y, Liu H, Wang Y, Zhao S, Xuan Q, Wang Y, Zhang Q. The clinicopathological and prognostic significance of PD-L1 expression in gastric cancer: a meta-analysis of 10 studies with 1,901 patients. Sci Rep. 2016; 6: 37933. https://doi.org/10.1038/srep37933.
26. Sunakawa Y, Lenz HJ. Molecular classification of gastric adenocarcinoma: translating new insights from the cancer genome atlas research network. Curr Treat Options Oncol. 2015; 16: 17. http://doi.org/10.1007/s11864-015-0331-y.
27. Kawazoe A, Kuwata T, Kuboki Y, Shitara K, Nagatsuma AK, Aizawa M, Yoshino T, Doi T, Ohtsu A, Ochiai A. Clinicopathological features of programmed death ligand 1 expression with tumor-infiltrating lymphocyte, mismatch repair, and Epstein-Barr virus status in a large cohort of gastric cancer patients. Gastric Cancer. 2017; 20: 407-15. https://doi.org/10.1007/s10120-016-0631-3.
28. Ali HR, Glont SE, Blows FM, Provenzano E, Dawson SJ, Liu B, Hiller L, Dunn J, Poole CJ, Bowden S, Earl HM, Pharoah PD, Caldas C. PD-L1 protein expression in breast cancer is rare, enriched in basal-like tumours and associated with infiltrating lymphocytes. Ann Oncol. 2015; 26: 1488-93. https://doi.org/10.1093/annonc/mdv192.
29. Azuma T. Helicobacter pylori CagA protein variation associated with gastric cancer in Asia. J Gastroenterol. 2004; 39: 97-103. https://doi.org/10.1007/s00535-003-1279-4.
30. Boger C, Behrens HM, Mathiak M, Kruger S, Kalthoff H, Rocken C. PD-L1 is an independent prognostic predictor in gastric cancer of Western patients. Oncotarget. 2016; 7: 24269-83. https://doi.org/10.18632/oncotarget.8169.
31. Du Z, Abedalthagafi M, Aizer AA, McHenry AR, Sun HH, Bray MA, Viramontes O, Machaidze R, Brastianos PK, Reardon DA, Dunn IF, Freeman GJ, Ligon KL, et al. Increased expression of the immune modulatory molecule PD-L1 (CD274) in anaplastic meningioma. Oncotarget. 2015; 6: 4704-16. https://doi.org/10.18632/oncotarget.3082.
32. Paiva B, Azpilikueta A, Puig N, Ocio EM, Sharma R, Oyajobi BO, Labiano S, San-Segundo L, Rodriguez A, Aires-Mejia I, Rodriguez I, Escalante F, de Coca AG, et al. PD-L1/PD-1 presence in the tumor microenvironment and activity of PD-1 blockade in multiple myeloma. Leukemia. 2015; 29: 2110-3. https://doi.org/10.1038/leu.2015.79.
33. Koirala P, Roth ME, Gill J, Piperdi S, Chinai JM, Geller DS, Hoang BH, Park A, Fremed MA, Zang X, Gorlick R. Immune infiltration and PD-L1 expression in the tumor microenvironment are prognostic in osteosarcoma. Sci Rep. 2016; 6: 30093. https://doi.org/10.1038/srep30093.
34. Botti G, Collina F, Scognamiglio G, Rao F, Peluso V, De Cecio R, Piezzo M, Landi G, De Laurentiis M, Cantile M, Di Bonito M. Programmed death ligand 1 (PD-L1) tumor expression is associated with a better prognosis and diabetic disease in triple negative breast cancer patients. Int J Mol Sci. 2017; 18:E459. https://doi.org/10.3390/ijms18020459.
35. Kim HR, Ha SJ, Hong MH, Heo SJ, Koh YW, Choi EC, Kim EK, Pyo KH, Jung I, Seo D, Choi J, Cho BC, Yoon SO. PD-L1 expression on immune cells, but not on tumor cells, is a favorable prognostic factor for head and neck cancer patients. Sci Rep. 2016; 6: 36956. https://doi.org/10.1038/srep36956.
36. Zeng DQ, Yu YF, Ou QY, Li XY, Zhong RZ, Xie CM, Hu QG. Prognostic and predictive value of tumor-infiltrating lymphocytes for clinical therapeutic research in patients with non-small cell lung cancer. Oncotarget. 2016; 7: 13765-81. https://doi.org/10.18632/oncotarget.7282.
37. Pardoll DM. The blockade of immune checkpoints in cancer immunotherapy. Nat Rev Cancer. 2012; 12: 252-64. https://doi.org/10.1038/nrc3239 nrc3239.
38. Shurell E, Singh AS, Crompton JG, Jensen S, Li Y, Dry S, Nelson S, Chmielowski B, Bernthal N, Federman N, Tumeh P, Eilber FC. Characterizing the immune microenvironment of malignant peripheral nerve sheath tumor by PD-L1 expression and presence of CD8+ tumor infiltrating lymphocytes. Oncotarget. 2016; 7: 64300-8. https://doi.org/10.18632/oncotarget.11734.
39. Hwang WT, Adams SF, Tahirovic E, Hagemann IS, Coukos G. Prognostic significance of tumor-infiltrating T cells in ovarian cancer: a meta-analysis. Gynecol Oncol. 2012; 124: 192-8. https://doi.org/10.1016/j.ygyno.2011.09.039.
40. Hou J, Yu Z, Xiang R, Li C, Wang L, Chen S, Li Q, Chen M, Wang L. Correlation between infiltration of FOXP3+ regulatory T cells and expression of B7-H1 in the tumor tissues of gastric cancer. Exp Mol Pathol. 2014; 96: 284-91. https://doi.org/10.1016/j.yexmp.2014.03.005.
41. Jo JC, Kim M, Choi Y, Kim HJ, Kim JE, Chae SW, Kim H, Cha HJ. Expression of programmed cell death 1 and programmed cell death ligand 1 in extranodal NK/T-cell lymphoma, nasal type. Ann Hematol. 2017; 96: 25-31. https://doi.org/10.1007/s00277-016-2818-4.
42. Kiyasu J, Miyoshi H, Hirata A, Arakawa F, Ichikawa A, Niino D, Sugita Y, Yufu Y, Choi I, Abe Y, Uike N, Nagafuji K, Okamura T, et al. Expression of programmed cell death ligand 1 is associated with poor overall survival in patients with diffuse large B-cell lymphoma. Blood. 2015; 126: 2193-201. https://doi.org/10.1182/blood-2015-02-629600.
43. Honda Y, Otsuka A, Ono S, Yamamoto Y, Seidel JA, Morita S, Hirata M, Kataoka TR, Takenouchi T, Fujii K, Kanekura T, Okubo Y, Takahashi K, et al. Infiltration of PD-1-positive cells in combination with tumor site PD-L1 expression is a positive prognostic factor in cutaneous angiosarcoma. Oncoimmunology. 2017; 6: e1253657. https://doi.org/10.1080/2162402x.2016.1253657.
44. Yang CY, Lin MW, Chang YL, Wu CT, Yang PC. Programmed cell death-ligand 1 expression is associated with a favourable immune microenvironment and better overall survival in stage I pulmonary squamous cell carcinoma. Eur J Cancer. 2016; 57: 91-103. https://doi.org/10.1016/j.ejca.2015.12.033.
45. Tie Y, Ma X, Zhu C, Mao Y, Shen K, Wei X, Chen Y, Zheng H. Safety and efficacy of nivolumab in the treatment of cancers: a meta-analysis of 27 prospective clinical trials. Int J Cancer. 2017; 140: 948-58. https://doi.org/10.1002/ijc.30501.
46. Ohigashi Y, Sho M, Yamada Y, Tsurui Y, Hamada K, Ikeda N, Mizuno T, Yoriki R, Kashizuka H, Yane K, Tsushima F, Otsuki N, Yagita H, et al. Clinical significance of programmed death-1 ligand-1 and programmed death-1 ligand-2 expression in human esophageal cancer. Clin Cancer Res. 2005; 11: 2947-53. https://doi.org/10.1158/1078-0432.ccr-04-1469.
47. Jung HI, Jeong D, Ji S, Ahn TS, Bae SH, Chin S, Chung JC, Kim HC, Lee MS, Baek MJ. Overexpression of PD-L1 and PD-L2 is associated with poor prognosis in patients with hepatocellular carcinoma. Cancer Res Treat. 2017; 49: 246-54. https://doi.org/10.4143/crt.2016.066.
48. Nomi T, Sho M, Akahori T, Hamada K, Kubo A, Kanehiro H, Nakamura S, Enomoto K, Yagita H, Azuma M, Nakajima Y. Clinical significance and therapeutic potential of the programmed death-1 ligand/programmed death-1 pathway in human pancreatic cancer. Clin Cancer Res. 2007; 13: 2151-7. https://doi.org/10.1158/1078-0432.ccr-06-2746.
49. Hamanishi J, Mandai M, Iwasaki M, Okazaki T, Tanaka Y, Yamaguchi K, Higuchi T, Yagi H, Takakura K, Minato N, Honjo T, Fujii S. Programmed cell death 1 ligand 1 and tumor-infiltrating CD8+ T lymphocytes are prognostic factors of human ovarian cancer. Proc Natl Acad Sci U S A. 2007; 104: 3360-5. https://doi.org/10.1073/pnas.0611533104.
50. Kim MY, Koh J, Kim S, Go H, Jeon YK, Chung DH. Clinicopathological analysis of PD-L1 and PD-L2 expression in pulmonary squamous cell carcinoma: comparison with tumor-infiltrating T cells and the status of oncogenic drivers. Lung Cancer. 2015; 88: 24-33. https://doi.org/10.1016/j.lungcan.2015.01.016.
51. Keir ME, Butte MJ, Freeman GJ, Sharpe AH. PD-1 and its ligands in tolerance and immunity. Annu Rev Immunol. 2008; 26: 677-704. https://doi.org/10.1146/annurev.immunol.26.021607.090331.
52. Muhlbauer M, Fleck M, Schutz C, Weiss T, Froh M, Blank C, Scholmerich J, Hellerbrand C. PD-L1 is induced in hepatocytes by viral infection and by interferon-alpha and -gamma and mediates T cell apoptosis. J Hepatol. 2006; 45: 520-8. https://doi.org/10.1016/j.jhep.2006.05.007.
53. Latchman Y, Wood CR, Chernova T, Chaudhary D, Borde M, Chernova I, Iwai Y, Long AJ, Brown JA, Nunes R, Greenfield EA, Bourque K, Boussiotis VA, et al. PD-L2 is a second ligand for PD-1 and inhibits T cell activation. Nat Immunol. 2001; 2: 261-8. https://doi.org/10.1038/85330.
54. Loke P, Allison JP. PD-L1 and PD-L2 are differentially regulated by Th1 and Th2 cells. Proc Natl Acad Sci U S A. 2003; 100: 5336-41. https://doi.org/10.1073/pnas.0931259100.