
INTRODUCTION
The protein encoded by the MDM2 (Mouse Double Minute 2 homolog) gene plays a key role in cell cycle control as a regulator of p53 activity (the protein coded for by the TP53 gene). It also interacts with several other major proteins involved in cell cycle control and growth arrest, such as pRb and E2F1 [1, 2]. The importance of MDM2 function is illustrated by the fact that Mdm2 knock-out leads to early embryonic death in mice, which can be reversed by concomitant knockout of the TP53 gene [3, 4]. Although lacking in some well characterized model organisms, like D.melanogaster and C.elegans, homologues of MDM2 have been found in many vertebrates as well as invertebrate species [5].In humans, MDM2 is amplified and / or overexpressed in many cancer types [6]. High levels of MDM2 lead to increased inhibition and degradation of p53; thus, MDM2 overexpression has been considered to be one of a set of alternative mechanisms of p53 inactivation in several tumor forms [7].
The polymorphism SNP309T>G (rs2279744), located in the MDM2 intronic promoter (P2), has been found to be associated with enhanced Sp1 transcription factor binding, thereby leading to increased MDM2 expression [8]. SNP309G was initially found associated with early cancer onset among individuals carrying TP53 germline mutations (Li-Fraumeni syndrome) and spontaneous soft tissue sarcomas as well as estrogen receptor (ER) rich breast cancer [8, 9]. Subsequent to the initial discovery of SNP309, potential associations between this variant and cancer risk have been studied across many cancer types and ethnic groups. Overall, the findings indicate that the SNP309G allele is associated with an increased risk of several cancer forms in Asian populations while the results in Caucasians are at variance [10, 11], and a study of >5,000 Western European breast cancer patients [12] yielded no associations with cancer risk. Recently, we reported a second SNP (SNP285 G>C; rs117039649) in the same promoter (P2), only 24 bps upstream of SNP309 [13]. SNP285C is in complete linkage disequilibrium with SNP309G in large previously analyzed Caucasian cohorts (>7,000 individuals; p<1.0 x 10⁻¹⁰ [13]). SNP285C reduces the binding strength between the Sp1 transcription factor and the MDM2 promoter, and is associated with a significantly reduced risk of spontaneous breast, endometrial and ovarian cancer as well as a reduced risk of ovarian cancer among BRCA1 mutation carriers [13-15]. Further, censoring individuals harboring SNP285C revealed a stronger effect of SNP309 status on the risk of these cancers [13, 15]. In contrast, SNP285C was not associated with an altered risk of prostate cancer [15]. The SNP285C variant was detected in about 8% among healthy individuals in Norway, the Netherlands, and UK, but was absent among Han Chinese, and found at a low frequency (<2%) among Finns [13].
Given that SNP285C seems to be a significant cancer risk reducing factor, any difference related to its frequency across populations will add to our understanding of differences in cancer risk between ethnic groups. Further, this variant may confound cancer risk evaluations related to other SNPs in the MDM2 gene (such as SNP309) depending on the ethnic population investigated. Based on our previous findings [16], we hypothesized the SNP285C variant to occur among North-Western Europeans only. Here, we determined SNP285C distribution across multiple ethnic groups and estimated its time of origin. Our results are consistent with SNP285C being a pan-Caucasian variant originated shortly after divergence between modern day Caucasians and East Asians, suggesting SNP285C to be a cancer risk modulating factor in all populations of Caucasian origin.
RESULTS
Ethnic distribution of MDM2 SNP285C
The genotypes and allele frequencies for MDM2 SNP285 are summarized in Table 1A/B and Figure 1. The corresponding data for SNP309 is summarized in Supplemental Table S1. For all populations analyzed, the genotype frequencies are in Hardy-Weinberg equilibrium (all p-values >0.3).
In a previous publication, we reported the SNP285C variant to be present in about 7.8 % of North-Western Caucasians (Norway, the Netherlands and UK) but to occur at a low incidence among Finns (1.7%), and to be absent in a cohort of Han Chinese [13]. We therefore hypothesized that SNP285C could be a young variant, present in the North Western part of Europe only. In the present study, we found similar SNP285C frequencies across Western as well as Eastern European populations (with the exception of the Saami and Finnish populations), only dropping off towards the Middle-East (Greece 5.4%, Turkey 4.5%, Lebanon 3.8% and Iran 4.7%) and towards the Eastern Russian regions (Altaians in South Siberia 3.6% and Bashkirs in Ural 3.5%). These data clearly indicate SNP285C to be a pan-European variant (Table 1, Figure 1).
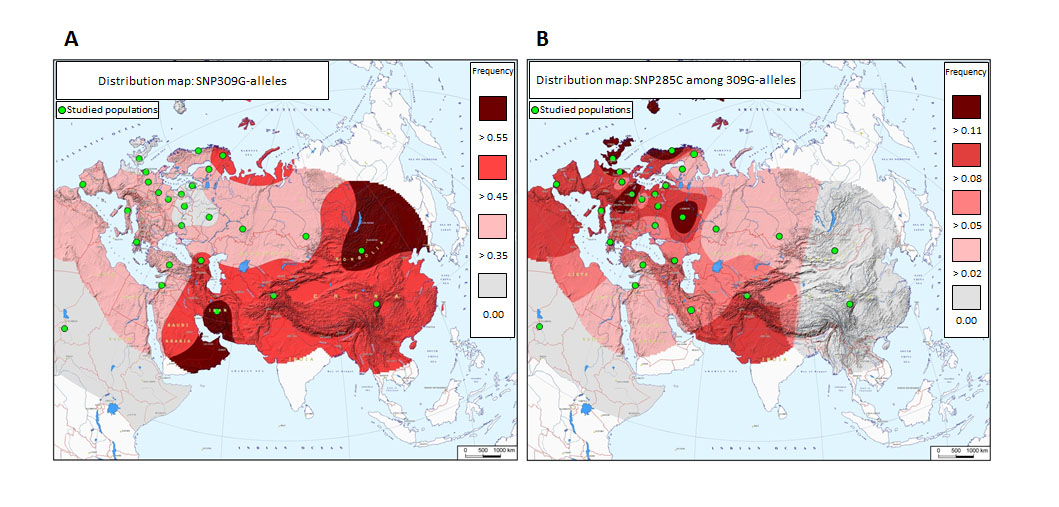
Figure 1: Distribution of MDM2 promoter SNPs across Eurasia. (A) Distribution of SNP309G. Green dots represent populations genotyped. (B) Distribution of SNP285C among SNP309G-alleles.
We found no individuals with SNP285C in a sample of ethnic Mongolians (n=229). Together with our previous data from a Chinese cohort, this confirms SNP285C to be absent from East Asian populations. Nor did we find any individuals with SNP285C in a cohort of African-Americans (n=50), strongly indicating this variant to be restricted to Caucasian populations. Notably, the frequency of SNP285C in our new independent cohort of Finns analyzed here (0%; 0 out of 69 individuals), confirmed the low frequency found in our previously reported cohort of Finns (1.7%; 1.2%, the two cohorts taken together; Table 1). As for individuals of Saami heritage, SNP285C was detected heterozygously in one out of 349 individuals only (0.3%; Table 1).
Table 1A: Distribution of MDM2 SNP285 genotypes across populations.
Population |
SNP285 Genotype n (%) |
|||
GG |
GC |
CC |
Total |
|
Norway* |
2274 (92.3) |
183 (7.4) |
8 (0.3) |
2465 |
Netherlands* |
1089 (92.2) |
91 (7.7) |
1 (0.1) |
1181 |
UK* |
320 (92.8) |
25 (7.3) |
0 (0.0) |
345 |
Germany |
264 (92.0) |
23 (8.0) |
0 (0.0) |
287 |
Italy |
277 (92.3) |
23 (7.7) |
0 (0.0) |
300 |
Poland |
424 (91.2) |
40 (8.6) |
1 (0.2) |
465 |
Belarus |
337 (92.6) |
27 (7.4) |
0 (0.0) |
364 |
Finland (a)* |
179 (98.4) |
3 (1.7) |
0 (0.0) |
182 |
Finland (b) |
69 (100.0) |
0 (0.0) |
0 (0.0) |
69 |
Saami |
348 (99.7) |
1 (0.3) |
0 (0.0) |
349 |
Greece |
282 (94.6) |
16 (5.4) |
0 (0.0) |
298 |
Spain |
272 (94.8) |
13 (4.5) |
2 (0.7) |
287 |
Estonia |
285 (94.1) |
18 (5.9) |
0 (0.0) |
303 |
Lithuania |
283 (94.0) |
18 (6.0) |
0 (0.0) |
301 |
Ukraine |
307 (95.9) |
12 (3.8) |
1 (0.3) |
320 |
Turkey |
401 (95.5) |
19 (4.5) |
0 (0.0) |
420 |
Lebanon |
303 (96.2) |
12 (3.8) |
0 (0.0) |
315 |
Iran |
285 (95.7) |
13 (4.4) |
1 (0.3) |
299 |
Tver/Ryazan (RUS) |
155 (91.7) |
14 (8.3) |
0 (0.0) |
169 |
North Caucasus (RUS) |
279 (93.6) |
18 (6.0) |
1 (0.3) |
298 |
Bashkirs (RUS) |
250 (96.5) |
9 (3.5) |
0 (0.0) |
259 |
Tadjikistan |
281 (92.7) |
22 (7.3) |
0 (0.0) |
303 |
Altaians (RUS) |
243 (96.4) |
9 (3.6) |
0 (0.0) |
252 |
Mongolia |
229 (100.0) |
0 (0.0) |
0 (0.0) |
229 |
China* |
319 (100.0) |
0 (0.0) |
0 (0.0) |
319 |
Afro-Americans |
50 (100.0) |
0 (0.0) |
0 (0.0) |
50 |
* Previously published data (Knappskog et al 2011).
Table 1B: Distribution of MDM2 SNP285 alleles across populations.
Population |
SNP285 Alleles n (%) |
MAF |
285-MAF among 309G-alleles |
||
G |
C |
Total |
|||
Norway* |
4731 (96.0) |
199 (4.0) |
4930 |
0.040 |
0.118 |
Netherlands * |
2269 (96.1) |
93 (3.9) |
2362 |
0.039 |
0.117 |
UK* |
665 (96.4) |
25 (3.6) |
690 |
0.036 |
0.105 |
Germany |
551 (96.0) |
23 (4.0) |
574 |
0.040 |
0.066 |
Italy |
577 (96.2) |
23 (3.8) |
600 |
0.038 |
0.107 |
Poland |
888 (95.5) |
42 (4.5) |
930 |
0.045 |
0.073 |
Belarus |
701 (96.3) |
27 (3.7) |
728 |
0.037 |
0.111 |
Finland (a)* |
361 (99.2) |
3 (0.8) |
364 |
0.008 |
0.019 |
Finland (b) |
138 (100.0) |
0 (0.0) |
138 |
0.000 |
0.000 |
Saami |
697 (99.9) |
1 (0.1) |
698 |
0.001 |
0.003 |
Greece |
580 (97.3) |
16 (2.7) |
596 |
0.027 |
0.068 |
Spain |
557 (97.0) |
17 (3.0) |
574 |
0.030 |
0.081 |
Estonia |
588 (97.0) |
18 (3.0) |
606 |
0.030 |
0.090 |
Lithuania |
584 (97.0) |
18 (3.0) |
602 |
0.030 |
0.095 |
Ukraine |
626 (97.8) |
14 (2.2) |
640 |
0.022 |
0.063 |
Turkey |
821 (97.7) |
19 (2.3) |
840 |
0.023 |
0.052 |
Lebanon |
618 (98.1) |
12 (1.9) |
630 |
0.019 |
0.043 |
Iran |
583 (97.5) |
15 (2.5) |
598 |
0.025 |
0.046 |
Tver/Ryazan (RUS) |
324 (95.9) |
14 (4.1) |
338 |
0.041 |
0.120 |
North Caucasus (RUS) |
576 (96.6) |
20 (3.4) |
596 |
0.034 |
0.074 |
Bashkirs (RUS) |
509 (98.3) |
9 (1.7) |
518 |
0.017 |
0.042 |
Tadjikistan |
584 (96.4) |
22 (3.6) |
606 |
0.036 |
0.078 |
Altaians (RUS) |
495 (98.2) |
9 (1.8) |
504 |
0.018 |
0.040 |
Mongolia |
458 (100.0) |
0 (0.0) |
458 |
0.000 |
0.000 |
China* |
638 (100.0) |
0 (0.0) |
638 |
0.000 |
0.000 |
Afro-Americans |
100 (100.0) |
0 (0.0) |
100 |
0.000 |
0.000 |
* Previously published data (Knappskog et al 2011).
Validation data set for population distribution of MDM2 SNP285C
In order to validate our findings with respect to the variant frequencies, we mined the 1000 Genomes project data bank (www.1000genomes.org), where MDM2 SNP309 and SNP285 status are available for most individuals. Even though the number of individuals here is limited with respect to each ethnic group, these additional data support our findings: the SNP285C was absent in the Asian populations (Chinese, n=197, Japanese, n = 89), while the frequencies (4.1 – 7.1%) in the Caucasian populations (Americans, British, Spanish and Italians) were in line with our observations. Notably, our finding of a low incidence of SNP285C among Finns was also validated in the 1000 Genomes data-set (1%). Regarding African populations, two individuals (1 out of 97 Nigerians and 1 out of 88 Kenyans) were registered with a SNP285GC genotype in the 1000 Genome project databank. However, taking into account that the quality scores for the SNP-calling of SNP285 is rather poor for these two samples, and the fact that both individuals harbor the SNP309TT genotype, the chance exists that the registered C-alleles may be artefacts.
Distribution of MDM2 SNP285C among SNP309G-alleles
Since the SNP285C variant is present only in haplotypes with the SNP309G allele (100% linkage disequilibrium with SNP309G), we tested whether any of the differences in SNP285C frequencies between populations could be “passenger-effects” of the observed differences in SNP309 distribution (Supplemental Table S1). In order to remove the potential confounding effects of different SNP309G frequencies, we compared the ratios of SNP285C-alleles divided by the total number of SNP309G-alleles between the individual populations. Table 1B gives the minor allele frequencies (MAFs) for SNP285C among SNP309G alleles. In general, we found the same patterns as for the genotypes described above: the frequency of the SNP285C / 309G haplotype is quite consistent across most Western and Eastern European populations (0.066 - 0.120) but low among Saami and Finns (0.003 and 0.013, respectively) and dropping off towards East Russia and Central Asia, while being absent in East Asia and among individuals of African American heritage.
Inverse correlation between SNP285 and SNP309 MAFs
When comparing the frequencies of SNP285C and SNP309G across the populations (Table 1 and Supplemental Table S1), surprisingly, we found an inverse correlation (r = -0.439, p = 0.028; Figure 2A). This correlation remains after removing the special case of African Americans, where SNP285C is absent and the frequency of SNP309G is very low (r = -0.607, p = 0.002; Figure 2B), as well as after removing all populations where SNP285C is absent (African Americans, Chinese and Mongolians) from the calculations (r = -0.519, p = 0.013; correlation plot not shown).
Taking into account the fact that the SNP285C variant is found on the SNP309G haplotype only, we calculated the correlation between the incidence of the SNP285C/309G haplotype among SNP309G alleles and the respective SNP309 MAF across the different populations. This strengthened the inverse correlation (r = -0.604, p = 0.001 and r = -0.805, p < 0.001, including and excluding African Americans, respectively; Figure 2C-D).
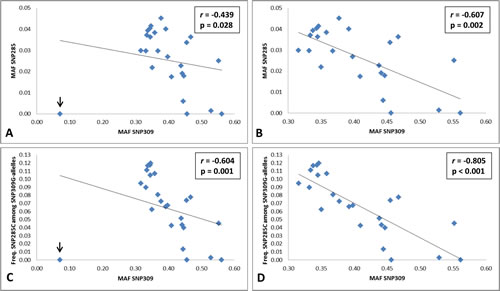
Figure 2: Inverse correlation between MDM2 SNP285 (rs117039649) and SNP309 (rs2279744). (A-B) Correlation plots for MAF SNP285 and MAF SNP309 including all 25 analyzed populations (A) and 24, excluding the special case of African Americans where SNP285 is absent and the frequency of SNP309G is very low (B). (C-D) Correlation plots for the frequency of SNP285C among SNP309G-alleles in all 25 analyzed populations (C) and excluding African Americans (D).
Ancestry of MDM2 SNP285C
To obtain an estimate of the age of SNP285C, we used short tandem repeats (STR) variants surrounding the MDM2 locus. Screening 14 STRs in 48 healthy Norwegian males, we identified two STRs (D12S1680 and D12S1693) generating a haplotype (CA)21-(CA)13 in statistically significant LD with SNP285C. Based on this haplotype, the spreading time (age) of SNP285C was estimated to be 586 generations (95% CI: 333 – 1333). Applying an average generation time of 25 years, we estimated SNP285C to be approximately 14,700 years old (95% CI: 8,300 – 33,300). Interestingly, recent estimates have indicated the separation of present day Caucasians and East Asians to have occurred around 23,000 years ago (95% CI: 17,000 – 43,000) [17]. Thus, our STR analysis, consistent with the geographical distribution of SNP285C, suggests this variant to have arisen after the separation of Caucasians from modern day East Asians.
Haplotype diversity for MDM2 SNP285C versus SNP285G
Finally, we mined the data from the 1000 Genomes project, assessing potential differences with respect to haplotype diversity between the SNP285C and G alleles. While STR genotypes are not available, we extracted genotypes for 49 SNPs (including SNP285 and 24 SNPs on each side; Supplemental Table S2) in 288 Caucasian individuals, enabling us to compare the diversity between the alleles carrying SNP285G with those harboring the C-variant, across a region of approximately 8.7 kilobases (chr12:69197737 – 69206479). The imputed haplotypes are depicted in Figure 3A. Among the many haplotypes (n=54) carrying the SNP285G-allele, three were dominant with respect to frequency while a high number of haplotypes were observed in low frequencies (Figure 3A). In the haplotypes carrying SNP285C (n=16), we observed 15 identical ones and a single haplotype carrying a SNP-pattern similar to several of the haplotypes with SNP285G in the region upstream of this SNP, indicating a recombination to have taken place just upstream of SNP285.
Regarding SNP285 as the focal point and assessing the haplotype branching based on the eight nearest neighboring SNPs, we observed a much more complex branching pattern for the SNP285G-haplotypes than for SNP285C (Figure 3B). These haplotype data indicates SNP285C to be much younger than SNP285G, consistent with a selective sweep of this variant.
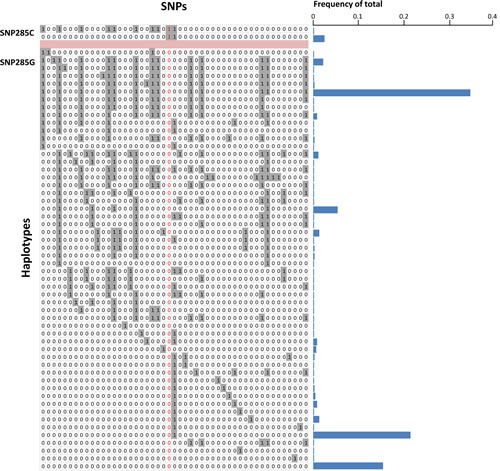
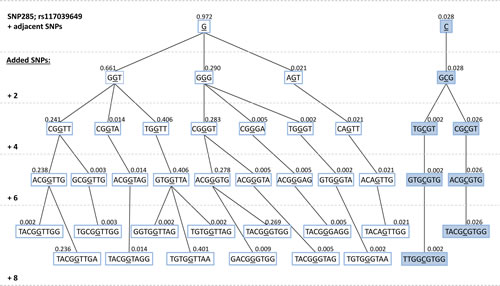
Figure 3: (A) Imputed haplotypes including 49 SNPs within / flanking the MDM2 gene, extracted from 288 Caucasian individuals; data extracted from the 1000 genome project - www.1000genomes.org. SNP285 (rs117039649) is indicated in red. “1” indicates presence of the minor allele for each SNP, while “0” indicates the presence of the major allele. Frequency of the different unique haplotypes (n=56) observed among the 576 alleles (288 individuals) are indicated as blue horizontal bars. (B) Haplotype-tree based on 8 SNPs surrounding SNP285 (rs117039649). The tree and the frequencies given for each haplotype are based on the same 288 individuals as in Figure 3A.
DISCUSSION
While multiple SNPs have been detected throughout the MDM2 promoters, effects on transcription and pathophysiological effects, such as associations with cancer risk, have been described for a few only. While SNP309 (rs2279744) seems to have an oncogenic effect, and SNP285C (rs117039649) is associated with a reduced risk of certain cancers, we found a third SNP in the same region (SNP344; rs1196333) not to be associated with altered risk of any of several major tumour forms [18].
So far, apart from our own studies [13, 15], only a few studies have assessed SNP285 status. Paulin and co-workers found SNP285C in 4.4% of healthy Scottish individuals [19], while Piotrowski and colleagues found the variant C-allele in 10.2 % of healthy Polish individuals [20]. Further, Ryan and colleagues found 6% of Americans of Caucasian ancestry to harbor SNP285C [21], while Renaux-Petel and co-workers found this variant among 5.2% of French individuals diagnosed with germline TP53 mutations [Li-Fraumeni patients; 22]. Although Ryan et al detected SNP285C in 1% of African Americans (3 out of 253 genotyped individuals), this observation does not contradict the lack of SNP285C in Africans populations, as it has been estimated that on average 20% of the gene pool in the modern day African-American population is of European origin [23]. Taken together, these data are all in line with our present findings.
The conclusions from the data presented here are also supported by the SNP status from several ethnic groups through the genomic data available from the 1000 Genome project. Further, the distribution pattern observed for SNP285C has many parallels known for other human genetic variants, including mitochondrial DNA and Y-chromosomal haplogroups, being so-called West Eurasian [24-26].
The reason for the low frequency of SNP285C among individuals of Finnish and Saami heritage compared to other European populations is unknown. However, the Finnish population is known to have undergone narrow bottlenecks, and its genetic composition differs from other European populations [27]. Notably, the low frequency of SNP285C among Finns was detected in two independent cohorts and further confirmed in the 1000 Genome project. Regarding the Saami population, it is generally assumed to have originated from a narrow subset of Europeans, although their entry route to Northern Scandinavia remains an issue of debate [28].
Based on the STR analysis, we estimated the age of SNP285C to be about 14.700 years. Calculations based on nuclear DNA divergence has estimated the separation between the European and Asian population to have occurred around 23,000 (CI: 17,000 - 40,000) years ago, [17], while calculations based on mitochondrial DNA divergence have estimated this event to take place approximately 40,000 years ago [29]. Thus, our age estimate, similar to our findings with respect to geographical distribution of SNP285C, indicates that this variant has arisen early after separation of the two population groups.
It should be noted, however, that several theories regarding human expansion out of Africa and into the rest of the world exist. Probably, neither the expansion of humans from Africa nor the split between Caucasians and Asians have occurred as single events [30] and our model may therefore be too simplistic. Although less likely, based on our age estimations and the haplotype diversities, SNP285C may have originated early and existed in other ethnic groups, including Asians and Africans, only to subsequently disappear during evolution.
Interestingly, we detected a strong inverse correlation between the frequency of the SNP285C/309G haplotype and SNP309G MAF across the different populations analyzed. While it is not possible to draw a definite conclusion with respect to the causes of this inverse correlation, it seems clear that this finding may not be explained by simple bottleneck effects and subsequent rapid expansion of evolutionary neutral variants in a population. The fact that SNP285C and SNP309G have opposite effects on MDM2 transcription [13] raise the question whether such an inverse correlation may be due to environmental adaption across different geographic areas. Notably, applying a mathematical formulation for dating of evolutionary neutral polymorphisms (generations = -4Ne [p(lne p) + (1 2013; p)(lne(1-p)]) [31, 32], with a haplotype frequency of 3-4%, SNP285C may be estimated to have arisen around 85,000 years ago. The CI for such an estimate however will be large [33] precluding any firm conclusions to be drawn, but the discrepancy between this estimate, the data from geographical distribution and STR-based analyses adds support to the hypothesis that SNP285C is not evolutionary neutral.
While different studies have shown SNP309 and SNP285 to affect the risk for different cancer forms [10, 11], any difference with respect to cancer risk is unlikely to have played a major role in evolution, as most cancers occur after reproductive age. MDM2 is a key factor in multiple cellular processes; thus, it is likely that fine-tuning of its activity in response to environmental influences is important. Notably, SNP309 status has been associated with missed abortions [34] and with male [35] and female [36] infertility. Taken together, our findings indicate both SNP285 and SNP309 status may affect biological processes of evolutionary importance. SNP285 and SNP309 have been shown to reduce and enhance transcription-factor Sp1 binding to the MDM2 promoter, respectively [13]. Further, they have been shown to have opposing effects on cancer risk. Thus, it is not unreasonable to postulate they may have antagonistic effects on other biological mechanisms as well.
In conclusion, detailed mapping of the prevalence of SNP285C in multiple populations indicates this variant to be spread through most populations of Caucasian origin. The status of this cancer risk reducing SNP needs to be taken into account when assessing the impact of other MDM2 SNPs on cancer risk across different ethnic and geographic populations.
MATERIALS AND METHODS
Subject cohorts
In the present project, we screened SNP285 and SNP309 genotypes in 5,937 healthy individuals, representing 21 different populations / cohorts. The populations and the number of individuals included in each of them are listed in Table 1. In addition, we included data from our previous study [13] making the total number healthy individuals genotyped 10,429, representing 25 different populations / cohorts (Table 1), thereby allowing us to determine the geographic distributions of both variants.
In order to validate our findings, we performed data mining and extracted information regarding MDM2 SNP285 and SNP309 status from genomic information from the 1000 Genomes project (www.1000genomes.org). Here, we retrieved SNP status from multiple ethnic groups mounting up to a total of 1,094 further individuals.
SNP genotyping
The Finnish, Estonian, Lebanese, German and Chinese samples were genotyped for SNPs 285 and 309 in their respective countries by PCR amplification and Sanger sequencing (the three former populations) or restriction fragment length analysis (the two latter populations), as previously described [13, 37-39]. Norwegian, Dutch and British samples were previously genotyped in Norway by PCR amplification and Sanger sequencing [13].
The remaining samples were analyzed, for both MDM2 SNP285 and 309 status using the LightSNiP technology (TIB-MOLBIOL) on a LightCycler 480 instrument (Roche) in our laboratory in Bergen, Norway. These amplifications were performed in a final reaction volume of 10 µl, containing 1 µl LightCycler® FastStart DNA Master HybProbe mix (Roche Diagnostics), 0.5 µl LightSNiP mix (TIB MOLBIOL), 3 mM MgCl2 and 10 - 50 ng DNA. The thermocycling and melt curve conditions were set according to the optimized protocol provided by TIB MOLBIOL: 10 minutes initial denaturation / activation at 95 °C, followed by 45 cycles of denaturation at 95 °C for 10 seconds, annealing for 10 seconds at 60 °C and elongation at 72 °C for 15 seconds. Subsequently, the high resolution melting (HRM) step was performed, starting with an initial denaturation at 95 °C for 30 seconds, followed by melting from 40 °C to 75 °C with a ramp rate of 0.19 °C/sec and a final cooling step at 40 °C for 30 seconds. The HRM curve profiles were then analyzed using the Melt Curve Genotyping module in the LightCycler® 480 software version 1.5. Both Light SNiP assays (for SNP285 and SNP309) had identical thermocycling conditions.
For assay quality control, 3 % of the samples analyzed by LightSNiP technology had their genotypes validated by Sanger sequencing. The concordance between the two methods was 100%, assuring no bias in the data sets based on method of genotyping.
Age estimation of SNP285 by STR genotyping
14 STRs surrounding the MDM2 promoter P2 were genotyped by PCR amplification and size analyses of the amplified products. The STRs and the primers used for amplification are listed in Supplemental Table S3. Amplification was performed in a 50 µl reaction mix containing 0,5 µl Dynazyme EXT polymerase (Finnzymes), 1x Dynazyme reaction buffer, 5% DMSO, 0.2 mM dNTPs, 0.2 µM of each primer and 10-50 ng DNA. The thermocycling conditions were a 5 minutes initial denaturation / activation step at 95 °C, followed by 40 cycles of 45 seconds denaturation at 95 °C, 45 seconds annealing at 55 °C and 45 seconds elongation at 72 °C. The amplified products were separated by capillary electrophoresis on a ABI3700 sequencer. The STR genotyping was performed in a selection of 48 healthy Norwegian individuals with known status for MDM2 SNPs 285, 309 and 344.
Haplotypes were imputed from the SNP and STR genotype data, using the Arlequin software v3.5 [40].
The only haplotype (CA)21-(CA)13 at two STRs D12S1680 and D12S1693 for which LD with SNP285C was statistically significant was identified and used for an estimation of the age of SNP285C. We applied the formula g = log δ / log (1 - θ) [41], where g equals the time (in generations) back to the initial spreading of mutant chromosomes in population, δ equals the measure of LD and θ is the recombination fraction between the disease locus and the marker. In this case, “mutant” chromosomes are SNP285C bearing chromosomes, the “disease locus” is the MDM2 gene and the “marker” is the two STRs with LD haplotype. To assess the degree of LD, we applied the formula δ = (PD – PN) / (1 – PN) [42], where PD is the frequency of the associated alleles on the diseased chromosome (bearing SNP285C in this case) and PN is the frequency of the same allele on the control chromosome (not bearing SNP285C). D12S1680 and D12S1693 are located in the same linked cluster on genetic Marshfield map and so the haplotype (CA)21-(CA)13 was used as a single associated allele in the formula. CI for δ was calculated as previously described [43].
Haplotype diversity
Haplotype diversity for the SNP285G and C-alleles were assessed by extracting SNP information from the 1000 Genomes dataset (www.1000genomes.org). We extracted SNP-data from 288 individuals, including all Caucasian individuals (possible carriers of SNP285C) except for Finns (where the frequency of SNP285C was expected to be very low). From these individuals, the genotypes of 49 SNPs (Supplemental Table S2), including SNP285 and its 24 flanking SNPs on each side (spanning a region of 8.7 kb; chr12:69197737 - 69206479) were phased using Impute2 [44].
Statistics
Comparisons of genotype distributions between population groups were performed by Fisher’s exact tests (2x2 comparisons) and Chi-square tests (2xn comparisons), using SPSS software, version 18. All p-values given are two-sided, and p-values obtained by the Fisher’s exact tests are given as cumulative.
CONFLICT OF INTEREST STATEMENT
The authors declare no conflict of interest.
ACKNOWLEDGEMENTS
Most of this work was performed in the Mohn Cancer Research Laboratory. The authors thank Beryl Leirvaag and Peter Schürmann for technical assistance. This work was supported by grants from the Bergen Medical Research Foundation and the Norwegian Cancer Society. The Lithuanian part was supported by the LITGEN project (VP1-3.1-SMM-07-K-01-013). The authors acknowledge the cohort of Norway (CONOR) study for providing samples for the initial screening of SNPs in healthy individuals.
REFERENCES
1. Martin K, Trouche D, Hagemeier C, Sorensen TS, La Thangue NB, Kouzarides T. Stimulation of E2F1/DP1 transcriptional activity by MDM2 oncoprotein. Nature 1995; 375:691-694.
2. Xiao ZX, Chen J, Levine AJ, Modjtahedi N, Xing J, Sellers WR, Livingston DM. Interaction between the retinoblastoma protein and the oncoprotein MDM2. Nature 1995; 375:694-698.
3. Jones SN, Roe AE, Donehower LA, Bradley A. Rescue of embryonic lethality in Mdm2-deficient mice by absence of p53. Nature 1995; 378:206-208.
4. Montes de Oca Luna R, Wagner DS, Lozano G. Rescue of early embryonic lethality in mdm2-deficient mice by deletion of p53. Nature 1995; 378:203-206.
5. Lane DP, Verma C. Mdm2 in evolution. Genes & cancer 2012; 3:320-324.
6. Momand J, Zambetti GP. Mdm-2: “big brother” of p53. Journal of cellular biochemistry 1997; 64:343-352.
7. Bartel F, Meye A, Wurl P, Kappler M, Bache M, Lautenschlager C, Grunbaum U, Schmidt H, Taubert H. Amplification of the MDM2 gene, but not expression of splice variants of MDM2 MRNA, is associated with prognosis in soft tissue sarcoma. Int J Cancer 2001; 95:168-175.
8. Bond GL, Hu W, Bond EE, Robins H, Lutzker SG, Arva NC, Bargonetti J, Bartel F, Taubert H, Wuerl P, Onel K, Yip L, Hwang SJ, Strong LC, Lozano G, Levine AJ. A single nucleotide polymorphism in the MDM2 promoter attenuates the p53 tumor suppressor pathway and accelerates tumor formation in humans. Cell 2004; 119:591-602.
9. Bond GL, Hirshfield KM, Kirchhoff T, Alexe G, Bond EE, Robins H, Bartel F, Taubert H, Wuerl P, Hait W, Toppmeyer D, Offit K, Levine AJ. MDM2 SNP309 accelerates tumor formation in a gender-specific and hormone-dependent manner. Cancer Res 2006; 66:5104-5110.
10. Economopoulos KP, Sergentanis TN. Differential effects of MDM2 SNP309 polymorphism on breast cancer risk along with race: a meta-analysis. Breast Cancer Res Treat 2010; 120:211-216.
11. Hu Z, Jin G, Wang L, Chen F, Wang X, Shen H. MDM2 promoter polymorphism SNP309 contributes to tumor susceptibility: evidence from 21 case-control studies. Cancer Epidemiol Biomarkers Prev 2007; 16:2717-2723.
12. Schmidt MK, Reincke S, Broeks A, Braaf LM, Hogervorst FB, Tollenaar RA, Johnson N, Fletcher O, Peto J, Tommiska J, Blomqvist C, Nevanlinna HA, Healey CS, Dunning AM, Pharoah PD, Easton DF, Dork T, Van’t Veer LJ. Do MDM2 SNP309 and TP53 R72P interact in breast cancer susceptibility? A large pooled series from the breast cancer association consortium. Cancer Res 2007; 67:9584-9590.
13. Knappskog S, Bjornslett M, Myklebust LM, Huijts PE, Vreeswijk MP, Edvardsen H, Guo Y, Zhang X, Yang M, Ylisaukko-Oja SK, Alhopuro P, Arola J, Tollenaar RA, van Asperen CJ, Seynaeve C, Staalesen V, Chrisanthar R, Lokkevik E, Salvesen HB, Evans DG, Newman WG, Lin D, Aaltonen LA, Borresen-Dale AL, Tell GS, Stoltenberg C, Romundstad P, Hveem K, Lillehaug JR, Vatten L, Devilee P, Dorum A, Lonning PE. The MDM2 Promoter SNP285C/309G Haplotype Diminishes Sp1 Transcription Factor Binding and Reduces Risk for Breast and Ovarian Cancer in Caucasians. Cancer Cell 2011; 19:273-282.
14. Bjornslett M, Knappskog S, Lonning PE, Dorum A. Effect of the MDM2 promoter polymorphisms SNP309T>G and SNP285G>C on the risk of ovarian cancer in BRCA1 mutation carriers. BMC Cancer 2012; 12:454.
15. Knappskog S, Trovik J, Marcickiewicz J, Tingulstad S, Staff AC, MoMa TECsg, Romundstad P, Hveem K, Vatten L, Salvesen HB, Lonning PE. SNP285C modulates oestrogen receptor/Sp1 binding to the MDM2 promoter and reduces the risk of endometrial but not prostatic cancer. Eur J Cancer 2012; 48:1988-1996.
16. Knappskog S, Lonning PE. MDM2 promoter SNP285 and SNP309; phylogeny and impact on cancer risk. Oncotarget 2011; 2:251-258.
17. Gutenkunst RN, Hernandez RD, Williamson SH, Bustamante CD. Inferring the joint demographic history of multiple populations from multidimensional SNP frequency data. PLoS Genet 2009; 5:e1000695.
18. Knappskog S, Gansmo LB, Romundstad P, Bjornslett M, Trovik J, Sommerfelt-Pettersen J, Lokkevik E, Norwegian Breast Cancer Group trial NV, Tollenaar RA, Seynaeve C, Devilee P, Salvesen HB, Dorum A, Hveem K, Vatten L, Lonning PE. MDM2 promoter SNP344T>A (rs1196333) status does not affect cancer risk. PLoS One 2012; 7:e36263.
19. Paulin FE, O’Neill M, McGregor G, Cassidy A, Ashfield A, Ali CW, Munro AJ, Baker L, Purdie CA, Lane DP, Thompson AM. MDM2 SNP309 is associated with high grade node positive breast tumours and is in linkage disequilibrium with a novel MDM2 intron 1 polymorphism. BMC Cancer 2008; 8:281.
20. Piotrowski P, Lianeri M, Rubis B, Knula H, Rybczynska M, Grodecka-Gazdecka S, Jagodzinski PP. Murine double minute clone 2,309T/G and 285G/C promoter single nucleotide polymorphism as a risk factor for breast cancer: a Polish experience. Int J Biol Markers 2012; 27:e105-110.
21. Ryan BM, Calhoun KM, Pine SR, Bowman ED, Robles AI, Ambs S, Harris CC. MDM2 SNP285 does not antagonize the effect of SNP309 in lung cancer. Int J Cancer 2012; 131:2710-2716.
22. Renaux-Petel M, Sesboue R, Baert-Desurmont S, Vasseur S, Fourneaux S, Bessenay E, Frebourg T, Bougeard G. The MDM2 285G-309G haplotype is associated with an earlier age of tumour onset in patients with Li-Fraumeni syndrome. Familial cancer 2013.
23. Lohmueller KE, Bustamante CD, Clark AG. The effect of recent admixture on inference of ancient human population history. Genetics 2010; 185:611-622.
24. Myres NM, Rootsi S, Lin AA, Jarve M, King RJ, Kutuev I, Cabrera VM, Khusnutdinova EK, Pshenichnov A, Yunusbayev B, Balanovsky O, Balanovska E, Rudan P, Baldovic M, Herrera RJ, Chiaroni J, Di Cristofaro J, Villems R, Kivisild T, Underhill PA. A major Y-chromosome haplogroup R1b Holocene era founder effect in Central and Western Europe. Eur J Hum Genet 2011; 19:95-101.
25. Rootsi S, Myres NM, Lin AA, Jarve M, King RJ, Kutuev I, Cabrera VM, Khusnutdinova EK, Varendi K, Sahakyan H, Behar DM, Khusainova R, Balanovsky O, Balanovska E, Rudan P, Yepiskoposyan L, Bahmanimehr A, Farjadian S, Kushniarevich A, Herrera RJ, Grugni V, Battaglia V, Nici C, Crobu F, Karachanak S, Hooshiar Kashani B, Houshmand M, Sanati MH, Toncheva D, Lisa A, Semino O, Chiaroni J, Di Cristofaro J, Villems R, Kivisild T, Underhill PA. Distinguishing the co-ancestries of haplogroup G Y-chromosomes in the populations of Europe and the Caucasus. Eur J Hum Genet 2012; 20:1275-1282.
26. Semino O, Magri C, Benuzzi G, Lin AA, Al-Zahery N, Battaglia V, Maccioni L, Triantaphyllidis C, Shen P, Oefner PJ, Zhivotovsky LA, King R, Torroni A, Cavalli-Sforza LL, Underhill PA, Santachiara-Benerecetti AS. Origin, diffusion, and differentiation of Y-chromosome haplogroups E and J: inferences on the neolithization of Europe and later migratory events in the Mediterranean area. Am J Hum Genet 2004; 74:1023-1034.
27. Peltonen L, Jalanko A, Varilo T. Molecular genetics of the Finnish disease heritage. Hum Mol Genet 1999; 8:1913-1923.
28. Tambets K, Rootsi S, Kivisild T, Help H, Serk P, Loogvali EL, Tolk HV, Reidla M, Metspalu E, Pliss L, Balanovsky O, Pshenichnov A, Balanovska E, Gubina M, Zhadanov S, Osipova L, Damba L, Voevoda M, Kutuev I, Bermisheva M, Khusnutdinova E, Gusar V, Grechanina E, Parik J, Pennarun E, Richard C, Chaventre A, Moisan JP, Barac L, Pericic M, Rudan P, Terzic R, Mikerezi I, Krumina A, Baumanis V, Koziel S, Rickards O, De Stefano GF, Anagnou N, Pappa KI, Michalodimitrakis E, Ferak V, Furedi S, Komel R, Beckman L, Villems R. The western and eastern roots of the Saami--the story of genetic “outliers” told by mitochondrial DNA and Y chromosomes. Am J Hum Genet 2004; 74:661-682.
29. Fu Q, Meyer M, Gao X, Stenzel U, Burbano HA, Kelso J, Paabo S. DNA analysis of an early modern human from Tianyuan Cave, China. Proc Natl Acad Sci U S A 2013; 110:2223-2227.
30. Templeton A. Out of Africa again and again. Nature 2002; 416:45-51.
31. Kimura M, Ohta T. The age of a neutral mutant persisting in a finite population. Genetics 1973; 75:199-212.
32. Stephens JC, Reich DE, Goldstein DB, Shin HD, Smith MW, Carrington M, Winkler C, Huttley GA, Allikmets R, Schriml L, Gerrard B, Malasky M, Ramos MD, Morlot S, Tzetis M, Oddoux C, di Giovine FS, Nasioulas G, Chandler D, Aseev M, Hanson M, Kalaydjieva L, Glavac D, Gasparini P, Kanavakis E, Claustres M, Kambouris M, Ostrer H, Duff G, Baranov V, Sibul H, Metspalu A, Goldman D, Martin N, Duffy D, Schmidtke J, Estivill X, O’Brien SJ, Dean M. Dating the origin of the CCR5-Delta32 AIDS-resistance allele by the coalescence of haplotypes. Am J Hum Genet 1998; 62:1507-1515.
33. Slatkin M, Rannala B. Estimating allele age. Annual review of genomics and human genetics 2000; 1:225-249.
34. Fang Y, Kong B, Yang Q, Ma D, Qu X. MDM2 309 polymorphism is associated with missed abortion. Hum Reprod 2009; 24:1346-1349.
35. Huang C, Liu W, Ji GX, Gu AH, Qu JH, Song L, Wang XR. Genetic variants in TP53 and MDM2 associated with male infertility in Chinese population. Asian journal of andrology 2012; 14:691-694.
36. Kang HJ, Feng Z, Sun Y, Atwal G, Murphy ME, Rebbeck TR, Rosenwaks Z, Levine AJ, Hu W. Single-nucleotide polymorphisms in the p53 pathway regulate fertility in humans. Proc Natl Acad Sci U S A 2009; 106:9761-9766.
37. Alhopuro P, Ylisaukko-Oja SK, Koskinen WJ, Bono P, Arola J, Jarvinen HJ, Mecklin JP, Atula T, Kontio R, Makitie AA, Suominen S, Leivo I, Vahteristo P, Aaltonen LM, Aaltonen LA. The MDM2 promoter polymorphism SNP309T-->G and the risk of uterine leiomyosarcoma, colorectal cancer, and squamous cell carcinoma of the head and neck. J Med Genet 2005; 42:694-698.
38. Hong Y, Miao X, Zhang X, Ding F, Luo A, Guo Y, Tan W, Liu Z, Lin D. The role of P53 and MDM2 polymorphisms in the risk of esophageal squamous cell carcinoma. Cancer Res 2005; 65:9582-9587.
39. Zhang X, Miao X, Guo Y, Tan W, Zhou Y, Sun T, Wang Y, Lin D. Genetic polymorphisms in cell cycle regulatory genes MDM2 and TP53 are associated with susceptibility to lung cancer. Hum Mutat 2006; 27:110-117.
40. Excoffier L, Laval G, Schneider S. Arlequin (version 3.0): an integrated software package for population genetics data analysis. Evolutionary bioinformatics online 2005; 1:47-50.
41. Risch N, de Leon D, Ozelius L, Kramer P, Almasy L, Singer B, Fahn S, Breakefield X, Bressman S. Genetic analysis of idiopathic torsion dystonia in Ashkenazi Jews and their recent descent from a small founder population. Nat Genet 1995; 9:152-159.
42. Bengtsson BO, Thomson G. Measuring the strength of associations between HLA antigens and diseases. Tissue antigens 1981; 18:356-363.
43. Diaz GA, Gelb BD, Risch N, Nygaard TG, Frisch A, Cohen IJ, Miranda CS, Amaral O, Maire I, Poenaru L, Caillaud C, Weizberg M, Mistry P, Desnick RJ. Gaucher disease: the origins of the Ashkenazi Jewish N370S and 84GG acid beta-glucosidase mutations. Am J Hum Genet 2000; 66:1821-1832.
44. Howie BN, Donnelly P, Marchini J. A flexible and accurate genotype imputation method for the next generation of genome-wide association studies. PLoS Genet 2009; 5:e1000529.