
INTRODUCTION
Immune checkpoint inhibitors have become major players in cancer treatment with FDA-approval of nivolumab for the treatment of recurrent Hodgkin’s lymphoma, non-small cell lung cancer (NSCLC), metastatic renal cell carcinoma, and melanoma and recent approval of pembrolizumab for the treatment of NSCLC and melanoma. Tumor cells can generate an immune suppressive environment by upregulation of the programmed death ligand-1 (PD-L1) on their cell membrane. Interaction with its receptor programmed cell death-1 (PD-1) on CD8+ T lymphocytes (TL) renders the TL inactive, thus preventing killing of tumor cells [1]. Inhibition of this interaction by anti-PD-1 antibodies can reinstate cytotoxic activity of TLs leading to subsequent killing of tumor cells [2, 3].
Sarcomas are rare, highly malignant bone and soft tissue tumors with a relatively high incidence in children, adolescents and young adults (AYA). Over 70 subtypes exist. The most common primary bone tumors in children and adolescents are osteosarcoma and Ewing sarcoma with a 5-year survival of 60–78% for localized disease and 20-30% for metastatic disease [4, 5]. Rhabdomyosarcoma is the most common soft tissue sarcoma (STS) in pediatric patients with approximately 80% presenting with embryonal rhabdomyosarcoma and 20% with alveolar rhabdomyosarcoma. Low and intermediate risk groups show a 5- and 4-year event-free survival of 88% and 76%, respectively, while the high risk group shows a 5-year survival of 25–40% [6, 7]. The most common non-rhabdomyosarcoma STS is the synovial sarcoma with a peak incidence in adolescents and young adults. Similar to rhabdomyosarcoma, survival rates depend on low risk or high risk status with 88% and 18% 5-year disease-free survival, respectively [8]. Desmoplastic small round cell tumors (DSRCTs) are a very rare subtype with an incidence peak in young adult patients and a male predominance. Survival rates are limited to a 5-year survival of 15%, limited treatment options exist and tumors respond poorly to chemotherapy [9, 10]. Genetically several sarcoma subtypes are characterized by specific gene fusions. Ewing sarcoma is most commonly characterized by the EWSR1-FLI1 or EWSR1-ERG translocation [11]. Fusion-positive alveolar rhabdomyosarcoma is characterized by the PAX3-FOXO1 or PAX7-FOXO1 translocation and synovial sarcomas by the SS18-SSX1 or SS18-SSX2 translocation [8, 12]. Similar to Ewing sarcoma, DSRCTs present with an EWSR1 translocation that in DSRCTs fuses with the WT1 gene [9]. Multimodality treatment is the standard therapy in sarcoma consisting of (neo)adjuvant chemotherapy, surgery and/or radiotherapy. All chemotherapy regimens consist of multiple chemotherapeutic agents specified for each individual sarcoma subtype. Despite the use of multimodality treatment the survival rates have stagnated and the need for new therapeutic options is high.
Little is known about clinical effects of PD-1 blockade and expression of PD-1, PD-L1 and CD8+ lymphocytes in tumors of young sarcoma patients. Recent studies describing their expression in sarcomas show conflicting data on expression levels and clinical associations. Paydas et al. described PD-1 and PD-L1 expression in a variety of sarcoma subtypes with an overall expression of PD-1 in 17% and PD-L1 in 29% of the tumors (n = 65). Expression per subtype ranged from 20–66%, 25–33% and 20–33% for PD-1, PD-L1 and PD-1+PD-L1+, respectively, and no correlation with clinical outcome was observed [13]. In contrast, Kim et al. described PD-L1 in a larger group of STS (n = 82) with expression ranging from 33–53% and an association with worse overall survival (OS) [14]. Previous to these studies, the presence of both PD-L1 expression and CD8+ lymphocytes was described in a variety of sarcomas (n = 59), with relatively high PD-L1 expression for osteosarcoma, Ewing sarcoma and rhabdomyosarcoma. PD-L1 expression per sarcoma subtype ranged from 47–89% and was not associated with clinical outcome. However, PD-L1 in combination with high CD8 levels were associated with better survival which further increased if more than 10% of the CD8+ lymphocytes were PD-1+ [15]. Others examined either only PD-L1 or both PD-1 and PD-L1 in multiple tumor or sarcoma subtypes. Expression ranged from 0–17% for PD-L1 or 0–75% for PD-1 and 0–100% for PD-L1 [16, 17]. The latter two studies included osteosarcoma, Ewing sarcoma, rhabdomyosarcoma, synovial sarcoma and DSRCT, although limited numbers were included in the study of Movva et al. [16]. No clinical associations were described, and for DSRCTs only PD-L1 expression was determined.
Taken together, the above-mentioned studies do suggest a potential therapeutic role for PD-1 inhibitors in (a subgroup of) sarcomas. However, differences in expression levels and clinical association were found and are possibly due to variations in sample size, the primary antibody used, or access to patient data (Supplementary Table 1). In order to further explore and clarify the potential of PD-1 blockade in young sarcoma patients, the expression and clinical association of PD-1, PD-L1 and the presence of CD8+ lymphocytes were assessed in (high-grade) primary untreated tumors (n = 208), consisting of osteosarcoma (n = 46), Ewing sarcoma (n = 32), alveolar rhabdomyosarcoma (n = 20), embryonal rhabdomyosarcoma (n = 77) and synovial sarcoma (n = 22). In addition, we are the first to describe the expression of PD1 and CD8 in a cohort of DSRCTs (n = 11).
RESULTS
PD-1 and PD-L1 expression and the presence of CD8+ lymphocytes in primary sarcoma
PD-1 and PD-L1 expression and the presence of CD8+ lymphocytes were assessed in primary osteosarcoma (n = 46), Ewing sarcoma (n = 32), alveolar rhabdomyosarcoma (n = 20), embryonal rhabdomyosarcoma (n = 77), synovial sarcoma (n = 22) and DSRCT (n = 11) and subdivided in negative (0–10 (%)), positive (10–50 (%)) or high positive (≥ 50 (%)) expression (Table 1 and Figure 1). Individual subtypes showed varying levels of expression, with the most prominent expression in DSRCTs (Table 2). Interestingly, nine out of 11 DSRCTs expressed PD-1 on the tumor in 10–50% of the tumor (9%) or in ≥ 50% of the tumor (PD-1high) (73%) (Figure 2A). One DSRCT showed both PD-1 and PD-L1 expression on the tumor and CD8+ lymphocytes in the tumor. Overall, seven DSRCTs had CD8+ lymphocytes in the tumor, with one expressing high levels of CD8 (CD8high). PD1 expression on the tumor was also detected in 19% of Ewing sarcomas (6% positive and 13% high positive) (Figure 2B). PD-1 expression on tumor infiltrating lymphocytes (TILs) was predominantly detected in synovial sarcomas (18%) (Figure 2C). Sixteen percent of embryonal rhabdomyosarcomas expressed PD-L1, with high PD-L1 expression (PD-L1high) in 6% of all examined cases. All subtypes showed CD8+ lymphocytes in the tumor in at least 30% of cases. In addition, a subset of each subtype expressed CD8high, with the most prominent expression in osteosarcoma (35%) (Table 2).
Table 1: Patient characteristics per individual sarcoma subtype
Tumor type |
Characteristics |
N (%) |
|
|---|---|---|---|
OST (N= 46) |
Gender |
Male |
24 (52) |
Female |
22 (48) |
||
Age at diagnosis |
< 18 y |
14 (30) |
|
≥ 18 y |
32 (70) |
||
Metastases |
Yes |
24 (52) |
|
No |
22 (48) |
||
Initial metastases |
3 (13)a |
||
Follow-up data available |
OS |
46 (100) |
|
EFS |
46 (100) |
||
ES (N = 32) |
Gender |
Male |
17 (53) |
Female |
15 (47) |
||
Age at diagnosis |
< 18 y |
25 (78) |
|
≥ 18 y |
7 (22) |
||
Translocation |
EWSR1-FLI1 |
30 (94) |
|
EWSR1-ERG |
1 (3) |
||
Positive (not specified) |
1 (3) |
||
Metastases |
Yes |
11 (34) |
|
No |
21 (66) |
||
Initial metastases |
5 (45)a |
||
Follow-up data available |
OS |
32 (100) |
|
EFS |
32 (100) |
||
ARMS (N = 20) |
Gender |
Male |
10 (50) |
Female |
10 (50) |
||
Age at diagnosis |
< 18 y |
13 (65) |
|
≥ 18 y |
7 (35) |
||
Translocation |
PAX3-FOXO1 |
17 (85) |
|
PAX7-FOXO1 |
1 (5) |
||
Positive (not specified) |
2 (10) |
||
Metastases |
Yes |
9 (45) |
|
No |
5 (25) |
||
Unknown |
6 (30) |
||
Initial metastases |
4 (44)a |
||
Follow-up data available |
OS |
20 (100) |
|
EFS |
17 (85) |
||
ERMS (N = 77) |
Gender |
Male |
51 (66) |
Female |
26 (34) |
||
Age at diagnosis |
< 18 y |
63 (82) |
|
≥ 18 y |
14 (18) |
||
Metastases |
Yes |
4 (5) |
|
No |
46 (60) |
||
Unknown |
27 (35) |
||
Initial metastases |
2 (50)a |
||
Follow-up data available |
OS |
50 (64) |
|
EFS |
50 (64) |
||
SyS (N= 22) |
Gender |
Male |
14 (64) |
Female |
8 (36) |
||
Age at diagnosis |
< 18 years |
7 (32) |
|
≥ 18 years |
15 (68) |
||
Translocation |
SS18-SSX1 |
17 (77) |
|
SS18-SSX2 |
5 (23) |
||
Metastases |
Yes |
10 (45) |
|
No |
11 (50) |
||
Unknown |
1 (5) |
||
Initial metastases |
0 (0)a |
||
Follow-up data available |
OS |
21 (95) |
|
EFS |
22 (100) |
||
DSRCT (N = 11) |
Gender |
Male |
7 (64) |
Female |
4 (36) |
||
Age at diagnosis |
< 18 y |
4 (36) |
|
≥ 18 y |
7 (64) |
||
Translocation |
EWSR1-WT1 |
11 (100) |
|
Metastases |
Yes |
6 (55) |
|
No |
1 (9) |
||
Unknown |
4 (36) |
||
Initial metastases |
6 (55)a |
||
Follow-up data available |
OS |
8 (73) |
|
EFS |
8 (73) |
N: number of primary tumors, OST: osteosarcoma, ES: Ewing sarcoma, ARMS: alveolar rhabdomyosarcoma, ERMS: embryonal rhabdomyosarcoma, SyS: synovial sarcoma, DSRCT: desmoplastic small round cell tumor, DOD: death of disease, CR: complete response, PD: progressive disease, apercentage calculation: (total with initial metastases/total with metastases)*100%.
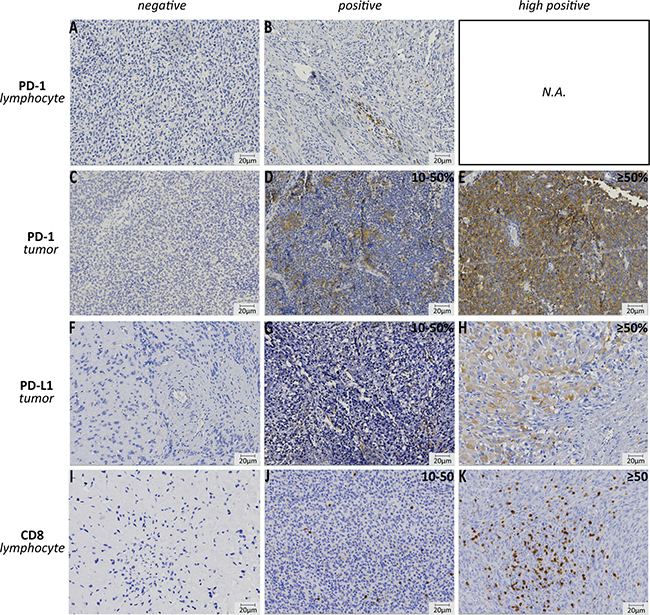
Figure 1: Immunohistochemistry of PD-1, PD-L1 and CD8 expression. Examples of negative and positive PD-1 expression on lymphocytes (embryonal rhabdomyosarcoma, A–B); negative, positive (10–50%) and high (≥ 50%) PD-1 expression on tumor cell (Ewing sarcoma, C–E); negative, positive (10–50%) and high (≥ 50%) PD-L1 expression on tumor cell (embryonal rhabdomyosarcoma, F–H); negative, positive (10–50) and high (≥ 50) number of CD8+ lymphocytes in the tumor (osteosarcoma, I–K). N.A.: not applicable.
Table 2: PD-1, PD-L1 expression and the presence of CD8+ lymphocytes in primary sarcoma tumors
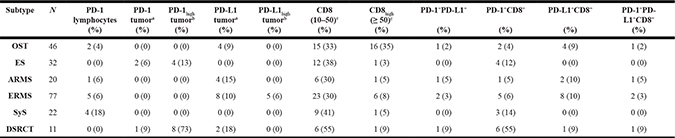
N = total number of primary tumors, OST: osteosarcoma, ES: Ewing sarcoma, ARMS: alveolar rhabdomyosarcoma, ERMS: embryonal rhabdomyosarcoma, SyS: synovial sarcoma, a10–50% positive tumor cells, b ≥ 50% positive tumor cells, cin the tumor.
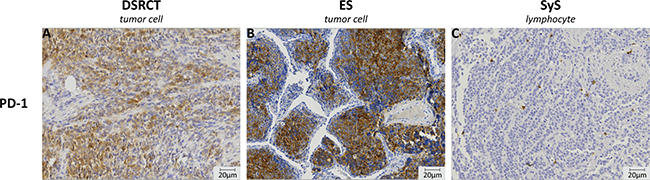
Figure 2: Immunohistochemistry of PD-1 expression on the tumor cell and on tumor infiltrating cells. PD-1 expression was observed to be present on the tumor cells in both desmoplastic small round cell tumor (DSRCT) (A) and Ewing sarcoma (ES) (B). All other subtypes showed PD-1 expression on tumor infiltrating cells. An image of PD1+ lymphocytes in synovial sarcoma (SyS) is given (C). Images were taken at 20× magnification.
Correlation between PD-1, PD-L1 and CD8 expression
Embryonal rhabdomyosarcoma showed a significant correlation between PD-1 on TILs (PD-1TIL) and CD8+ lymphocytes in the tumor (p = 0.006) and a trend for PD-L1 and CD8+ (p = 0.065). Other subtypes showed no correlations between PD-1, PD-L1 and CD8 expression (Table 3).
Table 3: Correlation between PD-1, PD-L1 expression and the presence of CD8+ lymphocytes
Subtype |
PD-1TILand PD-L1 |
PD-1TILand CD8 |
PD-1tumorand CD8 |
PD-L1 and CD8 |
PD-1+PD-L1+ and CD8 |
|---|---|---|---|---|---|
OST |
- |
- |
- |
- |
- |
ES |
- |
- |
- |
- |
- |
ARMS |
- |
- |
- |
- |
- |
ERMS |
- |
p = 0.006a |
- |
p = 0.065b |
- |
SyS |
- |
- |
- |
- |
- |
DSRCT |
- |
- |
- |
- |
- |
Chi-square or Fisher’s exact analysis. -: not significant, p-value < 0.05 is considered significant, p-value < 0.1 is considered a trend, PD-1TIL: PD-1 expression on tumor infiltrating lymphocyte, PD-1tumor: PD-1 expression on tumor cell, OST: osteosarcoma, ES: Ewing sarcoma, ARMS: alveolar rhabdomyosarcoma, ERMS: embryonal rhabdomyosarcoma, SyS: synovial sarcoma, a0% CD8–: PD-1TIL+ vs. 17% CD8+: PD-1TIL+, b10% CD8–: PD-L1+ vs. 28% CD8+: PD-L1+.
Correlation between PD-1, PD-L1, CD8+ expression and patients characteristics
Patient characteristics were specified per subtype and when available gender, age, tumor size, tumor location, tumor grade, metastases and treatment response were correlated to PD-1, PD-L1 and CD8+ expression (Tables 1, 4 and Supplementary Table 1). Male gender significantly correlated or had a trend with the presence of CD8+ lymphocytes in the tumor for Ewing sarcoma (p = 0.026) and DSRCTs (p = 0.088), respectively. In addition, soft tissue origin of Ewing sarcomas significantly correlated with PD-1 expression on the tumor (p = 0.007) (Table 4). In embryonal rhabdomyosarcoma small tumor size (< 5 cm) significantly correlated with CD8+ lymphocytes in the tumor (p = 0.022). In contrast, in osteosarcoma large tumor size showed a trend towards more CD8+ tumors (p = 0.085) (Table 4). In alveolar rhabdomyosarcoma, PD-L1+ and PD-L1+CD8+ tumors significantly correlated with low IRS grade (p = 0.005; p = 0.033), whereas PD-1+, PD-1+PD-L1+, PD-1+CD8+ and PD-1+PD-L1+CD8+ tumors showed a trend towards a low IRS grade (p = 0.071). PD-L1 expression also correlated with the absence of metastases in ARMS (p = 0.027) (Table 4). No correlation with age at diagnosis, presence of initial metastases or response to treatment existed in any of the subtypes (Table 4).
Table 4: Correlation between PD-1, PD-L1 expression and the presence of CD8+ lymphocytes and clinical-pathological characteristics per individual sarcoma subtype
Subtype |
Characteristic |
Expression |
||||||
|---|---|---|---|---|---|---|---|---|
PD-1+ |
PD-L1+ |
CD8+ |
PD-1+PD-L1+ |
PD-1+CD8+ |
PD-L1+CD8+ |
PD-1+PD-L1+CD8+ |
||
OST |
Gender |
- |
- |
- |
- |
- |
- |
- |
Age |
- |
- |
- |
- |
- |
- |
- |
|
Tumor size |
- |
- |
p = 0.085a |
- |
- |
- |
- |
|
Initial metastases |
- |
- |
- |
- |
- |
- |
- |
|
Occurrence metastases |
- |
- |
- |
- |
- |
- |
- |
|
ES |
Gender |
- |
- |
p = 0.026b |
- |
- |
- |
- |
Age |
- |
- |
- |
- |
- |
- |
- |
|
Tumor size |
- |
- |
- |
- |
- |
- |
- |
|
Location (bone vs. soft tissue) |
p = 0.007c |
- |
- |
- |
p = 0.087d |
|||
Initial metastases |
- |
- |
- |
- |
- |
- |
- |
|
Occurrence metastases |
- |
- |
- |
- |
- |
- |
- |
|
Response to post-surgery treatment |
- |
- |
- |
- |
- |
- |
- |
|
ARMS |
Gender |
- |
- |
- |
- |
- |
- |
- |
Age |
- |
- |
- |
- |
- |
- |
- |
|
Tumor size |
- |
- |
- |
- |
- |
- |
- |
|
(un) favorable location |
- |
- |
- |
- |
- |
- |
- |
|
IRS grade |
p = 0.071e |
p = 0.005f |
- |
p = 0.071g |
p = 0.071h |
p = 0.033i |
p = 0.071j |
|
Initial metastases |
- |
- |
- |
- |
- |
- |
- |
|
Occurrence metastases |
- |
p = 0.027k |
- |
- |
- |
- |
- |
|
Response to post-surgery treatment |
- |
- |
- |
- |
- |
- |
- |
|
ERMS |
Gender |
- |
- |
- |
- |
- |
- |
- |
Age |
- |
- |
- |
- |
- |
- |
- |
|
Tumor size |
- |
- |
p = 0.022l |
- |
- |
- |
- |
|
(un) favorable location |
- |
- |
- |
- |
- |
- |
- |
|
IRS grade |
- |
- |
- |
- |
- |
- |
- |
|
Initial metastases |
- |
- |
- |
- |
- |
- |
- |
|
Occurrence metastases |
- |
- |
- |
- |
- |
- |
- |
|
Response to post-surgery treatment |
- |
- |
- |
- |
- |
- |
- |
|
SyS |
Gender |
- |
- |
- |
- |
- |
- |
- |
Age |
- |
- |
- |
- |
- |
- |
- |
|
Tumor size |
- |
- |
- |
- |
- |
- |
- |
|
French grading |
- |
- |
- |
- |
- |
- |
- |
|
Mitotic index |
- |
- |
- |
- |
- |
- |
- |
|
Initial metastases |
- |
- |
- |
- |
- |
- |
- |
|
Occurrence metastases |
- |
- |
- |
- |
- |
- |
- |
|
Tumor necrosis |
- |
- |
- |
- |
- |
- |
- |
|
DSRCT |
Gender |
- |
- |
p = 0.088m |
- |
- |
- |
- |
Age |
- |
- |
- |
- |
- |
- |
- |
|
Tumor size |
- |
- |
- |
- |
- |
- |
- |
|
Initial metastases |
- |
- |
- |
- |
- |
- |
- |
|
Occurrence metastases |
- |
- |
- |
- |
- |
- |
- |
|
OST: osteosarcoma, ES: Ewing sarcoma, ARMS: alveolar rhabdomyosarcoma, ERMS: embryonal rhabdomyosarcoma, SyS: synovial sarcoma, -: no significant correlation, p-value < 0.05 is considered significant, p-value < 0.1 is considered a trend.a92% CD8+: > 5 cm vs. 67% CD8–: > 5 cm, bCD8+: 77% is male vs. CD8–: 37% is male, cPD-1tumor: 50% soft tissue ES vs. 5% bone ES, dPD-1tumor+CD8+: 30% soft tissue ES vs. 5% bone ES, ePD-1+: IRS1 vs. PD-1-: IRS2-4, fPD-L1+: IRS1-2 vs. PD-L1–: IRS3-4, gPD-1+PD-L1+: IRS1 vs. not PD-1+PD-L1+: IRS2-4, hPD-1+CD8+: IRS1 vs. not PD-1+CD8+: IRS2-4, iPD-L1+CD8+: IRS1/2 vs. not PD-L1+CD8+: IRS2-4, jPD-1+PD-L1+CD8+: IRS1 vs. not PD-1+PD-L1+CD8+: IRS2-4, kPD-L1+: no metastases vs. PD-L1–: 82% have metastases, l74% CD8–: ≥ 5 cm vs. 36% CD8+: ≥ 5 cm, mCD8+: 86% is male vs. CD8–: 25% is male.
Association of clinical outcome with PD-1, PD-L1 and CD8 expression
PD-L1 expression correlated with better EFS, overall survival (OS) and metastases-free survival (MFS) in alveolar rhabdomyosarcoma (EFS: p = 0.009, OS: p = 0.049, MFS: p = 0.032) (Figure 3A–3C) and there was a trend towards better EFS for combined PD-L1 and CD8 expression (p = 0.069) (Figure 3D). In synovial sarcoma, the presence of high CD8+ in the tumor showed significantly worse MFS (p = 0.036) and a trend towards worse EFS (p = 0.065) (Figure 3E–3F). Whereas, expression of PD-1 (p = 0.069), PD-1+PD-L1+ (p = 0.058), PD-1+CD8+ (p = 0.069) and PD-1+PD-L1+CD8+ (p = 0.058) showed a trend towards better MFS in osteosarcoma (Figure 3G–3H). Better EFS was observed for the DSRCT patient with the PD-1+PD-L1+CD8+ tumor (p = 0.008) (data not shown). In addition, co-expression of PD-L1 and CD8 (n = 2) showed a trend towards better OS (p = 0.084) and EFS (event free during follow-up: n = 1, p = 0.083) (Figure 3I–3J).
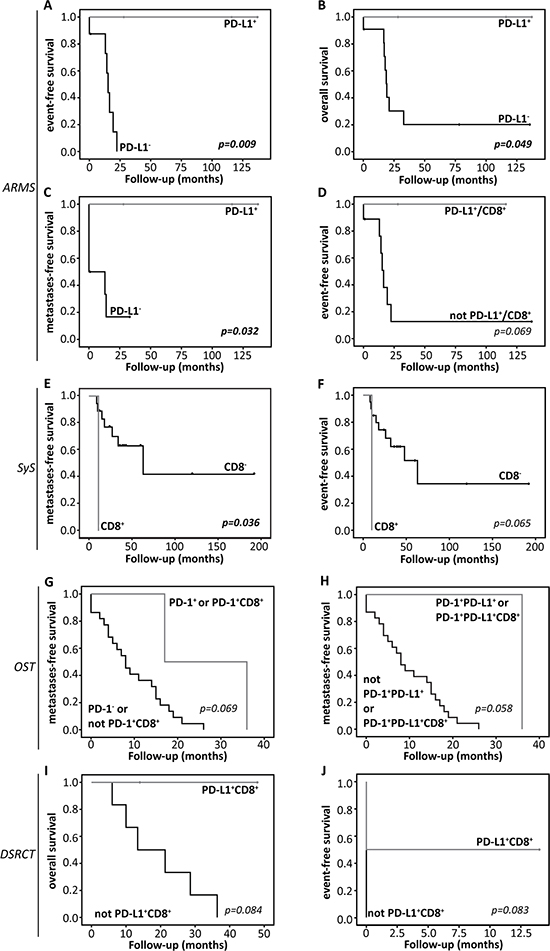
Figure 3: Kaplan-Meier survival analysis. Overall survival (OS), event-free survival (EFS) or metastases-free survival (MFS) curves for (A–D) alveolar rhabdomyosarcoma (ARMS), (E–F) synovial sarcoma (SyS), (G–H) osteosarcoma (OST) or (I–J) desmoplastic small round cell tumors (DSRCT), according to PD-1, PD-L1 expression or presence of CD8+ lymphocytes in the tumor. Detailed information concerning statistical analysis is found in the Materials and Methods section.
Assessment of PD-1 expression and response to nivolumab in Ewing sarcoma and DSRCT cell lines
For functional analysis of PD-1 on Ewing sarcoma and DSRCT tumor cells, 10 Ewing sarcoma cell lines and 1 DSRCT cell line were assessed for PD-1 expression by FACS analysis. Ewing sarcoma cell lines EW8 and TC-32 showed PD-1 expression. EW8 showed lower levels of PD-1 (Figure 4A). All other cell lines, including the DSRCT cell line, were negative for PD-1 (Figure 4B, Supplementary Figure 1). In vitro treatment of EW8 and TC-32 with anti-PD-1 antibody nivolumab did not affect cell viability (Figure 4C).
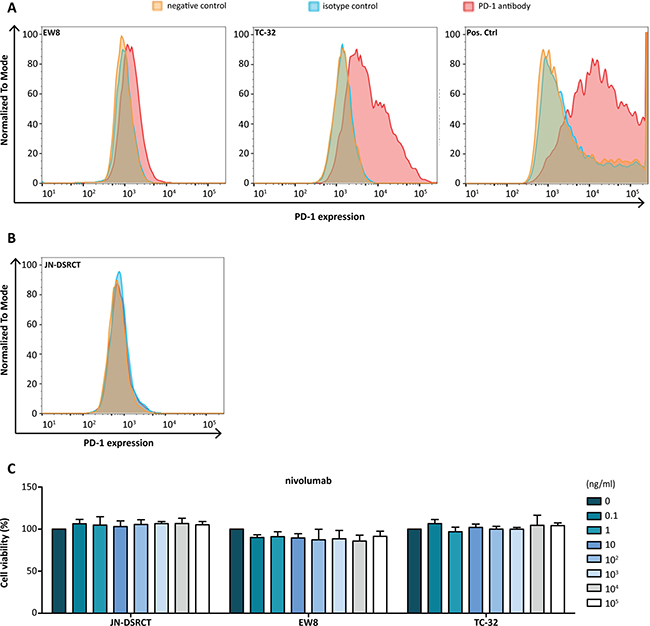
Figure 4: PD-1 expression and effect of anti-PD-1 antibody treatment in Ewing sarcoma cell lines. (A) FACS analysis showed PD-1 expression on Ewing sarcoma cell line EW8 and TC-32. EW8 showed low PD-1 expression. PD-1-transfected CHO cells were used as a positive control. (B) The DSRCT cell line JN-DSRCT was negative for PD-1 and subsequently used as a negative control. (B) Anti-PD-1 antibody (nivolumab) treatment of JN-DSRCT, EW8, TC-32 cell lines had no effect on cell viability. Cell viability of untreated cells was set at 100%.
DISCUSSION
Children and AYA suffering from sarcoma are in need of novel therapies, as the current poor survival rates and the treatment-associated toxicities have a major impact on life expectancy and quality of life [18, 19]. In the current study we explored the potential of PD-1 blockade in sarcoma subtypes and showed that expression and clinical association of PD-1 and PD-L1 and the presence of CD8+ lymphocytes is sarcoma subtype dependent. In addition, for the first time PD-1 expression was observed on Ewing sarcoma and DSRCT tumor cells.
Osteosarcoma showed low levels of PD-1 and PD-L1 expression and higher levels of CD8+ lymphocytes in the tumor (Table 2). Recently, PD-L1 expression was shown to be associated with worse 5-year EFS and higher infiltration of immune cells [20, 21]. In addition, PD-L1 expression was shown to be higher when whole slide sections were assessed compared to tissue micro array (TMA) [21]. In the current study, 46 primary tumors were examined on TMA and when considering the previously found discrepancy between TMA and whole slide analysis, the low PD-1 and PD-L1 expression levels could be the result of an underestimation of the actual expression in osteosarcoma. Another explanation could be that in particular osteosarcoma metastases express PD-1 and PD-L1 [20, 22]. Examination of metastatic samples was beyond the scope of this study and we could thus not verify this finding. High levels of CD8+ lymphocytes in the tumor are in line with previous findings, as several studies showed PD-1+ immune cells in both primary and metastatic osteosarcoma patients [20–23]. In the current study, immune checkpoint expression showed a positive correlation with MFS (Figure 3G–3H). A possible explanation could be that PD-1 and CD8 expression suggest higher anti-tumor immune pressure, resulting in a response of the tumor cell by increasing PD-L1 on the cell membrane. Survival most likely depends on the balance between anti-tumor immunity and tumor evasion. Until this balance switches from anti-tumor immunity towards tumor evasion via PD-1 and PD-L1 interaction, better control of tumor progression could lead to prolonged metastases-free survival [24–26].
Interestingly, a subset of Ewing sarcoma showed PD-1 expression on the tumor cells, instead of on the TILs (Table 2, Figure 2B). In melanoma and esophageal adenocarcinoma PD-1 expression was similarly seen on tumor cells. In melanoma targeting of tumor-intrinsic PD-1 in vivo was found to reduce tumor growth and in esophageal adenocarcinoma PD-1 expression on tumor cells associated with advanced disease [27–29]. In addition, efficacy of PD-1 blockade was reported in one Ewing sarcoma patient with a sustained response to treatment [30]. Our functional analysis of PD-1 on ES tumor cells showed PD-1 expression on 2/10 ES cell lines, however; targeting of PD-1 in vitro did not have an effect on cell viability. Of note, little is known about the mechanism of action of PD-1 on a tumor cell and it could be that, similar to what was found in melanoma, interaction with tumor cell intrinsic PD-L1 leads to tumor progression [28]. In vivo studies will help to determine the potential of PD-1 targeting in Ewing sarcoma. Others showed the expression of PD-1 on TILs and PD-L1 in Ewing sarcoma. Previous studies showed a higher percentage of positive tumors, although sample sizes were significantly lower compared to our cohort [13–15, 31]. Similar to a previous finding [13], bone and soft-tissue Ewing sarcoma showed a difference in expression. In order to determine whether tissue of origin might influence the potential of PD-1 blockade, further research is necessary to verify the differences between bone and soft tissue Ewing sarcoma. Our findings suggest that a subset of ES patients might benefit from PD-1 blockade, although further research is necessary.
PD-1+ TILs and PD-L1 have been associated with poor prognosis in STS [14, 31]. In comparison to previous findings, the current study showed lower levels of PD-L1 expression for both alveolar and embryonal rhabdomyosarcoma [14, 15, 31]. However, this might be explained by the differences in sample size and antibodies used. In addition, we only examined fusion-positive ARMS which might have an influence on the expression level. PD-L1 expression in alveolar rhabdomyosarcoma associated with better EFS, OS and MFS (Figure 3A, 3C). In addition, PD-L1 alone or co-expression with CD8 significantly correlated with a lower IRS grade and PD-L1 expression alone correlated with the absence of metastases (Table 4). Similar to other tumor types [32], the positive correlation of PD-L1 could, instead of tumor immune evasion, indicate a response of the tumor cell to high immune pressure by CD8+ lymphocytes and could lead to a better prognosis as long as the balance is in favor of anti-tumor immunity [24–26].
For embryonal rhabdomyosarcoma no association with survival was observed. However, PD-1 expression correlated with the presence of CD8+ lymphocytes in the tumor, and a trend for co-expression of PD-L1 and CD8 was seen (Table 3). High PD-L1 expression and high numbers of CD8+ lymphocytes were present in a small percentage of tumors (Table 2). The correlation with PD-1 and the presence of high PD-L1 and CD8+ in a small percentage of tumors suggest that PD-1 blockade might be a therapeutic option for a subset of embryonal rhabdomyosarcoma patients.
Synovial sarcoma showed low levels of PD-1 and PD-L1 expression and relatively high CD8 expression (Table 2). The presence of high levels of CD8+ lymphocytes in the tumor correlated with a worse MFS and showed a trend towards worse EFS (Figure 3E–3F). Recently, Nowicki et al. also examined PD-1, PD-L1 and CD8 in synovial sarcomas [33]. They showed a similar association for CD8 with worse progression-free survival (PFS), in addition to worse PFS for PD-1 expression. The expression of PD-1 and CD8 on lymphocytes in the tumor are in line with our findings. However, the expression of PD-L1 on synovial sarcoma cells could not be observed in our cohort. Overall, expression of immune checkpoint could be a negative prognostic marker in synovial sarcoma and further research into the expression of PD-1, PD-L1 and CD8 is of interest.
For the first time PD-1 and CD8 expression are described in a cohort of DSRCTs. Two studies have previously examined PD-L1 expression in DSRCTs. Similar to our finding, Movva et al. showed PD-L1 expression, although in a small cohort of DSRCTs (n = 2) [16]. Inaguma et al. examined a larger cohort and did not detect PD-L1 [17]. Despite the differences in expression, in our study the majority of DSRCTs showed high PD-1 expression on tumor cells and the co-expression of PD-1, PD-L1 and CD8 suggests that the PD-1/PD-L1 axis could be present in a small subset of DSRCTs (Table 2) (Figure 2A). Interestingly, similar to Ewing sarcoma, DSRCT has a characteristic translocation involving EWSR1, calling for investigation into the effects of this gene on PD-1 expression. Better EFS was observed for the PD-1+PD-L1+CD8+ patient, This patient showed no events during the follow-up period (14 months) and had continued survival at the time of data acquisition. Similar to other subtypes, this suggests a more dominant anti-tumor immune response in this patient. Since only a small cohort has been examined more research is necessary to strengthen the detected expression levels and possible clinical implications of immune checkpoint expression in DSRCTs.
Overall, the current study shows both similarities and differences with previously found expression data. The differences in expression could however be the result of different antibodies for immunohistochemistry, as sensitivity between antibodies differs. In addition, as no consensus has been reached for expression analysis, the threshold for positive expression varies between studies (Supplementary Table 2) [32]. Moreover, recent studies have shown that expression levels, on their own, might not be sufficient to predict a response to immune checkpoint blockade. Factors that could be of importance are the level of PD-1+ TILs following treatment [34], PD-L1 on TILs before treatment [35] and the mutational load of the tumor [36]. Further research is needed to determine whether these predictive markers also apply to sarcomas. In addition, we only assessed PD-L1 expression, PD-L2 is a second ligand of PD-1 and similarly capable of reducing T cell activity [37]. Even though PD-L1 has been shown to have a higher frequency in malignancies, the analysis of PD-L2 expression in sarcomas could be of interest [38].
In conclusion, expression and clinical associations of PD-1, PD-L1 and CD8+ lymphocytes in the tumor are sarcoma subtype dependent. This difference between subtypes underlines the necessity for further research into the specific mechanistic aspects of immune evasion per subtype in order to determine whether PD-1 blockade is of therapeutic interest. In addition, for the first time, PD-1 expression was found to be present on Ewing sarcoma and DSRCT tumor cells instead of TILs. Given the tremendous need for new therapeutic approaches, in particular for DSRCTs, these observations will be further explored.
MATERIALS AND METHODS
Patient characteristics
Primary tumors of 208 sarcoma patients were examined. Table 1 shows the number of tumors per subtype, gender, age at diagnosis, occurrence of (initial) metastases, available follow-up data and, when applicable, genetic translocation for each individual subtype. Supplementary Table 1 shows tumor size, tissue of origin, treatment response and, when applicable, tumor location ((un)favorable), tumor grade and the occurrence of an event or death of disease (DOD).
The study was performed in accordance with the Code of Conduct of the Federation of Medical Scientific Societies in the Netherlands.
Immunohistochemistry
Immunohistochemistry analysis was performed to specifically investigate PD-1 and PD-L1 expression and the presence of CD8+ lymphocytes in the tumor. Tonsil (PD-L1+, PD-1+ and CD8+) and appendix (CD8+ and PD-1+) served as positive controls. Immunohistochemistry was performed on 4μm-thick formalin-fixed paraffin-embedded (FFPE) sections of DSRCT and tissue microarrays (TMAs) (core size 1 or 2 mm) of osteosarcoma, Ewing sarcoma, alveolar rhabdomyosarcoma, embryonal rhabdomyosarcoma and synovial sarcoma to allow simultaneous examination of patient specimens under identical conditions. Sections were deparaffinized in xylol and rehydrated through a graded ethanol into water series. Antigen retrieval was performed by heating the slides in 10 mM sodium citrate buffer, pH6 (PD-1 and PD-L1) or in EDTA buffer, pH9 (CD8) for 10 min at 100°C. Endogenous peroxidase activity was blocked with 3% H2O2 in methanol or distilled water for 10 min at RT. Subsequently, sections were incubated with monoclonal rabbit anti-PD-L1 (1:200, clone E1L3N, Cell Signaling Technology), monoclonal mouse anti-PD-1 (1:20, clone MRQ-22, Cell Marque) or monoclonal mouse anti-CD8 (1:80, clone C8/144B, Dako) in antibody diluent in a humidified chamber overnight at 4°C (PD-L1) or 1h at RT (PD-1 and CD8). For PD-1 a 15min incubation step at RT with post-antibody blocking (BrightVision Ultimate Plus, ImmunoLogic) was performed. Next, sections were incubated with Poly-HRP-Anti-mouse/rabbit/rat IgG (ImmunoLogic) in PBS-Tween20 0.05% (1:1) for 30 min at RT. Antibody binding was visualized using bright 3,3′-diaminobenzidine (DAB) (ImmunoLogic) for 7 min at RT. Finally, slides were counterstained with haematoxylin, dehydrated and coverslipped.
PD-1 expression on tumor infiltrating cells was scored as either negative (–) or positive (+). PD-1 and PD-L1 expression on the tumor cell was scored as < 10% (negative), 10–50% or ≥ 50% positive tumor cells. All CD8-positive (CD8+) cells were counted and subdivided in three categories: < 10 (–), 10–50 or ≥ 50 positive cells in the tumor. Expression in ≥ 50% of the tumor cells and > 50 CD8+ cells in the tumor were considered high expression (PD-1high, PD-L1high, CD8high). Digital images were generated with VisionTekTM (Sakura, version 2.6) and analyzed at 20x magnification. An example of each staining is given in Figure 2.
Statistical analysis
Statistical analyses were performed using IBM SPSS Statistics 22 and p-value < 0.05 was considered significant and p-value < 0.1 was considered a trend. Relations between categorical parameters were assessed by Chi-square or Fisher’s exact testing and associations with overall (OS), event-free (EFS) and metastases-free survival (MFS) were assessed by the Kaplan-Meier method with Log rank test. Tumors positive for one marker or a combination were compared to tumors negative for that particular marker or combination. A distinction between the different levels of expression (< 10, 10–50, ≥ 50) was made in the analysis.
Cell lines
Ewing sarcoma cell lines ES1, ES2, ES4, ES7, ES8 and EW8 were generously provided by dr. Peter Houghton of the Pediatric Preclinical Testing Program (PPTP). Ewing sarcoma cell lines TC-32, SK-N-DW, SK-N-MC and CHP-100 were generously provided by dr. Friederike Meyer-Wentrup of the Princess Máxima center for Pediatric Oncology and the DSRCT cell line was generously provided by dr. Janet Shipley of The Institute of Cancer Research. All cell lines were authenticated by determining the disease-specific genetic translocation (EWSR1-FLI1/ERG for Ewing sarcoma and EWSR1-WT1 for DSRCT). Ewing sarcoma cell lines were cultured in RPMI-1640 medium (ES1, ES2, ES4, ES7, ES8 and EW8, Lonza Benelux BV, Breda, The Netherlands) or DMEM medium (TC-32, SK-N-DW, SK-N-MC and TC-32CHP-100, Lonza). JN-DSRCT was cultured in DMEM/F12 GlutaMAXTM medium (Gibco). PDCD1-transfected CHO cell line was culture in Ham’s F12 medium (Gibco). Media were supplemented with 10% fetal bovine serum (FBS) (Gibco) and 1% penicillin/streptomycin (Lonza). All cell lines were cultured in a humidified atmosphere of 5% CO2/95% O2 air at 37ºC.
Flow cytometry
PD-1 expression was analyzed by flow cytometry: 1 × 10⁵ cells per cell line were washed in PBS with 2% FBS (Gibco) and 0.5% BSA (Sigma) (PBA) followed by 20 min incubation at RT with either mouse anti-human PD-1 (CD279) antibody (BB515, 1:20 in PBA, BD Horizon) or mouse IgG1 κ isotype antibody (BB515 Clone X40, 1:80 in PBA, BD Horizon). CHO cell line transfected with a pcDNA3.1+/C-(K)DYK vector enriched with PDCD1 for 48h acted as a positive control (Lipofectamine 3000 Transfection kitTM, Thermo Scientific). Cells were washed and dissolved in PBA followed by flow cytometry using FACS Verse (BD Biosciences). Data analysis was performed using FLowJo version 10.0.7.
Cell viability assay
Treatment effects of nivolumab (Opdivo® 10 mg/ml) were assessed by MTT assay. All cell lines were seeded in quadruplicate into flat-bottomed 96-well plates at 5000 cells per well and allowed to adhere. Increasing concentrations of nivolumab (0–0.1 mg/ml) were added followed by 72 h (EW8, ES1) or 120 h (TC-32) incubation at 37°C, based on estimated growth rate. Subsequently, 20 μl MTT (5 mg/ml in PBS) was added and cells were again incubated for 3.5 h at 37°C. Medium was removed and the formed formazan crystals were dissolved in 150 μl acidified isopropanol solution. Absorbance was read at 560 nm using an ELISA reader. Data analysis was performed with GraphPad Prism (Version 5.03).
Abbreviations
DSRCT: desmoplastic small round cell tumor, EFS: event-free survival, MFS: metastases-free survival, NSCLC: non-small cell lung cancer, OS: overall survival, PD-1: programmed cell death-1, PD-L1: programmed death ligand-1, STS: soft tissue sarcoma, TIL: tumor infiltrating lymphocyte, TL: T lymphocytes, TMA: tissue microarray, TME: tumor microenvironment.
Authors’ contributions
Authors van Erp, Versleijen-Jonkers, Flucke and Meyer-Wentrup substantially contributed to the conception and design of this paper, the acquisition, analysis and interpretation of the data, the drafting and revision of the paper and approval of the final version. Authors Hillebrandt-Roeffen, van Houdt, van Dam, Gorris, Mentzel, Weidema, Savci, Desar, Merks, van Noesel and Shipley substantially contributed to the acquisition, analysis or interpretation of the data, the revision of the paper and approval of the final version.
ACKNOWLEDGMENTS
This work was funded by a grant of the Dutch Cancer Society sponsored by fundraising activities of private fundraising foundation “Bergh in het Zadel”. The authors would like to thank M. Vlenterie, MSc., dr. C. van Gaal, and dr. W. Breunis for the collection of tumor material and/or follow-up data of a subgroup of tumors. The authors would like to thank dr. Peter Houghton of PPTP for generously providing the Ewing sarcoma cell lines.
CONFLICTS OF INTEREST
No conflicts of interest were disclosed
REFERENCES
1. Boussiotis VA. Molecular and Biochemical Aspects of the PD-1 Checkpoint Pathway. N Engl J Med. 2016; 375: 1767–78. https://doi.org/10.1056/NEJMra1514296.
2. Baumeister SH, Freeman GJ, Dranoff G, Sharpe AH. Coinhibitory Pathways in Immunotherapy for Cancer. Annu Rev Immunol. 2016; 4:539–73. https://doi.org/10.1146/annurev-immunol-032414-112049.
3. Pardoll DM. The blockade of immune checkpoints in cancer immunotherapy. Nat Rev Cancer. 2012; 12:252–64. https://doi.org/10.1038/nrc3239.
4. Durfee RA, Mohammed M, Luu HH. Review of Osteosarcoma and Current Management. Rheumatol Ther. 2016; 3:221–43. https://doi.org/10.1007/s40744-016-0046-y.
5. Gaspar N, Hawkins DS, Dirksen U, Lewis IJ, Ferrari S, Le Deley MC, Kovar H, Grimer R, Whelan J, Claude L, Delattre O, Paulussen M, Picci P, et al. Ewing Sarcoma: Current Management and Future Approaches Through Collaboration. J Clin Oncol. 2015; 33:3036–46. https://doi.org/10.1200/jco.2014.59.5256.
6. Sangkhathat S. Current management of pediatric soft tissue sarcomas. World J Clin Pediatr. 2015; 4:94–105. https://doi.org/10.5409/wjcp.v4.i4.9410.5409/wjcp.v4.i4.94.
7. Hosoi H. Current status of treatment for pediatric rhabdomyosarcoma in the USA and Japan. Pediatr Int. 2016; 58:81–7. https://doi.org/10.1111/ped.12867.
8. Thway K, Fisher C. Synovial sarcoma: defining features and diagnostic evolution. Ann Diagn Pathol. 2014; 18:369–80. https://doi.org/10.1016/j.anndiagpath.2014.09.002.
9. Thway K, Noujaim J, Zaidi S, Miah AB, Benson C, Messiou C, Jones RL, Fisher C. Desmoplastic Small Round Cell Tumor: Pathology, Genetics, and Potential Therapeutic Strategies. Int J Surg Pathol. 2016; 24:672–684. https://doi.org/10.1177/1066896916668637.
10. Bent MA, Padilla BE, Goldsby RE, DuBois SG. Clinical Characteristics and Outcomes of Pediatric Patients with Desmoplastic Small Round Cell Tumor. Rare Tumors. 2016; 8:6145. https://doi.org/10.4081/rt.2016.6145.
11. Wei S, Siegal GP. Round cell tumors of bone: an update on recent molecular genetic advances. Adv Anat Pathol. 2014; 21:359–72. https://doi.org/10.1097/pap.0000000000000036.
12. Parham DM, Barr FG. Classification of rhabdomyosarcoma and its molecular basis. Adv Anat Pathol. 2013; 20:387–97. https://doi.org/10.1097/PAP.0b013e3182a92d0d.
13. Paydas S, Bagir EK, Deveci MA, Gonlusen G. Clinical and prognostic significance of PD-1 and PD-L1 expression in sarcomas. Med Oncol. 2016; 33:93. https://doi.org/10.1007/s12032-016-0807-z.
14. Kim C, Kim EK, Jung H, Chon HJ, Han JW, Shin KH, Hu H, Kim KS, Choi YD, Kim S, Lee YH, Suh JS, Ahn JB, et al. Prognostic implications of PD-L1 expression in patients with soft tissue sarcoma. BMC Cancer. 2016; 16:434. https://doi.org/10.1186/s12885-016-2451-6.
15. Chowdhury F, Dunn S, Mitchell S, Mellows T, Ashton-Key M, Gray JC. PD-L1 and CD8+PD1+ lymphocytes exist as targets in the pediatric tumor microenvironment for immunomodulatory therapy. OncoImmunology. 2015; 4:e1029701. https://doi.org/10.1080/2162402X.2015.1029701.
16. Movva S, Wen W, Chen W, Millis SZ, Gatalica Z, Reddy S, von Mehren M, Van Tine BA. Multi-platform profiling of over 2000 sarcomas: identification of biomarkers and novel therapeutic targets. Oncotarget. 2015; 6:12234–47. https://doi.org/10.18632/oncotarget.3498.
17. Inaguma S, Wang Z, Lasota J, Sarlomo-Rikala M, McCue PA, Ikeda H, Miettinen M. Comprehensive Immunohistochemical Study of Programmed Cell Death Ligand 1 (PD-L1): Analysis in 5536 Cases Revealed Consistent Expression in Trophoblastic Tumors. Am J Surg Pathol. 2016; 40:1133–42. https://doi.org/10.1097/pas.0000000000000653.
18. Harrison DJ, Schwartz C. Survivorship. J Surg Oncol. 2015; 111:648–55. https://doi.org/10.1002/jso.23844.
19. Mansky P, Arai A, Stratton P, Bernstein D, Long L, Reynolds J, Chen D, Steinberg SM, Lavende N, Hoffman K, Nathan PC, Parks R, Augustine E, et al. Treatment late effects in long-term survivors of pediatric sarcoma. Pediatric Blood & Cancer. 2007; 48:192–9. https://doi.org/10.1002/pbc.20871.
20. Sundara YT, Kostine M, Cleven AH, Bovee JV, Schilham MW, Cleton-Jansen AM. Increased PD-L1 and T-cell infiltration in the presence of HLA class I expression in metastatic high-grade osteosarcoma: a rationale for T-cell-based immunotherapy. Cancer Immunol Immunother. 2017; 66:119–28. https://doi.org/10.1007/s00262-016-1925-3.
21. Koirala P, Roth ME, Gill J, Piperdi S, Chinai JM, Geller DS, Hoang BH, Park A, Fremed MA, Zang X, Gorlick R. Immune infiltration and PD-L1 expression in the tumor microenvironment are prognostic in osteosarcoma. Sci Rep. 2016; 6:30093. https://doi.org/10.1038/srep30093.
22. Lussier DM, O’Neill L, Nieves LM, McAfee MS, Holechek SA, Collins AW, Dickman P, Jacobsen J, Hingorani P, Blattman JN. Enhanced T-cell immunity to osteosarcoma through antibody blockade of PD-1/PD-L1 interactions. J Immunother. 2015; 38:96–106. https://doi.org/10.1097/cji.0000000000000065.
23. Zheng W, Xiao H, Liu H, Zhou Y. Expression of programmed death 1 is correlated with progression of osteosarcoma. Apmis. 2015; 123:102–7. https://doi.org/10.1111/apm.12311.
24. Velcheti V, Schalper KA, Carvajal DE, Anagnostou VK, Syrigos KN, Sznol M, Herbst RS, Gettinger SN, Chen L, Rimm DL. Programmed death ligand-1 expression in non-small cell lung cancer. Lab Invest. 2014; 94:107–16. https://doi.org/10.1038/labinvest.2013.130.
25. Cooper WA, Tran T, Vilain RE, Madore J, Selinger CI, Kohonen-Corish M, Yip P, Yu B, O’Toole SA, McCaughan BC, Yearley JH, Horvath LG, Kao S, et al. PD-L1 expression is a favorable prognostic factor in early stage non-small cell carcinoma. Lung Cancer. 2015; 89:181–8. https://doi.org/10.1016/j.lungcan.2015.05.007.
26. Schalper KA, Velcheti V, Carvajal D, Wimberly H, Brown J, Pusztai L, Rimm DL. In situ tumor PD-L1 mRNA expression is associated with increased TILs and better outcome in breast carcinomas. Clin Cancer Res. 2014; 20:2773–82. https://doi.org/10.1158/1078-0432.ccr-13-2702.
27. Schatton T, Schutte U, Frank NY, Zhan Q, Hoerning A, Robles SC, Zhou J, Hodi FS, Spagnoli GC, Murphy GF, Frank MH. Modulation of T-cell activation by malignant melanoma initiating cells. Cancer Res. 2010; 70:697–708. https://doi.org/10.1158/0008-5472.can-09-1592.
28. Kleffel S, Posch C, Barthel SR, Mueller H, Schlapbach C, Guenova E, Elco CP, Lee N, Juneja VR, Zhan Q, Lian CG, Thomi R, Hoetzenecker W, et al. Melanoma Cell-Intrinsic PD-1 Receptor Functions Promote Tumor Growth. Cell. 2015; 162:1242–56. https://doi.org/10.1016/j.cell.2015.08.052.
29. Kollmann D, Ignatova D, Jedamzik J, Chang YT, Jomrich G, Paireder M, Kristo I, Kazakov D, Michal M, Cozzio A, Hoetzenecker W, Schatton T, Asari R, et al. Expression of Programmed Cell Death Protein 1 by Tumor-Infiltrating Lymphocytes and Tumor Cells is Associated with Advanced Tumor Stage in Patients with Esophageal Adenocarcinoma. Ann Surg Oncol. 2017; 24:2698–2706. https://doi.org/10.1245/s10434-017-5858-7.
30. McCaughan GJ, Fulham MJ, Mahar A, Soper J, Hong AM, Stalley PD, Tattersall MH, Bhadri VA. Programmed cell death-1 blockade in recurrent disseminated Ewing sarcoma. J Hematol Oncol. 2016; 9:48. https://doi.org/10.1186/s13045-016-0278-x.
31. Kim JR, Moon YJ, Kwon KS, Bae JS, Wagle S, Kim KM, Park HS, Lee H, Moon WS, Chung MJ, Kang MJ, Jang KY. Tumor infiltrating PD1-positive lymphocytes and the expression of PD-L1 predict poor prognosis of soft tissue sarcomas. PLoS One. 2013; 8:e82870. https://doi.org/10.1371/journal.pone.0082870.
32. Wang X, Teng F, Kong L, Yu J. PD-L1 expression in human cancers and its association with clinical outcomes. Onco Targets Ther. 2016; 9:5023–39. https://doi.org/10.2147/ott.s105862.
33. Nowicki TS, Akiyama R, Huang RR, Shintaku IP, Wang X, Tumeh PC, Singh A, Chmielowski B, Denny C, Federman N, Ribas A. Infiltration of CD8 T Cells and Expression of PD-1 and PD-L1 in Synovial Sarcoma. Cancer Immunol Res. 2017; 5:118–26. https://doi.org/10.1158/2326-6066.cir-16-0148.
34. Ngiow SF, Young A, Jacquelot N, Yamazaki T, Enot D, Zitvogel L, Smyth MJ. A Threshold Level of Intratumor CD8+ T-cell PD1 Expression Dictates Therapeutic Response to Anti-PD1. Cancer Res. 2015; 75:3800–11. https://doi.org/10.1158/0008-5472.can-15-1082.
35. Herbst RS, Soria JC, Kowanetz M, Fine GD, Hamid O, Gordon MS, Sosman JA, McDermott DF, Powderly JD, Gettinger SN, Kohrt HE, Horn L, Lawrence DP, et al. Predictive correlates of response to the anti-PD-L1 antibody MPDL3280A in cancer patients. Nature. 2014; 515:563–7. https://doi.org/10.1038/nature14011.
36. Johnson DB, Frampton GM, Rioth MJ, Yusko E, Xu Y, Guo X, Ennis RC, Fabrizio D, Chalmers ZR, Greenbowe J, Ali SM, Balasubramanian S, Sun JX, et al. Targeted Next Generation Sequencing Identifies Markers of Response to PD-1 Blockade. Cancer Immunol Res. 2016; 4:959–67. https://doi.org/10.1158/2326-6066.cir-16-0143.
37. Latchman Y, Wood CR, Chernova T, Chaudhary D, Borde M, Chernova I, Iwai Y, Long AJ, Brown JA, Nunes R, Greenfield EA, Bourque K, Boussiotis VA, et al. PD-L2 is a second ligand for PD-1 and inhibits T cell activation. Nat Immunol. 2001; 2:261–8. https://doi.org/10.1038/85330.
38. Zheng P, Zhou Z. Human Cancer Immunotherapy with PD-1/PD-L1 Blockade. Biomark Cancer. 2015; 7:15–8. https://doi.org/10.4137/bic.s29325.