
INTRODUCTION
Renal cell carcinoma (RCC) represents 2–3% of all human malignances and the most common histological subtype is clear-cell renal cell carcinoma (ccRCC) [1–2]. Many post-operative clinicopathological features are associated with overall survival of RCC patients and several predictive score models have been established to improve the risk stratification [3–5]. Metabolic syndrome (MS) is one of the pre-operative parameters that have been recently reported that predict survival outcomes of RCC patients. Two major features of MS, namely, visceral obesity and hypertension have been established as etiological factors of RCC [6–7]. However, contradictory results have been reported regarding association between visceral fat area (VFA) and the prognosis of RCC [8–13]. Recently, renal sinus fat accumulation (RSFA) or ectopic adipose tissue deposits have been associated with many MS features including hypertension [14–15]. However, the role of RSFA in RCC is unknown. Therefore, we studied the association between renal sinus fat area (RSFA) and the progression-free survival (PFS) of ccRCC. In addition, we constructed a nomogram to predict the PFS of non-metastatic ccRCC.
RESULTS
Baseline characteristics
We included 268 patients with pathologically confirmed ccRCC (126 located in the left kidney; 142 in the right) that underwent partial (n = 82) and radical (n = 186) nephrectomy in the present study. Patients with high RSFA values correlated with high SFA, VFA and BMI value and showed a high proportion of smaller tumor size, lower AJCC stage and lower fuhrman grade. Patients with low RSFA were more likely to have renal sinus invasion. We performed a one-to-one PSM analysis because the two study cohorts were not fully comparable. In the matched cohorts (n = 162; 81 pairs), the variables were fully comparable without statistical significance (Table 1). In addition, 43 patients were diagnosed as DM cases. The distribution of pre-operative HbA1c values (ranging from 5.8% to 10.5%) were as follows: 2 above 8%, 12 between 7–8%, 9 between 6.5–7% and 20 cases less than 6.5%. Further evaluation of the tumor grade was performed according to the WHO/ISUP grading system. There were 67, 128, 55 and 18 patients that were identified as grade 1, grade 2, grade 3 and grade 4, respectively. Patients with high RSFA values also correlated with lower WHO/ISUP grade than those with low RSFA values (p = 0.007). We identified 39, 71, 19 and 5 patients as grade 1, grade 2, grade 3 and grade 4, in the high RSFA group, respectively. We also identified 28, 57, 36 and 13 patients as grade 1, grade 2, grade 3 and grade 4 in the low RSFA group, respectively.
Table 1: Descriptive clinicopathologic characteristics of patients with non-metastatic renal cell carcinoma before (n = 268) and after (n = 162) propensity-score matching
Original unmatched cohorts (n = 268) |
Propensity-score matched cohorts (n = 162) |
|||||
|---|---|---|---|---|---|---|
Low RSFA, n (%) |
High RSFA, n (%) |
P |
Low RSFA, n (%) |
High RSFA, n (%) |
P |
|
Location side |
0.807 |
0.752 |
||||
left |
62 (46.3) |
64 (47.8) |
38 (46.9) |
36 (44.4) |
||
right |
72 (53.7) |
70 (52.2) |
43 (53.1) |
45 (55.6) |
||
Age (years) |
0.306 |
0.870 |
||||
less than 60 |
91 (67.9) |
83 (61.9) |
51 (63.0) |
52 (64.2) |
||
60 or greater |
43 (32.1) |
51 (38.1) |
30 (37.0) |
29 (35.8) |
||
Gender |
0.603 |
1.000 |
||||
male |
88 (65.7) |
92 (68.7) |
53 (65.4) |
53 (65.4) |
||
female |
46 (34.3) |
42 (31.3) |
28 (34.6) |
28 (34.6) |
||
SFA value |
0.003 |
0.752 |
||||
high |
55 (41.0) |
79 (59.0) |
44 (54.3) |
46 (56.8) |
||
low |
79 (59.0) |
55 (41.0) |
37 (45.7) |
35 (43.2) |
||
VFA value |
0.000 |
0.753 |
||||
high |
50 (37.3) |
84 (62.7) |
41 (50.6) |
39 (48.1) |
||
low |
84 (62.7) |
50 (37.3) |
40 (49.4) |
42 (51.9) |
||
Hypertension |
0.062 |
0.861 |
||||
absent |
101 (75.4) |
87 (64.9) |
58 (71.6) |
59 (72.8) |
||
present |
33 (34.6) |
47 (35.1) |
23 (28.4) |
22 (37.2) |
||
DM |
0.013 |
0.375 |
||||
absent |
120 (89.6) |
105 (78.4) |
68 (84.0) |
71 (87.7) |
||
present |
14 (10.4) |
29 (21.6) |
13 (16.0) |
9 (12.3) |
||
BMI |
0.011 |
0.870 |
||||
less than 25 |
104 (77.6) |
81 (60.4) |
52 (64.2) |
51 (63.0) |
||
25 or greater |
30 (22.4) |
53 (39.6) |
29 (35.8) |
30 (37.0) |
||
Tumor size (cm) |
0.018 |
0.311 |
||||
less than 5 |
68 (50.7) |
88 (65.7) |
51 (63.0) |
44 (54.3) |
||
5 or greater |
54 (40.3) |
42 (31.3) |
24 (29.6) |
33 (40.7) |
||
10 or greater |
12 (9.0) |
4 (3.0) |
6 (7.4) |
4 (35.0) |
||
Fuhrman grade |
0.010 |
0.369 |
||||
grade 1 |
28 (20.9) |
36 (26.9) |
19 (23.5) |
21 (25.9) |
||
grade 2 |
59 (44.0) |
75 (56.0) |
41 (50.6) |
43 (53.1) |
||
grade 3 |
41 (30.6) |
21 (15.7) |
21 (25.9) |
15 (18.5) |
||
grade 4 |
6 (4.5) |
2 (1.4) |
0 (0) |
2 (2.5) |
||
AJCC stage |
0.001 |
0.289 |
||||
stage I |
87 (64.9) |
113 (84.3) |
58 (71.6) |
64 (79.0) |
||
stage II |
24 (17.9) |
11 (8.2) |
15 (18.5) |
8 (9.9) |
||
stage III |
23 (17.2) |
10 (7.5) |
8 (9.9) |
9 (11.1) |
||
T stage |
0.002 |
0.506 |
||||
T1 |
88 (65.7) |
113 (84.3) |
58 (71.6) |
64 (79.0) |
||
T2 |
24 (17.9) |
13 (9.7) |
15 (18.5) |
10 (12.3) |
||
T3 |
22 (16.4) |
8 (6.0) |
8 (9.9) |
7 (8.7) |
||
LNM |
0.702 |
0.613 |
||||
absent |
130 (97.0) |
131 (97.8) |
80 (98.8) |
78 (96.3) |
||
present |
4 (3.0) |
3 (2.2) |
1 (1.2) |
3 (2.7) |
||
RSF invasion |
0.001 |
0.613 |
||||
absent |
121 (90.3) |
133 (99.3) |
78 (96.3) |
80 (98.8) |
||
present |
13 (9.7) |
1 (0.7) |
3 (2.7) |
1 (1.2) |
||
Histological necrosis |
1.000 |
0.588 |
||||
absent |
99 (73.9) |
99 (73.9) |
59 (72.8) |
62 (76.5) |
||
present |
35 (26.1) |
35 (26.1) |
22 (27.2) |
19 (23.5) |
||
Sarcomatoid differentiation |
0.055 |
0.316 |
||||
absent |
128 (95.5) |
133 (99.3) |
81 (100.0) |
80 (98.8) |
||
present |
6 (4.5) |
1 (0.7) |
0 (0) |
1 (1.2) |
||
SFA = subcutaneous fat area; VFA = visceral fat area; RSFA = renal sinus fat area; DM = diabetes mellitus; BMI = body mass index; AJCC = American Joint Committee on Cancer; LNM = lymph node metastasis.
Survival outcomes
The median follow-up of the 268 patients was 38 months with 48 patients (16 with AJCC stage I, 15 with stage II, and 17 with stage III) experiencing progression (distant metastasis or local recurrence) after surgery. Patients with high RSFA showed longer progression-free survival (PFS) than those with low RSFA (p < 0.001; Figure 1A). The 3-year PFS was 71.3% and 91.8% for patients with low and high RSFA. In the univariable Cox analysis, high SFA, VFA, and RSFA values, lower Fuhrman and WHO/ISUP grades, lower AJCC stage, smaller tumor size, absence of sarcomatoid component and renal sinus invasion were associated with higher PFS. However, multivariable analysis demonstrated that high RSFA, lower Fuhrman and WHO/ISUP grades, lower AJCC stage and absence of sarcomatoid component were associated with high PFS (Tables 2 and 3).
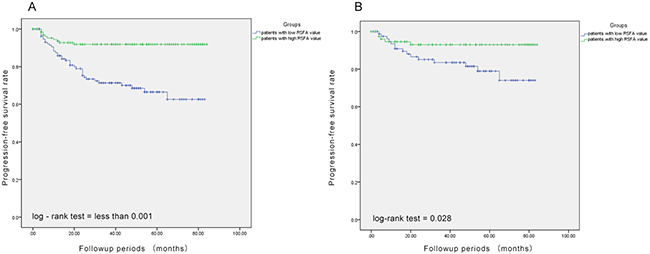
Figure 1: Association between renal sinus fat area and progression-free survival. (A) Patients with high renal sinus fat area (green line) show better progression-free survival than those with low renal sinus fat area (blue line). (B) Propensity-score matching analysis demonstrates that patients with high renal sinus fat area show better progression-free survival than those with low renal sinus fat area.
Table 2: Univariate and multivariate Cox regression analyses for prediction of progression-free survival in 268 non-metastatic cc-RCC patients treated with nephrectomy (Tumor grade was identified according to the Fuhrman grading system in the multivariable system)
Univariate analyses |
HR |
95% CI |
P value |
|---|---|---|---|
SFA (high) |
0.461 |
0.253–0.841 |
0.012 |
VFA (high) |
0.466 |
0.201–1.081 |
0.075 |
RSFA (high) |
0.240 |
0.119–0.482 |
<0.001 |
BMI (overweight/obese) |
0.728 |
0.385–1.377 |
0.328 |
Gender (male) |
1.186 |
0.637–2.211 |
0.590 |
Age (≥ 60 yr) |
0.758 |
0.406–1.412 |
0.382 |
Fuhrman grade |
< 0.001 |
||
grade 2 vs. grade 1 |
2.850 |
0.835–9.726 |
0.094 |
grade 3 vs. grade 1 |
8.935 |
2.642–30.211 |
< 0.001 |
grade 4 vs. grade 1 |
27.042 |
7.247–100.902 |
< 0.001 |
WHO/ISUP grade |
< 0.001 |
||
grade 2 vs. grade 1 |
4.533 |
1.042 – 19.717 |
0.044 |
grade 3 vs. grade 1 |
13.539 |
3.139 – 58.395 |
< 0.001 |
grade 4 vs. grade 1 |
43.611 |
9.686–196.368 |
< 0.001 |
Tumor size |
< 0.001 |
||
middle vs. small |
4.496 |
2.246–9.002 |
< 0.001 |
large vs. small |
10.014 |
4.017–24.961 |
< 0.001 |
Histological necrosis (present) |
1.303 |
0.707–2.399 |
0.396 |
AJCC stage |
< 0.001 |
||
stage 2 vs. stage 1 |
6.123 |
3.025–12.391 |
< 0.001 |
stage 3 vs. stage 1 |
9.160 |
4.613–18.186 |
< 0.001 |
T stage |
< 0.001 |
||
T2 vs. T1 |
5.928 |
2.993–11.742 |
< 0.001 |
T3 vs. T1 |
8.092 |
4.031–16.241 |
< 0.001 |
LNM (present) |
7.103 |
2.783–18.126 |
< 0.001 |
RSF invasion (present) |
5.924 |
2.749–12.768 |
< 0.001 |
Hypertension (present) |
1.001 |
0.543–1.843 |
0.999 |
Diabetes (present) |
1.074 |
0.502–2.295 |
0.854 |
Sarcomatoid differentiation (present) |
19.110 |
8.264–44.189 |
< 0.001 |
Tumor location (right) |
0.567 |
0.318–1.012 |
0.055 |
Multivariate analyses |
HR |
95% CI |
P |
|---|---|---|---|
SFA (high) |
0.818 |
0.412–1.625 |
0.566 |
VFA (high) |
0.569 |
0.287–1.127 |
0.106 |
RSFA (high)* |
0.432 |
0.206–0.907 |
0.027 |
RSF invasion (present) |
1.007 |
0.369–2.749 |
0.988 |
Fuhrman grade* |
0.007 |
||
grade 2 vs. grade 1 |
5.396 |
1.285–22.657 |
0.021 |
grade 3 vs. grade 1 |
7.015 |
1.588–30.987 |
0.010 |
grade 4 vs. grade 1 |
13.554 |
3.109–59.091 |
0.001 |
Tumor size |
0.688 |
||
middle vs. small |
1.433 |
0.578–3.551 |
0.437 |
large vs. small |
1.640 |
0.483–5.565 |
0.427 |
AJCC stage* |
0.042 |
||
stage 2 vs. stage 1 |
2.556 |
1.059–6.170 |
0.037 |
stage 3 vs. stage 1 |
3.502 |
1.224–10.018 |
0.019 |
Sarcomatoid differentiation (present)* |
9.830 |
2.588–37.343 |
0.001 |
Tumor location (right) |
0.852 |
0.445–1.633 |
0.630 |
cc-RCC = clear-cell renal cell carcinoma; SFA = subcutaneous fat area; VFA = visceral fat area; RSFA = renal sinus fat area; BMI = body mass index; AJCC = American Joint Committee on Cancer; LNM = lymph node metastasis. *= p less than 0.05 in multivariable analysis.
Table 3: Multivariate Cox regression analyses for prediction of progression-free survival in 268 non-metastatic cc-RCC patients treated with nephrectomy (Tumor grade was identified according to the WHO/ISUP grading system)
Multivariate analyses |
HR |
95% CI |
P |
|---|---|---|---|
SFA (high) |
0.862 |
0.436–1.706 |
0.670 |
VFA (high) |
0.569 |
0.286–1.131 |
0.108 |
RSFA (high)* |
0.465 |
0.221–0.975 |
0.043 |
RSF invasion (present) |
1.012 |
0.372–2.753 |
0.982 |
WHO/ISUP grade* |
0.009 |
||
grade 2 vs. grade 1 |
5.244 |
1.157–23.763 |
0.032 |
grade 3 vs. grade 1 |
6.494 |
1.358–31.054 |
0.019 |
grade 4 vs. grade 1 |
13.554 |
14.737–72.395 |
0.001 |
Tumor size |
0.689 |
||
middle vs. small |
1.442 |
0.592–3.509 |
0.420 |
large vs. small |
1.604 |
0.471–5.457 |
0.450 |
AJCC stage* |
0.031 |
||
stage 2 vs. stage 1 |
2.303 |
0.940–5.643 |
0.068 |
stage 3 vs. stage 1 |
3.987 |
1.411–11.266 |
0.009 |
Sarcomatoid differentiation (present)* |
5.235 |
1.539–17.802 |
0.008 |
Tumor location (right) |
0.925 |
0.481–1.779 |
0.816 |
cc-RCC = clear-cell renal cell carcinoma; SFA = subcutaneous fat area; VFA = visceral fat area; RSFA = renal sinus fat area; AJCC = American Joint Committee on Cancer. *= p less than 0.05 in multivariable analysis.
Further, our analysis demonstrated that larger RSFA, lower Fuhrman and WHO/ISUP grades, lower AJCC stage and the presence of sarcomatoid component were independent predictive factors of the PFS of non-metastatic ccRCC. Leibovich scoring system used Fuhrman grade as one of the predictors. Thus, we established a prognostic nomogram with factors such as Fuhrman grade, RSFA, AJCC stage and the presence of sarcomatoid component (Figure 2). The calibration curves demonstrated good consistency in bootstrap analysis between the calculated and actual 3-year PFS (Figure 3). The c-index values of Leibovich scoring system and our new nomogram were 0.762 (95%CI, 0.688–0.835) and 0.823 (95%CI, 0.759–0.888), respectively. In matched cohorts, 20 patients experienced tumor progression with the 3-year PFS values for patients with low and high RSFA being 83.5% and 93.0%, respectively. Further, survival analysis revealed that patients with larger RSFA value were associated with better PFS compared to patients with low RSFA (p = 0.028; Figure 1B).
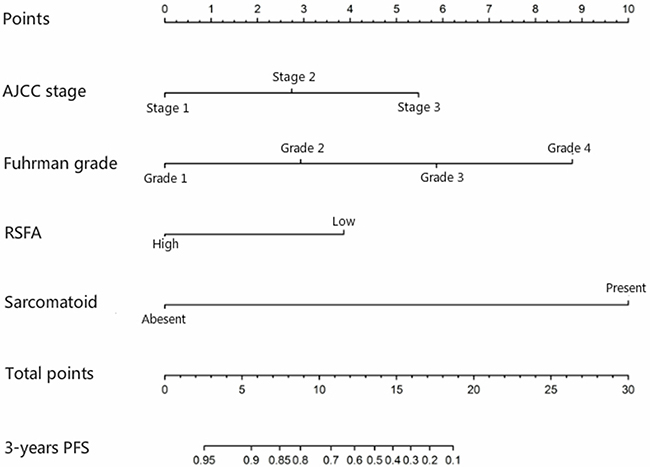
Figure 2: Nomogram for predicting 3-year progression-free survival of non-metastatic clear-cell renal cell carcinoma using renal sinus fat area (RSFA), AJCC stage, Fuhrman grade and sarcomatoid differentiation parameters.
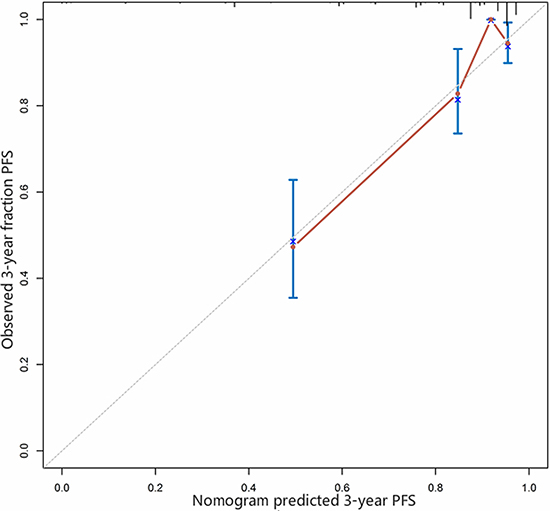
Figure 3: Calibration curve for predicted and observed 3-year progression-free survival.
DISCUSSION
Metabolic syndrome (MS) is primarily associated with development of cardiovarcular disease, hypertension and type 2 diabetes. Recently, its role in many cancers including RCC has been recognized. Among the many features of MS, obesity and hypertension have been identified as etiological factors worldwide [6–7]. Obesity is associated with the prevalence of a variety of cancers, including RCC (especially ccRCC). It is postulated that adipose tissue derived hormones in obesity regulate angiogenesis, epithelial-mesenchymal transition, and inflammation during tumor progression [16].
However, contradictory results have been reported regarding the association of visceral adipose tissue accumulation with RCC progression. Lee and colleagues reported that larger visceral fat area (greater than 50% in both sexes) was associated with longer survival of advanced RCC patients of Korean origin [11]. Likewise, Kaneko and colleagues reported similar findings in their study [10]. In contrast, Mano and colleagues recently reported that neither SFA nor VFA were associated with the survival of non-metastatic ccRCC in a western population [9]. Furthermore, Ladoire and colleagues suggested that high VFA was a predictive biomarker for lower survival in metastatic RCC patients that were given first-line anti-angiogenic drugs [12]. In our study, high SFA and VFA values showed better PFS compared to corresponding low values in the univariable analysis. However, they were not associated according to multivariable analysis. Therefore, the role of VFA and SFA in the development and progression of ccRCC remains unclear and further studies with larger cohorts are necessary.
Epidemiologic studies have demonstrated that hypertension is one of the strongest risk factors for RCC in western populations [17–18]. A recent investigation in Chinese population demonstrated that hypertension played a significant role in the etiology of RCC [19]. Also, patients with higher renal sinus fat accumulation (measured as area or volume) were associated with increased risk of hypertension [14–15]. Therefore, we assessed the association between RSFA values and the PFS of ccRCC by evaluating the CT scans. In our study, patients with high RSFA showed better PFS than those with low RSFA in both univariable and multivariable Cox analysis. Further, we used the PSM analysis to confirm our findings because it reduces bias due to confounding baseline factors [20]. PSM analysis also showed a strong relationship between high RSFA and better RCC survival. In addition, the nomogram including RSFA, AJCC stage, Fuhrman grade, sarcomatoid differentiation parameters demonstrated a more accurate prognosis for PFS than the Leibovich scoring system, which is the most commonly used predictive model to determine PFS of ccRCC.
The major branches of the renal artery and vein along with the major and minor calices of the collecting system, ureters and lymph vessels are located within the renal sinus. Therefore, we hypothesized that excess fat tissue deposits in the renal sinus may act as a physical barrier and prevent tumor cells from migrating to distant organs through veins and lymph vessels. Moreover, Zi and colleagues demonstrated that among perineoplasm, renal sinus, and adipose tissue conditioned media, only perineoplasm conditioned medium enhanced the migration of ccRCC cells (CaKi-2 cells) due to enhanced WNT signaling [21]. Therefore, we hypothesized that the association of RSFA with PFS of ccRCC might be due to physical factors and not due to biological factors. Among the 14 patients that showed pathological renal sinus invasion, 13 belonged to the low RSFA group, while the remaining 1 belonged to the high RSFA group. Since we had only 1 patient with high RSFA and renal sinus invasion, we were unable to evaluate the differences in PFS between high and low RSFA patients with renal sinus invasion. Therefore, future studies are necessary to evaluate if high renal sinus fat accumulation acts as a physical barrier and prevents distal metastasis. It is also worth noting that patients with aggressive tumors experienced considerable weight loss. However, it’s unclear if weight loss was a consequence of cachexia. Therefore, further studies are necessary to elucidate the mechanisms mediating renal sinus fat accumulation and its association with RCC prognosis.
CT scans are routinely used for standard evaluation for RCC patients. Therefore images for assessment of RSFA are readily available. Therefore, the status of pre-operative RSFA can be easily evaluated and used in the clinic. However, standard cut-off values to distinguish high and low RSFA have not yet been determined. In addition, reference values of RSFA based on ethnicity are also not available. Likewise, reference value limits for VFA to predict RCC prognosis are not available. In previous studies on association between VFA and RCC prognosis, patients were divided into obese and non-obese groups based on the median value. Further, since adipose tissue distribution is different between males and females, use of sex-specific median value was recommended [11]. In our study, we sub-divided the patient cohorts based on sex-specific median values. Also, we took the side of the kidney into consideration in regard to RSFA, tumor location and their association with PFS of ccRCC patients. However, we were limited by the lack of standard normal reference value of RSFA in regard to gender and race. Mano and colleagues reported the median values of sex-adjusted VFA as 218.62 cm2 and 156.49 cm2 for male and female, respectively in a western population with non-metastatic ccRCC [9]. However, the median values of VFA in our study were 123.11 cm2 and 80.92 cm2 for males and females, respectively. Lee and colleagues reported sex-specific median values of VFA as 117.07 cm2 and 79.28 cm2 for male and females, respectively, which were similar to our reported values [11] Foster and colleagues evaluated the RSFA of 92 participants with 49% women (100% right kidney) and reported a median RSFA value of 0.43 cm2 [15]. However, we reported larger RSFA values (1.28 cm2 for males and 0.59 cm2 for females) than those reported by Foster and colleagues (0.43 cm2).
The limitations of our investigation include the inherent bias due to the retrospective nature of our study, relative small sample size, and short follow-up periods. Because of a relatively shorter follow-up period and a small number of deaths in that period, we were unable to evaluate the association between RSFA and overall survival and cancer-specific survival. Furthermore, we only evaluated non-metastatic ccRCC. Therefore, predictive value of RSFA in other histological types of RCC or metastatic RCC is unknown. Also, the lack of clear-cut mechanistic details and standard RSFA cut-off values limit the utility of RSFA in clinical practice.
In conclusion, our study demonstrates that high RSFA is associated with increased progression-free survival of ccRCC in Chinese patients.
MATERIALS AND METHODS
Patient enrollment
We retrospectively enrolled 268 patients that underwent nephrectomy at our center between December 2009 and December 2015 and were post-operatively diagnosed as non-metastatic ccRCC. This study was approved by the institutional ethics committee of The First Affiliated Hospital of Xiamen University. A waiver of written informed consent was granted by the ethics committee for this retrospective analysis. Patient records/information was treated anonymously for this analysis.
Patients were excluded from the analyses if (1) they were operated in our center but had received CT scans in other hospitals before operation and therefore digital CT images were not available for analysis; (2) they did not undergo operation (partial or radical nephrectomy) as the main treatment; and (3) they had surgery elsewhere. All surgical procedures were performed by the director (JCX) of our center.
Clinicopathological parameters
We assessed clinicopathological factors such as gender, age at the diagnosis (> 60 y vs. < 60 y), body mass index (BMI, ≥ 25 kg/m2 vs. < 25 kg/m2), kidney side where tumors were located (right vs. left), nephrectomy type (partial vs. radical), VFA and subcutaneous fat area (SFA) at the level of the umbilicus, RSFA, pathological stage based on the 2010 American Joint Committee on Cancer (AJCC), tumor size (< 5 cm, 5–10 cm vs. > 10 cm), Fuhrman grading (grades 1–4), sarcomatoid component, pathological renal sinus invasion, hypertension and diabetes mellitus (DM). As the WHO/ISUP grading system has recently been proposed to replace the Fuhrman grading system, we further identified the grade of our cohort according to the International Society of Urological Pathology (WHO/ISUP) grading system.
Hypertension was defined as systolic blood pressure ≥ 140 mm Hg, diastolic blood pressure ≥ 90 mm Hg. Diabetes was defined as a fasting plasma glucose ≥ 126 mg/dL, 2-hour plasma glucose value ≥2 00 mg/dL after 75 g oral glucose tolerance test (OGTT). The pre-operative HbA1c data was also collected from DM patients. The tumor size of patients was classified based on SSIGN [3] and Leibovich [4] scores, namely, < 5 cm, 5–10 cm or > 10 cm. Progression-free survival was defined as the time from nephrectomy to distant metastasis or local recurrence.
Measurements of SFA, VFA and RSFA
Routine CT scans quantified the area of adipose tissue, including SFA, VFA and RSFA [8–15]. Abdominal CT scans (Somaris/7 CT 2012B, Siemens AG, Germany) were performed for all the enrolled patients before surgery. The contours of the abdominal muscular wall separating the visceral from the subcutaneous compartment at the level of umbilicus was manually outlined (Figure 4A–4B). Then, using an image display window width of –195 to –45 Hounsfield units, pixels containing fat were identified. The VFA and SFA values were then calculated with Syngo multimodality workplace, version VE31A (Siemens AG, Germany). Figure 5 shows the quantification of RSFA on the side of the lesion as described previously [15].
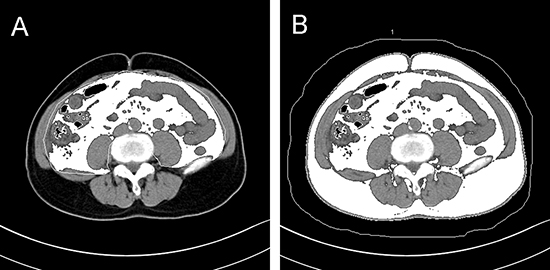
Figure 4: Representative axial CT images at the level of umbilicus showing (A) visceral fat area and (B) subcutaneous fat area plus visceral fat area.
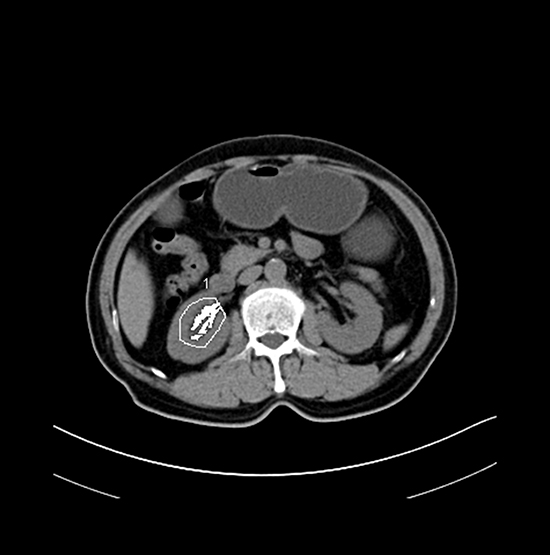
Figure 5: Representative axial CT image showing renal sinus fat area.
Measurements of the adipose tissue area were performed by one radiologist blinded to the clinical and pathological data. The sex-specific median value (123.11 cm2 for male; 80.92 for female) was used as the cut-off to distinguish patients with high and low VFA values [11]. Likewise, sex-specific median values of SFA (128.05 cm2 for male; 184.81 for female) were used to determine patients with high and low VFA. Since RSFA is potentially associated with gender and kidney side, the median sex- and side-specific median values (males: 1.28 cm2 and 0.91 cm2 for right and left kidneys; females: 0.59 cm2 and 0.46 cm2 for right and left kidneys) were used to distinguish high and low renal sinus fat accumulation.
Statistical analysis
SPSS 22.0 (version 13; SPSS Inc., IL, USA) was used for all statistical analyses. We performed one to one propensity-score matched (PSM) analysis to reduce the effect of confounding factors and bias caused by different baseline distribution of demographic and clinicopathologic factors between patients with high or low RSFA.
Numerical variables were compared with t-test and categorical variables with chi-square test. Survival curves were plotted by the Kaplan-Meier method and assessed by the Log-rank test. Subsequently, Cox regression analysis was performed to identify potential prognostic factors for survival. Characteristics with p < 0.1 were further evaluated by multivariable Cox regression model. Then, the survival curves were used to analyze the differences between high and low RSFA groups in the PSM matched cohorts when all variables were comparable in the two groups. Previously, radical and partial nephrectomies showed similar survival outcomes for localized ccRCC [1]. Therefore, patients that underwent partial nephrectomy in this study were all identified as localized cases (81 as T1 stage, 1 as T2 stage) and the nephrectomy types were not enrolled for Cox and propensity-score matching analyses. We used both Fuhrman and WHO/ISUP grading systems to evaluate the grade of our cohort. Both grading systems were analyzed by univariable and multivariable Cox regression model.
All the independent predictive factors were organized into a prognostic nomogram. The nomogram construction and calibration was performed with the R software 3.3.3. The Harrell’s concordance index (c-index) was determined for the Leibovich score system and the new nomogram to assess prognostic accuracy. A p < 0.05 was considered statistically significant.
Abbreviations
RCC = renal cell carcinoma; ccRCC = clear-cell renal cell carcinoma; MS = metabolic syndrome; VFA = visceral fat area; SFA = subcutaneous fat area; RSFA = renal sinus fat area; BMI = body mass index; PSM = propensity-score matched; PFS = progression-free survival; ISUP = International Society of Urological Pathology.
Authors’ contributions
Haichao Huang collected the data, performed the statistical analysis and wrote the article. Shi Chen analyzed the CT images and evaluated VFA, SFA and RSFA values. Jinchun Xing and Xiurong Wu designed the study and reviewed the article. Wei Yu reviewed the article. Zirong Ye reviewed the statistical analysis and established the nomogram and calibration curve in the revised paper. Wei Li contributed the figures and tables. All authors approved the final manuscript.
CONFLICTS OF INTEREST
All the authors declare that there are no conflicts of interest.
FUNDING
None.
REFERENCES
1. Ljungberg B, Bensalah K, Canfield S, Dabestani S, Hofmann F, Hora M, Kuczyk MA, Lam T, Marconi L, Merseburger AS, Mulders P, Powles T, Staehler M. EAU guidelines on renal cell carcinoma: 2014 update. Eur Urol. 2015; 67:913–24.
2. Keegan KA, Schupp CW, Chamie K, Hellenthal NJ, Evans CP, Koppie TM. Histopathology of surgically treated renal cell carcinoma: survival differences by subtype and stage. J Urol. 2012; 188:391–7.
3. Frank I, Blute ML, Cheville JC, Lohse CM, Weaver AL, Zincke H. An outcome prediction model for patients with clear cell renal cell carcinoma treated with radical nephrectomy based on tumor stage, size, grade and necrosis: the SSIGN score. J Urol. 2002; 168:2395–2400.
4. Leibovich BC, Blute ML, Cheville JC, Lohse CM, Frank I, Kwon ED, Weaver AL, Parker AS, Zincke H. Prediction of progression after radical nephrectomy for patients with clear cell renal cell carcinoma: a stratification tool for prospective clinical trials. Cancer. 2003; 97:1663–71.
5. Zisman A, Pantuck AJ, Wieder J, Chao DH, Dorey F, Said JW, DeKernion JB, Figlin RA, Belldegrun AS. Risk group assessment and clinical outcome algorithm to predict the natural history of patients with surgically resected renal cell carcinoma. J Clin Oncol. 2002; 20:4559–66.
6. Guiming Z, Yao Z, Dingwei Y. Metabolic syndrome and renal cell carcinoma. World Journal of Surgical Oncology. 2014; 12:236.
7. Ozbek E, Otunctemur A, Sahin S, Dursun M, Besiroglu H, Koklu I, Polat EC, Erkoc M, Danis E, Bozkurt M. Renal cell carcinoma is more aggressive in Turkish patients with the metabolic syndrome. Asian Pac J Cancer Prev. 2013;14:7351–4.
8. Steffens S, Grünwald V, Ringe KI, Seidel C, Eggers H, Schrader M, Wacker F, Kuczyk MA, Schrader AJ. Does obesity influence the prognosis of the renal cell carcinoma in patients treated with vascular endothelial growth factor-targeted therapy? Oncologist. 2011; 16: 1565–71.
9. Mano R, Hakimi AA, Zabor EC, Bury MA, Donati OF, Karlo CA, Bazzi WM, Furberg H, Russo P. Association between visceral and subcutaneous adiposity and clinicopathological outcomes in non-metastatic clear cell renal cell carcinoma. Can Urol Assoc J. 2014; 8:E675–80.
10. Kaneko G, Miyajima A, Yuge K, Yazawa S, Mizuno R, Kikuchi E, Jinzaki M, Oya M. Visceral obesity is associated with better recurrence-free survival after curative surgery for Japanese patients with localized clear cell renal cell carcinoma. Jpn J Clin Oncol. 2015; 45:210–6.
11. Lee HW, Jeong BC, Seo SI, Jeon SS, Lee HM, Choi HY, Jeon HG. Prognostic significance of visceral obesity in patients with advanced renal cell carcinoma undergoing nephrectomy. Int J Urol. 2015; 22:455–61.
12. Ladoire S, Bonnetain F, Gauthier M, Zanetta S, Petit JM, Guiu S, Kermarrec I, Mourey E, Michel F, Krause D, Hillon P, Cormier L, Ghiringhelli F, Guiu B. Visceral fat area as a new independent predictive factor of survival in patients with metastatic renal cell carcinoma treated with antiangiogenic agents. Oncologist. 2011; 16:71–81.
13. Naya Y, Zenbutsu S, Araki K, Nakamura K, Kobayashi M, Kamijima S, Imamoto T, Nihei N, Suzuki H, Ichikawa T, Igarashi T. Influence of visceral obesity on oncologic outcome in patients with renal cell carcinoma. Urol Int. 2010; 85:30–6.
14. Chughtai HL, Morgan TM, Rocco M, Stacey B, Brinkley TE, Ding J, Nicklas B, Hamilton C, Hundley WG. Renal sinus fat and poor blood pressure control in middle-aged and elderly individuals at risk for cardiovascular events. Hypertension. 2010; 56:901–6.
15. Foster MC, Hwang SJ, Porter SA, Massaro JM, Hoffmann U, Fox CS. Fatty kidney, hypertension, and chronic kidney disease: the Framingham Heart Study. Hypertension. 2011; 58:784–90.
16. Gati A, Kouidhi S, Marrakchi R, El Gaaied A, Kourda N, Derouiche A, Chebil M, Caignard A, Perier A. Obesity and renal cancer: Role of adipokines in the tumor-immune system conflict. Oncoimmunology. 2014; 3:e27810.
17. Lipworth L, Tarone RE, McLaughlin JK. Renal cell cancer among African Americans: an epidemiologic review. BMC Cancer. 2011; 11:133.
18. McLaughlin JK, Lipworth L, Tarone RE. Epidemiologic aspects of renal cell carcinoma. Semin Oncol. 2006; 33:527–33.
19. Shen T, Shu XO, Xiang YB, Li HL, Cai H, Gao YT, Lipworth L. Association of Hypertension and Obesity with Renal Cell Carcinoma Risk: A Report from the Shanghai Men’s and Women’s Health Studies. Cancer Causes Control. 2015; 26:1173–80.
20. Rosenbaum, PR. Rubin, DB. The central role of the propensity score in observational studies for causal effects. Biometrika. 1983; 70:41–55.
21. Zi X, Lusch A, Blair CA, Okhunov Z, Yokoyama NN, Liu S, Baker M, Huynh V, Landman J. Effect of perineoplasm perinephric adipose tissues on migration of clear cell renal cell carcinoma cells: a potential role of WNT signaling. Oncotarget. 2016; 7:53277–88. https://doi.org/10.18632/oncotarget.10467.