
INTRODUCTION
Among the gynecological cancers, ovarian cancer is the leading cause of death globally [1, 2]. An estimated 75% of patients with ovarian carcinoma present with advanced disease [3]. Despite aggressive treatment with cytoreductive surgery and chemotherapy regimens, recurrence with intraperitoneal metastasis and chemoresistance are common. The overall cure rate of ovarian cancer patients is approximately 30% [4]. Tumor stage, residual tumor after surgery, histology, grade, and age are important prognostic factors for ovarian cancer [5]. However, ovarian cancer has complex biology and patients have diverse outcomes, even with the same risk factors and the same treatment. Currently, surgical stages, histological grades, and optimal debulking remain the major prognostic factors, which are also the main factors considered in the current treatment guidelines [6]. However, with increasing understanding of the molecular heterogeneity of ovarian cancers, a better prognostic biomarker for patient stratification and personalized treatment is needed. New prognostic biomarkers of ovarian cancer are needed.
Ovarian cancer cells detach from the primary tumor, and then disseminate in the peritoneal cavity and attach to the omentum and peritoneum as the initial steps of metastasis. Cell adhesion molecules (CAMs) are involved in all phases of cancer progression [7]. CAMs are classically categorized into four groups: the cadherins, the integrins, the selectins, and the immunoglobulin-like CAMs (Ig-CAMs) [8]. Different kinds of CAMs are essential for cancer cells to maintain their survival and to alter their local microenvironment so that it is more feasible to sustain and promote tumor development [8, 9]. CAMs are key players in the progression of ovarian cancer [10]. Reduced E-cadherin and β-catenin phenotypes are associated with advanced stage tumors, serous carcinomas, peritoneal metastasis, and larger residual tumor in ovarian cancer patients [11]. Loss of E-cadherin expression is associated with an unfavorable outcome [12, 13]. Loss of β3 integrin expression is a poor prognostic marker in ovarian cancer [14]. However, single integrins such as αvβ3 or α5β1 inhibitors fail to gain significant benefits in metastatic ovarian cancer [15, 16]. Epithelial cell adhesion molecule (EpCAM) is a member of the Ig-CAMs. The expression of EpCAM on the surface of normal ovarian epithelium is very low but is increased in ovarian cancer with different histology [17]. The prognosis as a result of expression of EpCAM in ovarian cancer is not clear [17, 18]. Anti-EpCAM monoclonal antibody (Catumaxomab) is useful for management of ovarian cancer with recurrent malignant ascites and can improve the quality of life (puncture-free time, time to next puncture) [19]. Although CAMs are critical in the progression of ovarian cancer, currently available treatments directed at these molecules do not improve clinical outcome. The reasons for the poor response to CAM-related therapies remain unknown.
In addition to genetics, epigenetics is also a driving force in cancer. Hypermethylation of tumor suppressor promoters and global hypomethylation are common during cancer development and progression [20]. DNA methylation markers are clinically useful for diagnostics, prognostics, and prediction of treatment response in cancer [21]. For instance, O6-methylguanine DNA methyltransferase (MGMT) methylation is a useful predictor of the responsiveness of tumors to alkylating agents, and survival of patients with glioma [22]. But there is no such methylation biomarker in ovarian cancer. Epigenetic alterations at specific CpG sites are associated with progression-free survival (PFS) and overall survival (OS) in patients with ovarian cancer [23–27]. Methylation of CAM may be correlated with risk and prognosis of ovarian cancer. High methylation of cadherin 1 promoters is a potential biomarker for prediction of ovarian cancer risk [28]. High methylation of intercellular adhesion molecule-1 and opioid binding protein/cell adhesion molecule-like gene promoter is associated with poor OS in patients with ovarian cancer [29, 30]. There is a need for a more comprehensive CAM methylomics study to stratify ovarian cancer patients for novel therapies.
Most previous studies have used a candidate-gene approach, and the selection of these genes is based on limited knowledge of the cancer biology. Moreover, genes with a similar function were not simultaneously included in analyses, and this may bias results. The present study integrates methylomics and genomics to explore the adhesion methylomics associated with survival in ovarian cancer.
RESULTS
Identification of adhesion-related genes with high methylation and low expression in ovarian cancer
Genes annotated as coding for adhesion in methylation profiles including 524 genes (914 probes) were selected. To narrow down the potential genes, we integrated the gene expression data, which include the normal ovarian and ovarian cancer samples. Genes with lower mRNA expression in cancer than in normal tissues were selected for survival analysis. There were 106 genes (183 probes) fulfilling these criteria. The selection flowchart is shown in Figure 1.
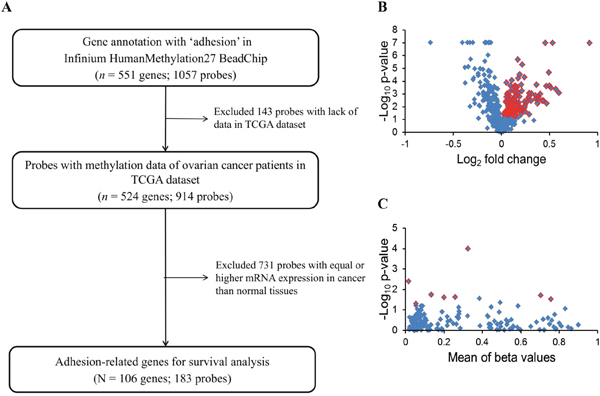
Figure 1: Flowchart of the present study. (A) Adhesion-related genes from the Infinium HumanMethylation27 array were selected to integrate the GeneChip HT Human Genome U133 array data to select candidate genes with an mRNA expression significantly lower in malignant than in normal samples (p < 0.05) for survival analysis. (B) Selection of genes differentially expressed in normal and malignant samples from an expression microarray. Blue dots indicate 428 adhesion-related genes. The expression of 106 genes shown as red dots was significantly different between normal and malignant tissues (p < 0.05 by t-test). (C) There was a significant association of eight genes in TCGA ovarian cancer patients with PFS by a log-rank test (red dots) of 183 probes (blue dots).
Association between adhesion methylomics and prognosis
To evaluate their clinical relevance, we analyzed the prognostic significance of methylation status of 106 genes using a dataset from The Cancer Genomic Atlas (TCGA). The patient clinicopathological features are presented in Table 1. Most of the ovarian cancer patients at diagnosis were at stage III/IV and high grade. The β-value distribution of candidate genes is presented in Table 2. By Kaplan–Meier analysis, patients with highly methylated CD97, CTNNA1, DLC1, HAPLN2 and low methylation of LAMA4, LPP, MFAP4, VTN showed a significantly worse prognosis (Figure 2). In multivariate Cox regression analysis, FIGO stage was significantly correlated with PFS (Table 3). After adjusting for the stage, four highly methylated genes (CD97, CTNNA1, DLC1, HAPLN2) and three genes (LAMA4, LPP, MFAP4) with low methylation were found significantly associated with poor PFS (Table 3). In the Kaplan–Meier analysis for OS, only low methylation of VTN was significant for poor OS (Figure 3). Low methylation of VTN was an independent prognostic factor for OS after adjusting for age and stage (Table 4).
Table 1: Characteristics and clinicopathological features of TCGA ovarian cancer dataset
Characteristics |
|
Median |
Range |
|---|---|---|---|
Age, years (n = 391) |
|
59.6 |
30.5–87.5 |
|
|
No. of patients |
(%)a |
FIGO stage |
II |
22 |
(5.6) |
|
III |
307 |
(78.5) |
|
IV |
62 |
(15.9) |
Grade |
G2 |
57 |
(14.6) |
|
G3 |
334 |
(85.4) |
Platinum responsea |
Sensitive |
193 |
(68.4) |
|
Resistant |
89 |
(31.6) |
FIGO: International Federation of Gynecology and Obstetrics. aPercentages for platinum response were based on 282 tumor samples.
Table 2: The methylation level of adhesion-related candidate genes in TCGA ovarian cancer dataset
Gene name |
β-Value |
|
|---|---|---|
Median |
Range |
|
CD97 (n = 391) |
0.05 |
(0.02–0.18) |
CTNNA1 (n = 391) |
0.01 |
(0.001–0.09) |
DLC1 (n = 382) |
0.25 |
(0.03–0.88) |
HAPLN2 (n = 391) |
0.11 |
(0.04–0.82) |
LAMA4 (n = 391) |
0.18 |
(0.04–0.63) |
LPP (n = 383) |
0.78 |
(0.23–0.95) |
MFAP4 (n = 390) |
0.39 |
(0.05–0.78) |
VTN (n = 391) |
0.74 |
(0.15–0.89) |
Table 3: Univariate and multivariate Cox regression analysis of PFS of TCGA patients with high-grade serous ovarian cancer
Variable |
Crude HR |
p |
Adjusted HR |
p |
|---|---|---|---|---|
Age (years) |
1.00 (0.99, 1.01) |
0.75 |
- |
- |
FIGO stage (stage III, IV vs II) |
2.04 (1.14, 3.64) |
0.02* |
1.87 (1.04, 3.34)b |
0.04* |
Grade (G3 vs G2) |
1.29 (0.91, 1.82) |
0.15 |
- |
- |
Methylation status (low vs high)a |
|
|
|
|
CD97 |
0.74 (0.58, 0.95) |
0.02* |
0.76 (0.59, 0.98) |
0.03* |
CTNNA1 |
0.68 (0.52, 0.89) |
0.005* |
0.71 (0.54, 0.92) |
0.01* |
DLC1 |
0.66 (0.51, 0.85) |
0.001* |
0.69 (0.53, 0.88) |
0.003* |
HAPLN2 |
0.71 (0.54, 0.93) |
0.01* |
0.71 (0.55, 0.94) |
0.01* |
LAMA4 |
1.31 (1.01, 1.69) |
0.04* |
1.32 (1.02, 1.70) |
0.04* |
LPP |
1.32 (1.03, 1.69) |
0.03* |
1.30 (1.01, 1.66) |
0.04* |
MFAP4 |
1.36 (1.06, 1.74) |
0.02* |
1.34 (1.05, 1.72) |
0.02* |
VTN |
1.29 (1.01, 1.66) |
0.05* |
1.24 (0.96, 1.60) |
0.09 |
HR: hazard ratio; CI: confidence interval. aThe HR adjusted by stage and gene methylation status. b The HR adjusted by DLC1 gene methylation status. * Significantly correlated with outcome, p < 0.05.
Table 4: Univariate and multivariate Cox regression analysis of OS in TCGA patients with ovarian cancer
|
Crude HR |
p |
Adjusted HR |
p |
|---|---|---|---|---|
Age |
1.02 (1.01, 1.04) |
< 0.001* |
1.02 (1.01, 1.04) |
<0.001 |
Grade |
1.47 (0.99, 2.19) |
0.06 |
1.38 (0.92, 2.06) |
0.12 |
FIGO stage |
|
|
|
|
Stage III, IV vs II |
2.77 (1.23, 6.24) |
0.01* |
2.49 (1.10, 5.62) |
0.03* |
VTN methylation |
|
|
|
|
Low vs. High |
1.52 (1.17, 1.99) |
0.002* |
1.49 (1.15, 1.95) |
0.003* |
aThe HR adjusted by age, stage and methylation status. *p < 0.05.
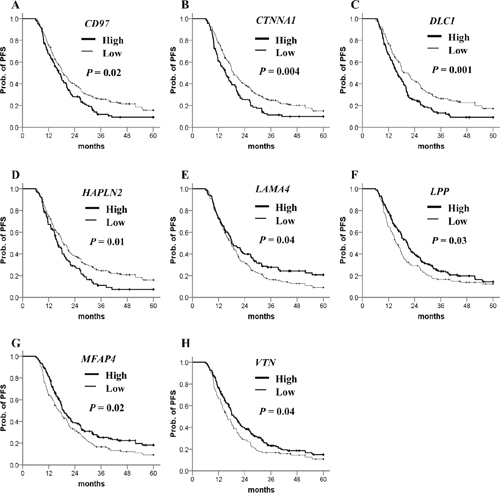
Figure 2: Kaplan–Meier plots for PFS analysis of candidate gene methylation in TCGA ovarian cancer dataset. (A–H) PFS stratified by the methylation status of each candidate gene. Straight line: low methylation; bold line: high methylation. P values were calculated using a log-rank test.
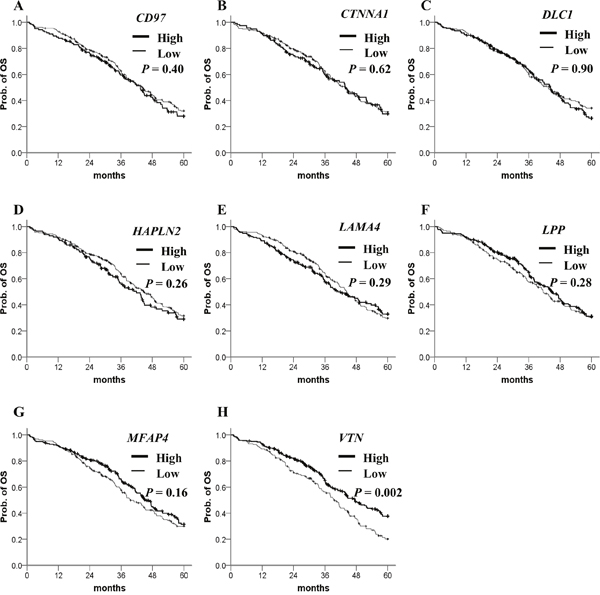
Figure 3: Kaplan–Meier plots for OS analysis of candidate gene methylation in TCGA ovarian cancer dataset. (A–H) OS stratified by the methylation status of each candidate gene. Straight line: low methylation; bold line: high methylation. P values were calculated using a Breslow test.
Prediction of PFS with adhesion methylomics signature in ovarian cancer
We used a stepwise Cox proportional hazards model to generate a combination of adhesion methylomics for better prognostic prediction, which resulted in a 3-gene signature (CTNNA1, DLC1, MFAP4). High methylation of CTNNA1 and DLC1 and low methylation of MFAP4 indicate high risk. Patients carrying three or any two of these genes had a greater risk of shorter PFS than those with none or only one risk-related gene in the Kaplan–Meier analysis (Figure 4A). Multivariate Cox regression analysis confirmed that possessing three or any two risk-related genes was an independent risk factor for PFS when compared with those possessing none or any one risk-related gene (Table 5). When we looked at the platinum response of ovarian cancer in TCGA dataset, patients carrying three or any two risk-related genes had a significantly poorer PFS in the platinum-sensitive group. This difference was not statistically significant in the platinum-resistant group. The drug response and adhesion molecule status warrants further investigations. (Supplementary Figure 1A-1C).
Table 5: Univariate and multivariate Cox regression analysis of PFS of patients in TCGA, TSGH, and AOCS groups with high-grade serous ovarian cancer
Variable |
Crude HR |
p |
Adjusted HRa |
p |
|---|---|---|---|---|
TCGA |
|
|
|
|
Age (years) |
0.99 (0.98, 1.01) |
0.75 |
- |
- |
FIGO stage (III, IV vs II) |
2.04 (1.14, 3.64) |
0.02* |
1.88 (1.05, 3.36) |
0.002* |
Grade (G3 vs G2) |
1.32 (0.93, 1.87) |
0.12 |
- |
- |
Methylation signature |
|
|
|
|
CTNNA1, DLC1, MFAP4 |
|
|
|
|
0–1 gene at risk |
1.00 (ref.) |
|
1.00 (ref.) |
|
Any 2–3 genes at risk |
1.64 (1.27, 2.11) |
<0.001* |
1.59 (1.23, 2.05) |
<0.001* |
TSGH |
|
|
|
|
Age (years) |
0.98 (0.94, 1.02) |
0.29 |
- |
- |
FIGO stage ( III, IV vs I, II) |
8.69 (1.98, 38.13) |
0.004* |
13.06 (2.64, 64.72) |
0.002* |
Grade (G3 vs G2) |
1.44 (0.57, 3.67) |
0.15 |
- |
- |
Methylation signature |
|
|
|
|
CTNNA1, DLC1, MFAP4 |
|
|
|
|
0–1 gene at risk |
1.00 (ref.) |
|
1.00 (ref.) |
|
Any 2–3 genes at risk |
4.90 (1.07, 22.49) |
0.04* |
16.64 (2.68, 103.14) |
0.003* |
AOCS |
|
|
|
|
Age (years) |
1.03 (0.99, 1.05) |
0.08 |
- |
- |
FIGO stage ( IV vs III) |
0.61 (0.34, 1.10) |
0.10 |
- |
- |
Grade (G3 vs G2) |
0.90 (0.46, 1.74) |
0.75 |
- |
- |
Methylation signature |
|
|
|
|
CTNNA1, DLC1, MFAP4 |
|
|
|
|
0–1 gene at risk |
1.00 (ref.) |
|
|
|
Any 2–3 genes at risk |
2.43 (1.11, 5.36) |
0.03* |
- |
- |
HR: hazard ratio; CI: confidence interval. aThe HR adjusted by stage and methylation signature. * Significantly correlated with outcome, p < 0.05.
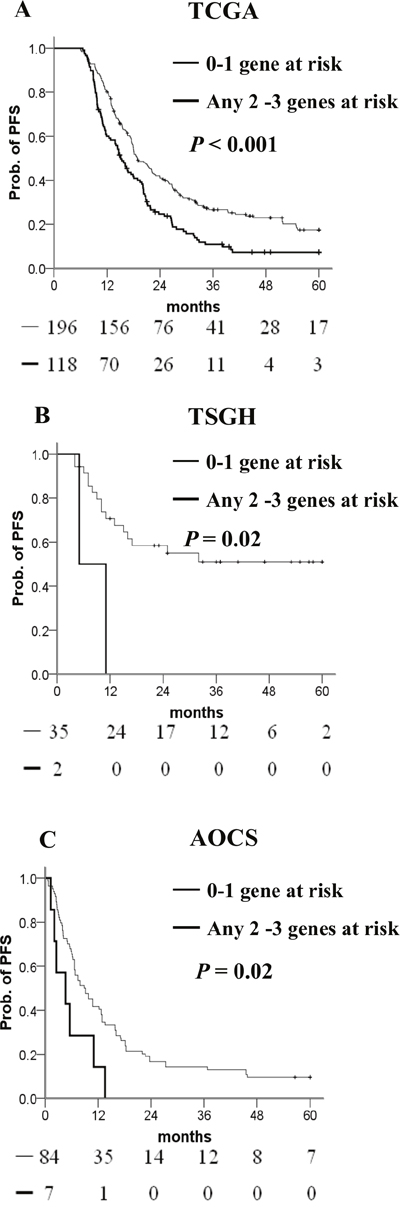
Figure 4: Kaplan–Meier curves of the risk groups. (A) TCGA, (B) TSGH, and (C) AOCS ovarian cancer patients with the probability of PFS predicted by the CTNNA1/DLC1/MFAP4 methylation signatures. PFS was stratified by the number of risk-related genes. Risk-related genes were defined as high methylation of CTNNA1 or DLC1, and low methylation of MFAP4. Straight line: 0–1 risk-related genes; bold line: any 2–3 risk-related genes. P values were calculated using a log-rank test.
The molecular background of ovarian cancer is heterogeneous. From the TCGA and AOCS datasets on high-grade serous ovarian cancers, four different molecular subtypes with distinct biology were identified [31, 32]. It is interesting to know whether this epigenetic adhesion signature is related to specific molecular subgroups. We examined the association between molecular subtypes and the epigenetic adhesion signature using the TCGA dataset. Indeed, there was a significant correlation between molecular subtypes and epigenetic adhesion signatures. Patients with three or any two risk-related genes were more common in the proliferative subtype (Table 6). In addition, the epigenetic adhesion signature was also correlated with PFS in immunoreactive, mesenchymal, and proliferative but not differentiated tumor subgroups (Figure 5A–5C).
Table 6: Correlation between epigenetic adhesion signatures and molecular subtypes in TCGA patients with high-grade serous ovarian cancer
Epigenetic Adhesion Signature |
|||
|---|---|---|---|
Subtypes by gene expression |
0-1 gene at risk |
2-3 gene at risk |
Chi-squared P value |
Differentiated |
66 (74%) |
23 (26%) |
<0.001* |
Immunoreactive |
53 (76%) |
17 (24%) |
|
Mesenchymal |
41 (60%) |
27 (40%) |
|
Proliferative |
36 (41%) |
51 (59%) |
|
*Significantly correlated with outcome, p < 0.05.
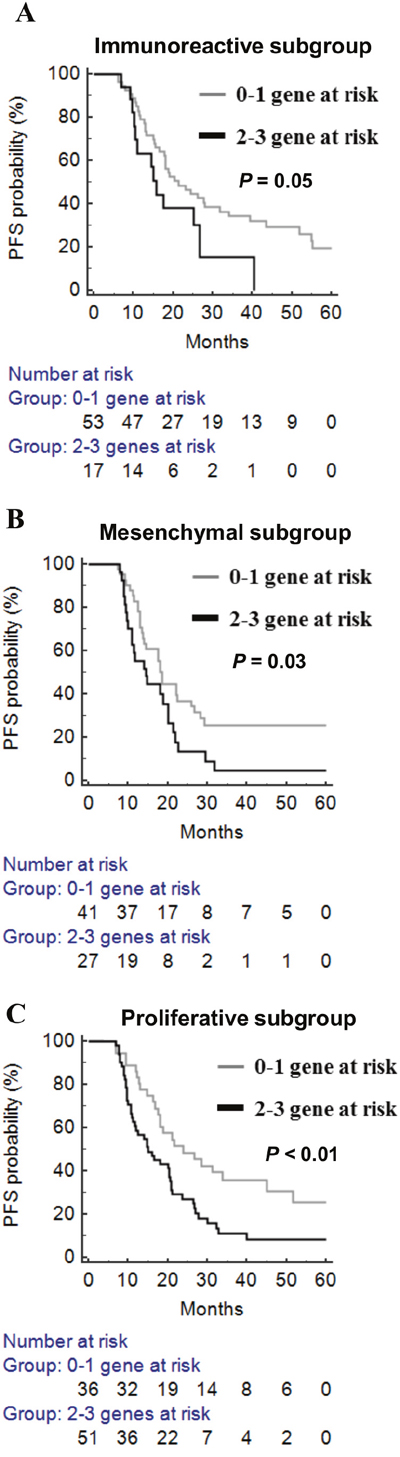
Figure 5: The prognostic significance of epigenetic adhesion signatures in different molecular subgroups in TCGA patients with high-grade serous ovarian cancer. (A) Immunoreactive subgroup. (B) Mesenchymal subgroup. (C) Proliferative subgroup. Gray line: 0–1 risk-related genes; black line: any 2–3 risk-related genes.
Independent validation of the adhesion methylomics signature
To validate the prognostic value of this signature, we generated 37 methylomics of ovarian cancer in our hospital. Patients carrying three or any two risk-related genes had a noticeably poorer PFS than those with none or any one risk-related gene (Figure 4B) in the Kaplan–Meier analysis. The signature was also validated in the AOCS dataset containing 91 patients with 450K methylomics. As expected, the 3-gene methylation signature showed a significant difference between 0–1 risk-related gene and any 2–3 risk-related genes (Figure 4C) in the AOCS dataset. The Cox proportional hazard model showed adjusted hazard ratio (HR)s for PFS of patients with 2–3 risk-related genes versus 0–1 risk-related genes in databases belonging to the TSGH and AOCS (Table 5).
Integration of DLC1 methylation and FAK expression as a prognostic factor
Focal adhesion kinase (FAK) regulates various intracellular signaling pathways and is associated with tumor progression [33]. In most ovarian cancers, FAK expression is aberrantly upregulated [34]. DLC1 has been reported to dephosphorylate FAK and inhibit the proliferation and migration of hepatocellular carcinoma cell lines [35]. Moreover, low expression of DLC1 with high expression of pFAK Y397 (phosphorylated FAK) was detected in advanced ovarian cancers [36]. Therefore, we were interested in the combined effects of these two genes in ovarian cancers. In the present study, patients with highly methylated DLC1 had shorter PFS than those with low methylation (Table 7). Patients could be stratified into two groups based on the combination of DLC1 methylation and FAK expression. DLC1 low methylation with FAK low expression indicates low risk. The high-risk group included any combination of DLC1 methylation with FAK expression other than the low-risk group. The low-risk patients had a better 36-month prognosis (Figure 6). The median PFS of patients with low-risk was 5.3 months longer than that for patients in the high-risk group. Multivariate Cox regression analyses indicated the high-risk group had 1.42-fold the recurrence of the low-risk group and had an independent factor for PFS (Table 7).
Table 7: Univariate and multivariate Cox regression analysis of 3-years PFS of TCGA patients with ovarian cancer
|
Crude HR |
p |
Adjusted HR |
p |
|---|---|---|---|---|
Age |
1.01 (0.99, 1.02) |
0.28 |
|
|
Grade |
1.45 (0.94, 2.23) |
0.10 |
|
|
FIGO stage |
|
|
|
|
Stage III, IV vs II |
2.84 (1.25, 6.41) |
0.01* |
2.55 (1.12, 5.80)b |
0.03* |
DLC1 methylation |
|
|
|
|
High vs low |
1.49 (1.10, 2.01) |
0.01* |
1.39 (1.02, 1.88)c |
0.04* |
FAK expression |
|
|
|
|
High vs. low |
1.15 (0.79, 1.69) |
0.46 |
- |
- |
DLC1m and FAKe |
|
|
|
|
High risk vs low riska |
1.51 (1.11, 2.05) |
0.008 |
1.42 (1.04, 1.92)c |
0.03* |
aLow risk means DLC1 low methylation and FAK low expression. The high-risk group included any combination of DLC1 methylation with FAK expression other than the low-risk group. bThe HR adjusted by DLC1m and FAKe signature. cThe HRs adjusted by stage. *p < 0.05.
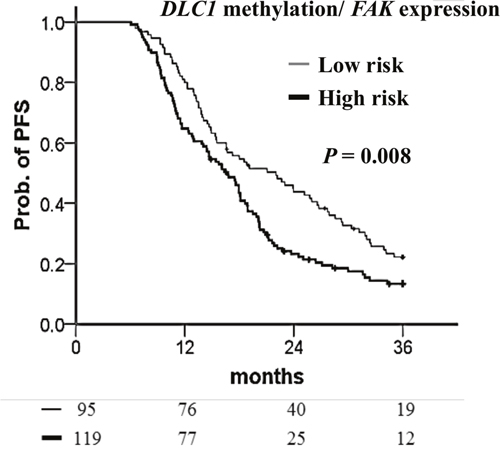
Figure 6: Kaplan–Meier curves of the risk groups for TCGA ovarian cancer patients with the probability of PFS predicted by combined DLC1 methylation and FAK expression signatures. PFS stratified by DLC1 methylation with FAK expression signatures. Low-risk means DLC1 low methylation with FAK low expression. The high-risk group included any combination of DLC1 methylation with FAK expression other than the low-risk group. Straight line: low-risk; bold line: high-risk. P values were calculated using a log-rank test.
In a Kaplan–Meier survival analysis of patients with suboptimal debulking, high DLC1 methylation, FAK expression, and a high-risk combination of these two significantly decrease PFS (Figure 7A–7C). A Cox proportional hazard model indicated that DLC1 methylation, FAK expression, and the high-risk combination had the notable HRs for PFS (Table 8).
Table 8: Univariate and multivariate Cox regression analysis of PFS in TCGA patients with suboptimal debulking ovarian cancer
|
Crude HR |
p |
Adjusted HR |
p |
|---|---|---|---|---|
Age |
1.01 (0.99, 1.02) |
0.24 |
- |
- |
Grade |
1.21 (0.82, 1.78) |
0.34 |
- |
- |
FIGO stage III, IV vs II |
1.17 (0.60, 2.29) |
0.64 |
- |
- |
DLC1 methylation |
|
|
|
|
High vs low |
1.40 (1.07, 1.83) |
0.01* |
- |
- |
FAK expression |
|
|
|
|
High vs low |
1.55 (1.05, 2.28) |
0.03* |
- |
- |
DLC1m and FAKe |
|
|
|
|
High risk vs low riska |
1.79 (1.29, 2.49) |
< 0.001* |
- |
- |
HR: hazard ratio; CI: confidence interval. aLow risk means DLC1 low methylation and FAK low expression. The high-risk group included any combination of DLC1 methylation with FAK expression other than the low-risk group. Low risk means DLC1 low methylation and FAK low expression. *p < 0.05.
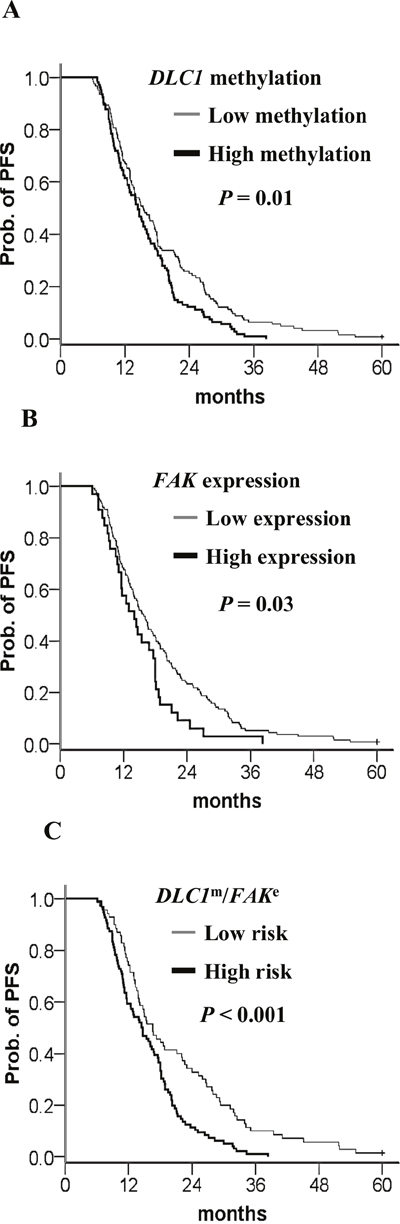
Figure 7: Kaplan–Meier curves of the risk groups in TCGA ovarian cancer patients with suboptimal debulking and the probability of PFS predicted by the DLC1 methylation status, FAK expression status, and combined signatures. PFS stratified by (A) DLC1 methylation status. Straight line: low methylation; bold line: high methylation. (B) FAK expression status. Straight line: low expression; bold line: high methylation. (C) DLC1 methylation and FAK expression signature. Straight line: low-risk; bold line: high-risk. Low risk means DLC1 low methylation and FAK low expression. The high-risk group included any combination of DLC1 methylation with FAK expression other than the low-risk group. P values were calculated using a log-rank test.
DISCUSSION
In the present study, we used a genome-wide approach through the integration of methylomics and genomics analyses to discover genes that are involved in the adhesion of ovarian cancer. Using this approach, we identified four highly methylated genes (CD97, CTNNA1, DLC1, HAPLN2) and three genes (LAMA4, LPP, MFAP4) with low methylation that were associated with poor PFS. Furthermore, our results focused on methylation status of CAMs and revealed a 3-gene (CTNNA1, DLC1, MFAP4) methylation signature with a prognostic significance that may provide a new biomarker for personalized treatment in ovarian cancer.
In this era of personalized medicine, we can stratify patients according to their pharmacogenomics and individual genetic differences that determine the response to chemotherapeutics [37]. Furthermore, we may provide mechanism-based and biomarker-driven therapeutics to improve treatment outcome. DNA hypomethylating agents can restore the expression of epigenetically silenced tumor suppressor genes and result in antitumor activity [38]. Decitabine restores the sensitivity toward carboplatin in patients with platinum-resistant ovarian cancer [39]. However, DNA hypomethylating agents lack specificity and may lead to undesirable effects such as re-expression of oncogenes [40]. Application of demethylation therapies in patients with ovarian cancer carrying a specific methylation signature requires clinical trials to confirm their efficacy. CAMs involved in the process of cancer progression have been identified. Monoclonal antibodies targeting CAMs such as integrin and EpCAM have been developed, but the results have been unsatisfactory. Combinations of therapies targeting different CAMs are likely to be more effective and should be explored for their future clinical application. Ovarian cancer patients with suboptimal debulking have an inferior response to adjuvant chemotherapy, PFS, OS, and they used to be regarded as a homogenous group. In the present study, we found high DLC1 methylation was an independent risk factor for poor PFS. Furthermore, FAK expression further increased the hazard ratio for PFS in patients with suboptimal debulking. Small molecule FAK inhibitors showed promising clinical activity to decrease tumor growth and metastasis in preclinical models. Clinical trials are ongoing [33]. FAK inhibitors may be used to improve outcomes in patients with suboptimal debulking who have high DLC1 methylation and high FAK expression.
In the 3-gene methylation signature, high methylation of CTNNA1 and DLC1 are associated with a poor prognosis. Downregulation or loss of human α-catenin gene (CTNNA1) expression is seen in many cancer cell lines and primary cancer tissues, and α-catenin is recognized as a putative tumor suppressor [41]. Reduced expression of α-catenin is proposed as an important step in ovarian tumorigenesis [42]. α-catenin is involved in the regulation of β-catenin in the Wnt/β-catenin pathway [41]. DLC1 is a tumor suppressor and its expression is lost or downregulated in multiple common cancers [43]. DLC1 is a Rho GTPase-activating protein (GAP) and mainly regulates Cdc42 [44]. Focal adhesion allows the cell to attach to the extracellular matrix (ECM) through the interaction of the integrins with their extracellular ligands, and intracellular assemblies of multiple proteins which link to the actin cytoskeleton [45]. DLC1 is involved in the process of focal adhesion and stress fiber formation [44]. Expression of DLC1 has a negative correlation with expression of pFAK Y397 in advanced ovarian cancer [36]. Integrin engagement with ECM can activate FAK through autophosphorylation at the Y397 site, which may, in turn, lead to paxillin phosphorylation and affect focal adhesion dynamics [46, 47]. DLC1 competes with paxillin to bind FAK and reduce paxillin phosphorylation [48]. DLC1 acts with FAK to downregulate paxillin turnover independent of its GAP activity [49]. Moreover, DLC1 interacts with α-catenin to stabilize adherens junction and suppress RhoA, RhoC GTPase activities to induce E-cadherin expression through the Rho GAP function [50, 51]. In our proposed model, high methylation of DLC1 could lead to loss of CDC42, Rho GTPase regulation, and loss of FAK and paxillin phosphorylation inhibition while the integrin receptor is activated. Additional high methylation of CTNNA1 may lead to instability of the adherens junction, which may increase cytosol levels of β-catenin and increase the chance of nuclear translocation (Figure 8B).
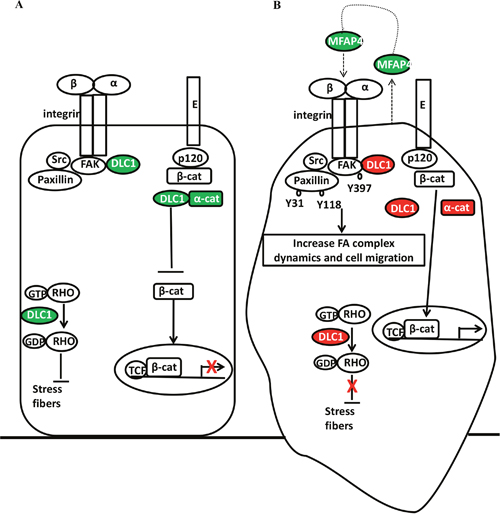
Figure 8: Adhesion molecules (DLC1, α-catenin, MFAP4) interacted with focal adhesion complex, adherens junction, and Rho GTPase. Adhesion-related genes that are expressed or low methylation overexpressed (green) and high methylation silenced (red) correlated with focal adhesion complex, adherens junction, and Rho GTPase in ovarian cancer (A) without or (B) with epigenetic adhesion signatures. E: E-cadherin; p120: p120 catenin; α-cat: α-catenin; β-cat: β-catenin; GTP: guanosine triphosphate; GDP: guanosine diphosphate; TCF: transcription factor; FAK Y397: FAK Y397 phosphorylation; Paxillin Y118 and Y31: Paxillin Y118 and Y31 phosphorylation; FA: focal adhesion.
Microfibrillar-associated protein 4 (MFAP4) is an ECM glycoprotein that binds to collagen and elastin [52]. It has a fibrinogen-like domain in the C-terminal region and an Arg-Gly-Asp (RGD) sequence in the N-terminal region that can be a binding motif for cellular surface integrins, which may involve in cell adhesive activity [53, 54]. The role of MFAP4 in cancer is not clear. MFAP5 (which was previously called: MAGP2, microfibril-associated glycoprotein 2) is a secretory protein which prolongs ovarian cancer cell survival, and increases endothelial cell motility, survival through the αvβ3 integrin receptor. MFAP5 is a poor prognostic factor in ovarian cancer and its increased expression is correlated with microvessel density [55]. MFAP4 promotes vascular smooth muscle cell proliferation and migration via the same integrin receptor [56]. Because MFAP4 and MFAP5 are ECM proteins and both act through the αvβ3 integrin receptor, we speculate that MFAP4 has a similar biological function to MFAP5. Low methylation of MFAP4 may increase secretory MFAP4, which may act as an autocrine agent by binding to the cancer cell integrin receptors, and as a paracrine agent by binding to endothelial cell integrin receptors to increase angiogenesis (Figure 8B). Vitronectin (VTN) is also an ECM glycoprotein with an RGD sequence and binds to the integrin αvβ3 receptors, which may promote cell attachment, spread, and migration [57]. Ovarian cancer cells synthesize VTN and use VTN to organize the adhesion [58]. In the present study, low methylation of VTN is significantly associated with poor OS. VTN has been reported to facilitate disease progression in breast cancer and melanoma [59, 60]. Therefore, VTN could be an important prognostic factor and a therapeutic target.
CONCLUSION
We identified novel methylated adhesion-related genes that can predict PFS in ovarian cancer by integration of methylomics and genomics analyses. We proposed a methylation gene signature with CTNNA1, DCL1, and MFAP4, which can further identify those patients with a poor prognosis. The potential of this methylation signature was validated in independent datasets. Using this methylation signature can help us to identify those who may have a poor response to current treatment, and delivery of customized epigenetic and targeted therapies might improve the outcome. The detection of tumor-specific methylation in cell-free DNA from serum or plasma is appealing [61]. The clinical application of DNA methylation signature testing using cell-free DNA warrants further investigation.
MATERIALS AND METHODS
Methylomics and transcriptomics datasets for biomarker discovery
A methylomics dataset of 391 high-grade serous ovarian cancer samples was constructed using a HumanMethylation27 BeadChip (Illumina, San Diego, CA, USA) [32]. We downloaded level 3 methylation data from TCGA data portal (http://cancergenome.nih.gov/) and used clinical data variables, including age at diagnosis, tumor stage, tumor grade, tumor histology, progression-free status, and vital status. The patient characteristics are listed exhaustively in Table 1. The methylation level was shown as β-values normalized by normal background. The methylation profiling of 27,578 highly informative CpG sites located the promoters of 14,475 genes. We selected 1057 probes (551 genes) that were annotated with adhesion-related function. Next, we selected 914 probes (located at the promoter of 524 genes), which had available values of all samples in the TCGA dataset, which were used for further analysis.
The transcriptomics dataset included 585 data of high-grade serous ovarian cancer samples and eight data of adjacent normal samples and was performed using an Affymetrix HT-HG-U133A GeneChips (Santa Clara, CA, USA). Level 3 data was downloaded from the TCGA data portal. To limit the 524 adhesion-related genes, we integrated transcriptomics data and selected genes, which were calculated using differential gene expression using a t-test (p < 0.05) and low expression in cancer tissues. Finally, we selected 183 probes (106 genes) to conduct survival analyses.
Methylomics datasets for validation
The first dataset was generated using ovarian cancer tissues collected from the Tri-Service General Hospital (TSGH). After excluding patients with suboptimal debulking, we selected 37 samples of stage I–IV ovarian cancer for epigenomics analyses using an Infinium HumanMethylation27 BeadChip and collected their demographic and clinical data. The study was conducted with approval from the Institutional Review Board of the TSGH.
A second dataset, from the Australian Ovarian Cancer Study (AOCS) database, included 91 high-grade serous tumors. The DNA methylation levels were quantified using an Illumina Human Methylation 450 BeadChip. All clinical parameters and methylation levels were available from the AOCS data portal.
Survival analysis
For survival analysis, we used the average methylation level of each gene in all samples as the cutoff values in each methylomics dataset. A methylation level, which was higher or lower than the cutoff value indicates high or low methylation. Kaplan–Meier analysis estimates the probability of PFS by using a log-rank test. The univariate and multivariate Cox regression analyses were used to estimate the hazard ratio (HR) and 95% confidence interval (CI) for the risk of clinicopathological characteristics and each candidate gene. Statistical analyses were performed using SPSS for Windows (version 20.0; IBM Corp, Armonk, NY, USA). All analyses were two-sided, and p < 0.05 was regarded as significant.
Abbreviations
CAMs: cell adhesion molecules; ECM: extracellular matrix; TCGA: The Cancer Genome Atlas; PFS: progression-free survival, OS: overall survival; TSGH: Tri-Service General Hospital; AOCS: Australian Ovarian Cancer Study; Ig-CAMs: immunoglobulin-like CAMs; EpCAM: epithelial cell adhesion molecule; CTNNA1: human alpha-catenin; DLC1: human deleted in liver cancer 1; MFAP4: microfibrillar-associated protein 4; FAK: focal adhesion kinase; HR: hazard ratio; CI: confidence interval; RGD: Arg-Gly-Asp.
Author contributions
Conceptualization by Ping-Ying Chang, Hung-Cheng Lai; methodology by Ping-Ying Chang, Yu-Ping Liao; validation by Hui-Chen Wang, Yu-Chih Chen; formal analysis by Yu-Ping Liao, Rui-Lan Huang; resources by Ping-Ying Chang, Hung-Cheng Lai; data curation by Yu-Ping Liao, Rui-Lan Huang; writing (original draft) by Ping-Ying Chang, Yu-Ping Liao; writing (review and editing) by Yu-Chi Wang, Chiou-Chung Yuan, Hung-Cheng Lai; supervision by Hung-Cheng Lai; project administration by Ping-Ying Chang, Hung-Cheng Lai; funding acquisition by Ping-Ying Chang, Hung-Cheng Lai.
ACKNOWLEDGMENTS
We would like to thank Professor Shih-Ming Huang, Department of Biochemistry, National Defense Medical Center, Taipei, Taiwan for the critical appraisal of this manuscript and recommendation.
CONFLICTS OF INTEREST
The authors declare no potential conflicts of interest.
FUNDING
This work was supported in part by the following grants: TSGH-C101-051; TSGH-C105-096;TSGH-C105-041 from the Tri-Service General Hospital; MOST 105-2628-B-038 -011 -MY3 from Ministry of Science and Technology; 105TMU-SHH-09 from Taipei Medical University and Shuang-Ho Hospital; NHRI-EX105-10406BI from National Health Research Institutes; the Teh-Tzer Study Group for Human Medical Research Foundation.
REFERENCES
1. Siegel R, Ma J, Zou Z, Jemal A. Cancer statistics, 2014. CA Cancer J Clin. 2014; 64:9-29.
2. Ferlay J, Soerjomataram I, Dikshit R, Eser S, Mathers C, Rebelo M, Parkin DM, Forman D, Bray F. Cancer incidence and mortality worldwide: sources, methods and major patterns in GLOBOCAN 2012. Int J Cancer. 2015; 136:E359-E386.
3. Jelovac D, Armstrong DK. Recent progress in the diagnosis and treatment of ovarian cancer. CA Cancer J Clin. 2011; 61:183-203.
4. Bast RC Jr, Hennessy B, Mills GB. The biology of ovarian cancer: new opportunities for translation. Nat Rev Cancer. 2009; 9:415-428.
5. Cannistra SA. Cancer of the ovary. N Engl J Med. 2004; 351:2519-2529.
6. Agarwal R, Kaye SB. Prognostic factors in ovarian cancer: how close are we to a complete picture? Ann Oncol. 2005; 16:4-6.
7. Makrilia N, Kollias A, Manolopoulos L, Syrigos K. Cell adhesion molecules: role and clinical significance in cancer. Cancer Invest. 2009; 27:1023-1037.
8. Elmasri WM, Casagrande G, Hoskins E, Kimm D, Kohn EC. Cell adhesion in ovarian cancer. Cancer Treat Res. 2009; 149:297-318.
9. Cavallaro U, Christofori G. Cell adhesion and signalling by cadherins and Ig-CAMs in cancer. Nat Rev Cancer. 2004; 4:118-132.
10. Sundfeldt K. Cell-cell adhesion in the normal ovary and ovarian tumors of epithelial origin; an exception to the rule. Mol Cell Endocrinol. 2003; 202:89-96.
11. Faleiro-Rodrigues C, Macedo-Pinto I, Pereira D, Ferreira VM, Lopes CS. Association of E-cadherin and beta-catenin immunoexpression with clinicopathologic features in primary ovarian carcinomas. Hum Pathol. 2004; 35:663-669.
12. Faleiro-Rodrigues C, Macedo-Pinto I, Pereira D, Lopes CS. Prognostic value of E-cadherin immunoexpression in patients with primary ovarian carcinomas. Ann Oncol. 2004; 15:1535-1542.
13. Shim HS, Yoon BS, Cho NH. Prognostic significance of paired epithelial cell adhesion molecule and E-cadherin in ovarian serous carcinoma. Hum Pathol. 2009; 40:693-698.
14. Kaur S, Kenny HA, Jagadeeswaran S, Zillhardt MR, Montag AG, Kistner E, Yamada SD, Mitra AK, Lengyel E. {beta}3-integrin expression on tumor cells inhibits tumor progression, reduces metastasis, and is associated with a favorable prognosis in patients with ovarian cancer. Am J Pathol. 2009; 175:2184-2196.
15. Desgrosellier JS, Cheresh DA. Integrins in cancer: biological implications and therapeutic opportunities. Nat Rev Cancer. 2010; 10:9-22.
16. Sawada K, Ohyagi-Hara C, Kimura T, Morishige K. Integrin inhibitors as a therapeutic agent for ovarian cancer. J Oncol. 2012; 2012:915140.
17. Spizzo G, Went P, Dirnhofer S, Obrist P, Moch H, Baeuerle PA, Mueller-Holzner E, Marth C, Gastl G, Zeimet AG. Overexpression of epithelial cell adhesion molecule (Ep-CAM) is an independent prognostic marker for reduced survival of patients with epithelial ovarian cancer. Gynecol Oncol. 2006; 103:483-488.
18. Battista MJ, Cotarelo C, Jakobi S, Steetskamp J, Makris G, Sicking I, Weyer V, Schmidt M. Overexpression of epithelial cell adhesion molecule protein is associated with favorable prognosis in an unselected cohort of ovarian cancer patients. J Cancer Res Clin Oncol. 2014; 140:1097-1102.
19. Heiss MM, Murawa P, Koralewski P, Kutarska E, Kolesnik OO, Ivanchenko VV, Dudnichenko AS, Aleknaviciene B, Razbadauskas A, Gore M, Ganea-Motan E, Ciuleanu T, Wimberger P, et al. The trifunctional antibody catumaxomab for the treatment of malignant ascites due to epithelial cancer: Results of a prospective randomized phase II/III trial. Int J Cancer. 2010; 127:2209-2221.
20. Jones PA, Baylin SB. The fundamental role of epigenetic events in cancer. Nat Rev Genet. 2002; 3:415-428.
21. Heyn H, Esteller M. DNA methylation profiling in the clinic: applications and challenges. Nat Rev Genet. 2012; 13:679-692.
22. Esteller M, Garcia-Foncillas J, Andion E, Goodman SN, Hidalgo OF, Vanaclocha V, Baylin SB, Herman JG. Inactivation of the DNA-repair gene MGMT and the clinical response of gliomas to alkylating agents. N Engl J Med. 2000; 343:1350-1354.
23. Su HY, Lai HC, Lin YW, Chou YC, Liu CY, Yu MH. An epigenetic marker panel for screening and prognostic prediction of ovarian cancer. Int J Cancer. 2009; 124:387-393.
24. Wei SH, Balch C, Paik HH, Kim YS, Baldwin RL, Liyanarachchi S, Li L, Wang Z, Wan JC, Davuluri RV, Karlan BY, Gifford G, Brown R, et al. Prognostic DNA methylation biomarkers in ovarian cancer. Clin Cancer Res. 2006; 12:2788-2794.
25. Huang RL, Gu F, Kirma NB, Ruan J, Chen CL, Wang HC, Liao YP, Chang CC, Yu MH, Pilrose JM, Thompson IM, Huang HC, Huang TH, et al. Comprehensive methylome analysis of ovarian tumors reveals hedgehog signaling pathway regulators as prognostic DNA methylation biomarkers. Epigenetics. 2013; 8:624-634.
26. Liao YP, Chen LY, Huang RL, Su PH, Chan MW, Chang CC, Yu MH, Wang PH, Yen MS, Nephew KP, Lai HC. Hypomethylation signature of tumor-initiating cells predicts poor prognosis of ovarian cancer patients. Hum Mol Genet. 2014; 23:1894-1906.
27. Dai W, Teodoridis JM, Zeller C, Graham J, Hersey J, Flanagan JM, Stronach E, Millan DW, Siddiqui N, Paul J, Brown R. Systematic CpG islands methylation profiling of genes in the wnt pathway in epithelial ovarian cancer identifies biomarkers of progression-free survival. Clin Cancer Res. 2011; 17:4052-4062.
28. Wang Q, Wang B, Zhang YM, Wang W. The association between CDH1 promoter methylation and patients with ovarian cancer: a systematic meta-analysis. J Ovarian Res. 2016; 9:23.
29. Arnold JM, Cummings M, Purdie D, Chenevix-Trench G. Reduced expression of intercellular adhesion molecule-1 in ovarian adenocarcinomas. Br J Cancer. 2001; 85:1351-1358.
30. Zhou F, Tao G, Chen X, Xie W, Liu M, Cao X. Methylation of OPCML promoter in ovarian cancer tissues predicts poor patient survival. Clin Chem Lab Med. 2014; 52:735-742.
31. Tothill RW, Tinker AV, George J, Brown R, Fox SB, Lade S, Johnson DS, Trivett MK, Etemadmoghadam D, Locandro B, Traficante N, Fereday S, Hung JA, et al. Novel molecular subtypes of serous and endometrioid ovarian cancer linked to clinical outcome. Clin Cancer Res. 2008; 14:5198-5208.
32. Cancer Genome Atlas Research Network. Integrated genomic analyses of ovarian carcinoma. Nature. 2011; 474:609-615.
33. Sulzmaier FJ, Jean C, Schlaepfer DD. FAK in cancer: mechanistic findings and clinical applications. Nat Rev Cancer. 2014; 14:598-610.
34. Ward KK, Tancioni I, Lawson C, Miller NL, Jean C, Chen XL, Uryu S, Kim J, Tarin D, Stupack DG, Plaxe SC, Schlaepfer DD. Inhibition of focal adhesion kinase (FAK) activity prevents anchorage-independent ovarian carcinoma cell growth and tumor progression. Clin Exp Metastasis. 2013; 30:579-594.
35. Kim TY, Lee JW, Kim HP, Jong HS, Kim TY, Jung M, Bang YJ. DLC-1, a GTPase-activating protein for Rho, is associated with cell proliferation, morphology, and migration in human hepatocellular carcinoma. Biochem Biophys Res Commun. 2007; 355:72-77.
36. Fan DM, Shi HR. Pilot study: alteration of deleted in liver cancer1 and phosphorylated focal adhesion kinase Y397 cytoplasmic expression and the prognostic value in advanced epithelial ovarian carcinoma. Int J Mol Sci. 2011; 12:8489-8501.
37. Diamandis M, White NM, Yousef GM. Personalized medicine: marking a new epoch in cancer patient management. Mol Cancer Res. 2010; 8:1175-1187.
38. Jabbour E, Issa JP, Garcia-Manero G, Kantarjian H. Evolution of decitabine development: accomplishments, ongoing investigations, and future strategies. Cancer. 2008; 112:2341-2351.
39. Matei D, Fang F, Shen C, Schilder J, Arnold A, Zeng Y, Berry WA, Huang T, Nephew KP. Epigenetic resensitization to platinum in ovarian cancer. Cancer Res. 2012; 72:2197-2205.
40. Gaudet F, Hodgson JG, Eden A, Jackson-Grusby L, Dausman J, Gray JW, Leonhardt H, Jaenisch R. Induction of tumors in mice by genomic hypomethylation. Science. 2003; 300:489-492.
41. Sun Y, Zhang J, Ma L. α-catenin. A tumor suppressor beyond adherens junctions. Cell Cycle. 2014; 13:2334-2339.
42. Anttila M, Kosma VM, Ji H, Wei-Ling X, Puolakka J, Juhola M, Saarikoski S, Syrjanen K. Clinical significance of alpha-catenin, collagen IV, and Ki-67 expression in epithelial ovarian cancer. J Clin Oncol. 1998; 16:2591-2600.
43. Popescu NC, Goodison S. Deleted in liver cancer-1 (DLC1): an emerging metastasis suppressor gene. Mol Diagn Ther. 2014; 18:293-302.
44. Barras D, Widmann C. GAP-independent functions of DLC1 in metastasis. Cancer Metastasis Rev. 2014; 33:87-100.
45. Dubash AD, Menold MM, Samson T, Boulter E, Garcia-Mata R, Doughman R, Burridge K. Chapter 1. Focal adhesions: new angles on an old structure. Int Rev Cell Mol Biol. 2009; 277:1-65.
46. Mitra SK, Schlaepfer DD. Integrin-regulated FAK-Src signaling in normal and cancer cells. Curr Opin Cell Biol. 2006; 18:516-523.
47. Wong CM, Lee JM, Ching YP, Jin DY, Ng IO. Genetic and epigenetic alterations of DLC-1 gene in hepatocellular carcinoma. Cancer Res. 2003; 63:7646-7651.
48. Li G, Du X, Vass WC, Papageorge AG, Lowy DR, Qian X. Full activity of the deleted in liver cancer 1 (DLC1) tumor suppressor depends on an LD-like motif that binds talin and focal adhesion kinase (FAK). Proc Natl Acad Sci U S A. 2011; 108:17129-17134.
49. Kaushik S, Ravi A, Hameed FM, Low BC. Concerted modulation of paxillin dynamics at focal adhesions by Deleted in Liver Cancer-1 and focal adhesion kinase during early cell spreading. Cytoskeleton (Hoboken). 2014; 71:677-694.
50. Tripathi V, Popescu NC, Zimonjic DB. DLC1 interaction with alpha-catenin stabilizes adherens junctions and enhances DLC1 antioncogenic activity. Mol Cell Biol. 2012; 32:2145-2159.
51. Tripathi V, Popescu NC, Zimonjic DB. DLC1 induces expression of E-cadherin in prostate cancer cells through Rho pathway and suppresses invasion. Oncogene. 2014; 33:724-733.
52. Toyoshima T, Nishi N, Kusama H, Kobayashi R, Itano T. 36-kDa microfibril-associated glycoprotein (MAGP-36) is an elastin-binding protein increased in chick aortae during development and growth. Exp Cell Res. 2005; 307:224-230.
53. Schlosser A, Thomsen T, Shipley JM, Hein PW, Brasch F, Tornoe I, Nielsen O, Skjodt K, Palaniyar N, Steinhilber W, McCormack FX, Holmskov U. Microfibril-associated protein 4 binds to surfactant protein A (SP-A) and colocalizes with SP-A in the extracellular matrix of the lung. Scand J Immunol. 2006; 64:104-116.
54. Ruoslahti E. RGD, other recognition sequences for integrins. Annu Rev Cell Dev Biol. 1996; 12:697-715.
55. Mok SC, Bonome T, Vathipadiekal V, Bell A, Johnson ME, Wong KK, Park DC, Hao K, Yip DK, Donninger H, Ozbun L, Samimi G, Brady J, et al. A gene signature predictive for outcome in advanced ovarian cancer identifies a survival factor: microfibril-associated glycoprotein 2. Cancer Cell. 2009; 16:521-532.
56. Schlosser A, Pilecki B, Hemstra LE, Kejling K, Kristmannsdottir GB, Wulf-Johansson H, Moeller JB, Fuchtbauer EM, Nielsen O, Kirketerp-Moller K, Dubey LK, Hansen PB, Stubbe J, et al. MFAP4 promotes vascular smooth muscle migration, proliferation and accelerates neointima formation. Arterioscler Thromb Vasc Biol. 2016; 36:122-133.
57. Schvartz I, Seger D, Shaltiel S. Vitronectin. Int J Biochem Cell Biol. 1999; 31:539-544.
58. Carreiras F, Cruet S, Staedel C, Sichel F, Gauduchon P. Human ovarian adenocarcinoma cells synthesize vitronectin and use It to organize their adhesion. Gynecol Oncol. 1999; 72:312-322.
59. Aaboe M, Offersen BV, Christensen A, Andreasen PA. Vitronectin in human breast carcinomas. Biochim Biophys Acta. 2003; 1638:72-82.
60. Tas F, Karabulut S, Bilgin E, Tastekin D, Duranyildiz D. Clinical significance of serum fibronectin and vitronectin levels in melanoma patients. Melanoma Res. 2014; 24:475-479.
61. Warton K, Samimi G. Methylation of cell-free circulating DNA in the diagnosis of cancer. Front Mol Biosci. 2015; 2:13.