
INTRODUCTION
Prostate adenocarcinoma (PCa) is the most common non-skin cancer and a leading cause of cancer-related death in the United States and Europe [1]. PCa morbidity and mortality are also increasing dramatically in Asia, including China [2, 3]. In the past few decades, improvements in screening, diagnostics and treatment have led to a consistent decrease in PCa mortality and an increase in overall survival rates [4]. Nonetheless, hormone-refractory PCa (HRPCa), which is resistant to therapeutic modalities after an initial response to androgen deprivation, remains a significant challenge in prostate cancer treatment [5]. Although numerous genes are implicated in PCa, the molecular mechanisms underlying its progression remain poorly understood.
Hypoxia-inducible factor-1α (HIF-1α) is a trans-cription factor normally regulated by oxygen concentration but is often overexpressed in solid tumors such as cancers of the colon, breast, pancreas, kidney, prostate and bladder [6, 7]. Genes transactivated by HIF-1α include VEGF and erythropoietin (involved in angiogenesis and erythropoiesis), cyclin and FGF (which promote cell proliferation), GLUT-1 (participating in glucose metabolism), MDR1 (important for drug resistance), BCL2-xL (which suppresses apoptosis), and CXCR4 (inducing cell migration and invasion) [8-12].
Dysregulation of miRNA expression and function has been shown to be important for tumorigenesis and progression [13]. For example, underexpression of let-7c, miR-100, miR-145 and miR-218 in PCa was found to be associated with metastasis, and overexpression of miR-182 and miR-96 indicates a higher risk of progression [14, 15]. In our previous reports, we demonstrated that downregulation of miR-145, miR-200c, and miR-199b is significantly associated with PCa progression; in contrast, we found hypoxia-inducible factor (HIF-1α), which may be suppressed by miR-199b, was overexpressed in PCa and inhibited apoptosis via BCL2-xL transactivation [11, 16-18]. Expression of miR-199a-5p has been reported to be downregulated in certain tumors, including malignant testicular tumors, colorectal cancer and hepatocellular carcinoma, but upregulated in others, such as melanoma, gastric cancer and pancreatic adenocarcinoma [19-24], indicating tumor-type-specific regulatory mechanisms.
Microarray screening has indicated that miR-199a-5p is downregulated in PCa, yet its role in PCa is still unknown [25]. Here, we demonstrate that miR-199a-5p suppresses HIF-1α via post-transcriptional regulation of its mRNA and that underexpression of miR-199a-5p in PCa contributes to high HIF-1α levels and PCa progression.
RESULTS
miR-199a-5p was significantly downregulated in prostate cancer
Expression of mature miR-199a-5p was investigated using stem loop RT-PCR. which showed high levels of miR-199a-5p expression were observed in benign prostate hyperplasia (BPH) and normal prostate (NP) tissue but very low levels in PCa tissue. miR-199a-5p was absent or barely detectable in DU145, PC3, LNCaP and CL1 cells (Figure 1A, left panel). Based on real-time Q-PCR, the level of miR-199a-5p in PCa tissue was only 1/39.4 (±0.000021) of that in benign prostate tissue, and it was undetectable in the four PCa cell lines (<1/10,000 of the level in benign prostate tissue; Figure 1A, right panel).
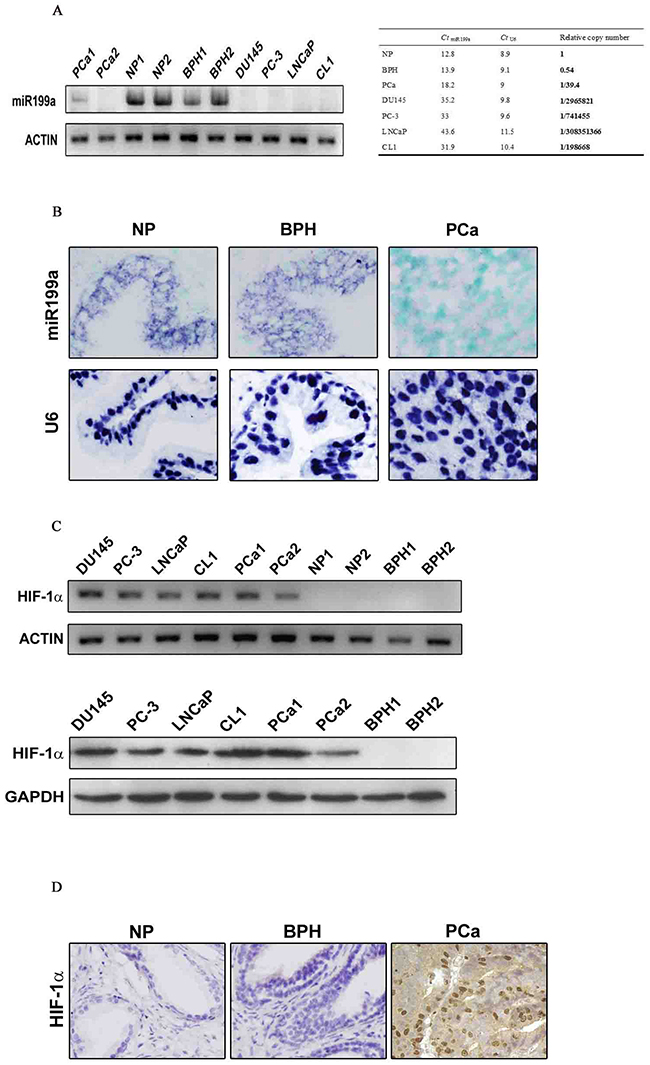
Figure 1: (A) Stem-loop RT-PCR (with actin as positive control) and Q-PCR (with U6 as internal control) analyses showing differential expression levels of mature miR-199a-5p in benign prostate tissue (NP and BPH) vs. prostate cancer (PCa) and prostate cancer cell lines DU145, PC-3, LNCaP and CL1. (B) Further validation of miR-199a-5p loss in prostate cancer by LNA-ISH (nuclear counterstaining with methyl green) with U6 as a positive control. miR-199a-5p and U6 signals are blue-purple (original magnification ×400). (C) In contrast to miR-199a-5p, HIF-1α mRNA (Figure 1C, upper panels, RT-PCR, the same actin control as in A) and protein (Figure 1C, lower panels, Western blot, GAPDH as positive control) levels were significantly higher in prostate cancer tissue and cells than in benign prostate tissue. (D) Immunohistochemical analysis of the HIF-1α protein in tissue sections. Nuclear and cytoplasmic positivity is in brown. Nuclear counterstaining with hematoxylin (original magnification ×400).
To further evaluate miR-199a-5p expression in tissue samples, the expression level of miR-199a-5p was evaluated by in situ hybridization (ISH) in 67 benign tissue samples and 51 PCa tissue samples (Figure 1B). The miR-199a-5p positivity rate in the benign prostate tissue samples (33/67, 49.3%) was significantly higher than that in the PCa tissue samples (15/51, 29.4%, P=0.038;).
miR-199a-5p expression was inversely related to HIF-1α overexpression in prostate cancer
HIF-1α expression in fresh PCa tissue samples and cell lines was analyzed by RT-PCR and Western blotting, revealing high levels of both HIF-1α mRNA (Figure 1C) and protein (Figure 1D) in PCa tissue and cell lines, in contrast to their absence in NP or BPH samples.
Immunohistochemistry on tissue sections showed positive signals for HIF-1α in both the nucleus and cytoplasm, defined as HIF-N and HIF-C, respectively. The HIF-N (42/117, 35.9%) and HIF-C (21/117, 17.9%) positive rates were significantly higher than those in PCa in benign prostate tissue (0/67, 0%, both P=0.000; Table 2).
There was a significant inverse relationship between HIF-N and miR-199a-5p expression, as based on correlation analysis of the HIF-N protein level (determined by IHC) and miR-199a-5p level (determined by LNA-ISH) (rs=-0.393, P<0.01; Table 1). However, no significant correlation was found between HIF-C and miR-199a-5p (Table 1). The HIF-N protein level also correlated with the preoperative serum prostate-specific antigen (PSA) level, the Gleason score and the TNM stage. Conversely, miR-199a-5p expression alone was not significantly associated with PSA level, the Gleason score and the TNM stage (Table 1).
Table 1: Correlation between miR-199a-5p and HIF-1α expression and association of miR-199a-5p and HIF-1α expression levels with the clinicopathological characteristics of prostate adenocarcinoma.
miR199a-5p |
HIF-C |
HIF-N |
AGE |
Gleason |
PSA |
|
|---|---|---|---|---|---|---|
HIF-C |
- 0.215 |
|||||
HIF-N |
- 0.393** |
0.595** |
||||
AGE |
0.080 |
0.018 |
- 0.091 |
|||
Gleason |
- 0.246 |
0.067 |
0.234* |
-0.152 |
||
PSA |
- 0.006 |
0.208* |
0.329** |
0.048 |
0.089 |
|
STAGE |
- 0.259 |
0.117 |
0.370** |
-0.134 |
0.310** |
0.305** |
HIF-C: Cytoplasmic immunostaining score of HIF-1; HIF-N: Nuclear immunostaining score of HIF-1; STAGE: TNM stage; PSA: Serum prostate-specific antigen; Gleason: Gleason score
rs: Spearman rank correlation coefficient; P values were determined by Fisher’s exact test., **, P<0.01, *, P<0.05.
Relationship of miR-199a-5p and HIF-N expression with tumor progression and PCa patient survival
In addition to the significantly different expression pattern of miR-199a-5p and HIF-1α in benign and cancerous prostate tissue samples (Tables 1 and 2; Figure 1), the positive rate of HIF-N in PCa with progression (27/58, 46.6%) was significantly higher than that in PCa without progression (15/59, 25.4%, P=0.021; Table 2).
Table 2: Relationship of miR-199a-5p/HIF-1α expression levels with prostate cancer progression
miR199a (+) |
HIF-C (+) (%) |
HIF-N (+) (%) |
|
|---|---|---|---|
BPH |
33/67 (49.3)* |
0/67 (0.0)* |
0/67 (0.0)* |
PCa total |
15/51 (29.4) |
21/117 (17.9) |
42/117 (35.9) |
PCa with progression |
5/21 (23.8) |
8/58 (13.8) |
27/58 (46.6) |
PCa without progression |
10/30 (33.3) |
13/59 (22.0) |
15/59 (25.4) |
P values |
|||
BPH vs. PCa total |
0.038 |
0.000 |
0.000 |
BPH vs. PCa with progression |
0.047 |
0.002 |
0.000 |
BPH vs. PCa without progression |
0.186 |
0.000 |
0.000 |
PCa with progression vs. without progression |
0.543 |
0.336 |
0.021 |
Notes: miR-199a-5p(+) was defined as an ISH staining score of 4 or above. HIF-C(+) was defined as an IHC staining score of 2 or above. HIF-N(+) was defined as nuclear immunostaining score 3% or higher. P values were determined by Fisher’s exact test.
Abbreviations: BPH, benign prostate hyperplasia; PCa, prostate cancer.
* Number of miR-199a-5p(+) or HIF-1α(+) cases/total number of cases (positive rate %).
Kaplan-Meier analysis showed an increased level of nuclear HIF-1α (HIF-N>3%) to be a significantly negative prognostic factor for both disease-specific survival (DSS) and progression-free survival (PFS) in PCa patients, as were the PSA level and TNM stage (P<0.05; Figure 2, Table 3). However, miR-199a-5p expression alone was not significantly associated with DSS or PFS (Table 3).
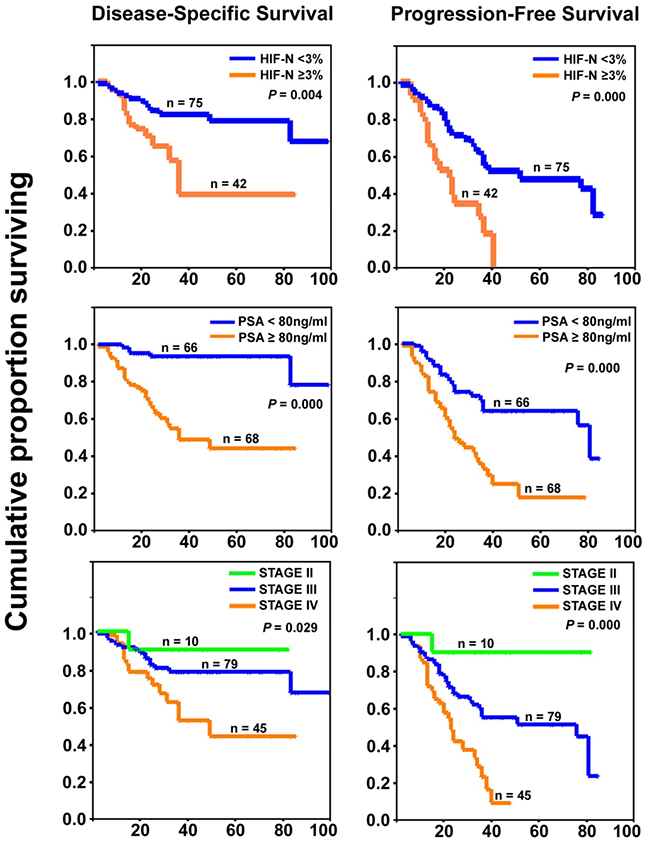
Figure 2: Prognostic significance of HIF-1α overexpression in prostate cancer. Kaplan-Meier curves (with log-rank test P values) showing significantly poorer prognosis for patients with increased HIF-N, higher PSA level, and higher TNM stage. Abscissa: time in months.
Table 3: Prognostic significance of miR-199a-5p/HIF-1α expression and clinicopathologic characteristics of PCa.
DSS |
PFS |
|||
|---|---|---|---|---|
n/N |
P |
n/N |
P |
|
miR199a |
||||
≥4 |
2/15 |
0.572 |
5/15 |
0.642 |
<4 |
8/36 |
16/36 |
||
HIF-C |
||||
≥2 |
5/21 |
0.920 |
8/21 |
0.701 |
<2 |
25/96 |
50/96 |
||
HIF-N |
||||
≥3 |
16/42 |
0.004 |
27/42 |
0.000 |
<3 |
14/75 |
31/75 |
||
AGE |
||||
≥70 |
11/48 |
0.395 |
26/48 |
0.734 |
<70 |
23/86 |
38/86 |
||
Gleasonscore |
||||
≥8 |
25/88 |
0.307 |
47/88 |
0.053 |
<8 |
9/46 |
17/46 |
||
PSA |
||||
≥80 ng/ml |
29/68 |
0.000 |
42/68 |
0.000 |
<80 ng/ml |
5/66 |
22/66 |
||
STAGE |
||||
II |
1/10 |
0.029 |
1/10 |
0.000 |
III |
16/79 |
33/79 |
||
IV |
17/45 |
30/45 |
||
P value was determined by Kaplan-Meier survival analysis with the log-rank test.
DSS, Disease-specific survival; PFS, Progression-free survival. n: number of cases with events; N: total number of cases. miR199a: miR-199a-5p LNA-ISH score; HIF-C: cytoplasmic HIF1α immunostaining score; HIF-N: nuclear HIF1α immunostaining score.
Identification of a potential HIF-1α 3’-UTR seed sequence
The 1174-nt 3’-UTR of the HIF-1α mRNA was analyzed using Target Scan 7.1 (http://www.targetscan.org), which identified miR-199a-5p as the major potential regulatory miRNA of HIF-1α. The 31 to 37-nt stretch of the HIF-1α 3’-UTR was the potential seed sequence (Figure 3A) highly conserved across species (Figure 3B). Sequence analysis showed no mutation or deletion of the 3’-UTR in PC-3, DU145, LNCaP or CL1 cells.
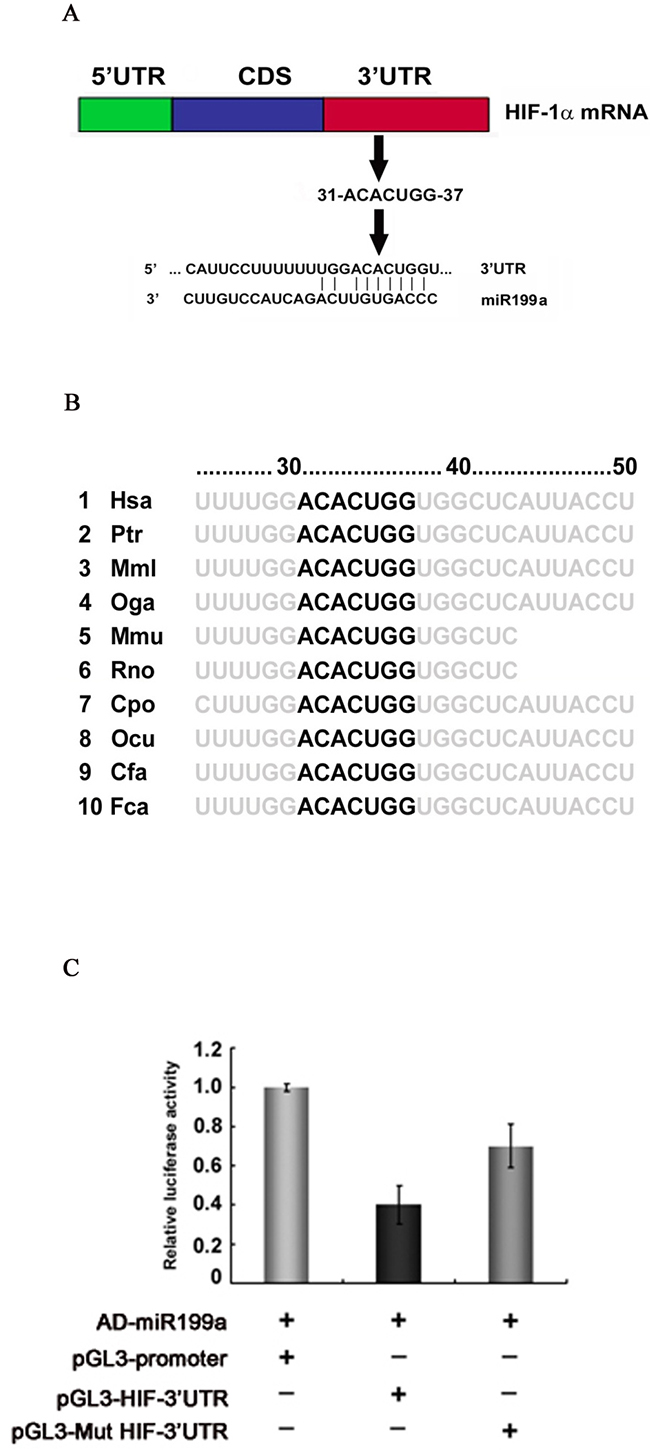
Figure 3: Identification of the miR-199a-5p seed sequence in the HIF-1α 3’-UTR and dual reporter gene assays for interaction between miR-199a and the HIF-1α 3’-UTR. (A) The 31 to 37-nt sequence of HIF-1α was identified as a potential seed sequence for miR-199a-5p. (B) The seed sequence for miR-199a-5p in the HIF-1α 3’-UTR is conserved across species. (C) Dual reporter gene assays were performed using pGL3 expression constructs with HIF-1α 3’-UTR regions containing the seed sequence inserted downstream of the luciferase coding sequence; the activity of the basic pGL3 construct was used as the baseline (pGL3-Promoter). With artificial expression of miR-199a-5p (by coinfection with AD-miR-199a-5p), reporter gene activity, represented by relative luciferase activity (firefly/Renilla), was significantly decreased when the miR-199a seed sequence of the HIF-1α 3’-UTR was present (pGL3-HIF-3’UTR); mutation of the seed sequence (pGL3-Mut HIF-3’UTR) significantly restored reporter gene activity. Expression of miR-199a-5p alone had no effect on reporter gene activity when no seed sequence was present.
miR-199a-5p targeted the 3’-UTR of HIF-1α
To demonstrate posttranscriptional regulation of HIF-1α mRNA by miR-199a-5p, luciferase reporter gene constructs were prepared. The potential seed sequence for miR-199a-5p and the flanking sequence of the HIF-1α 3’-UTR were cloned into luciferase reporter gene constructs. Constructs in which the seed sequences were mutated were also prepared.
With artificial overexpression of miR-199a-5p by infection with Ad-miR-199a-5p, dual reporter assays revealed significant downregulation of luciferase reporter gene activity by 62.1% (±0.012) for the pGL3-HIF-3’-UTR constructs. In contrast, luciferase reporter gene activity was largely restored when using the pGL3-Mut HIF-3’-UTR, in which the seed sequence of the HIF-1α 3’-UTR was mutated (Figure 3C).
Artificial miR-199a-5p overexpression by adenoviral vectors led to downregulation of the HIF-1α protein and genes downstream of HIF-1α
Concomitant with the artificial overexpression of mature miR-199a-5p by Ad-miR-199a infection, the HIF-1α protein level was significantly downregulated with miR-199a-5p though little change was observed for the level of HIF-1α mRNA (Figure 4A). Moreover, the HIF-1α downstream genes BNIP3, BCL-xL, VEGF and CXCR4 were also significantly downregulated artificial overexpression (Figure 4B).
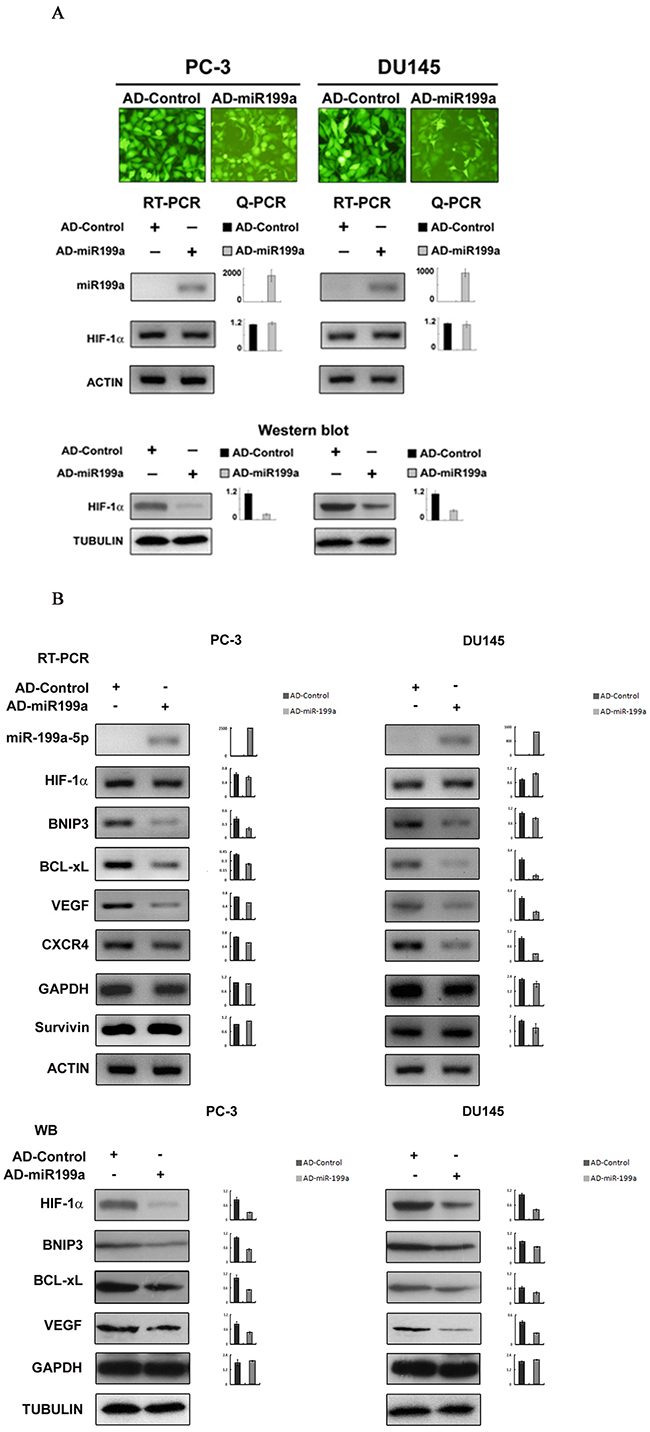
Figure 4: Effects on HIF-1α and HIF-1α downstream gene expression by artificial overexpression of miR-199a-5p in PC-3 and DU145 cells. (A) The efficiency of AD-miR-199a and AD-Control infection is shown by homogeneous green fluorescence protein expression in infected cells (A, top panel, original magnification ×400). AD-miR-199a-5p-mediated miR-199a-5p overexpression led to no significant change in HIF-1α mRNA expression compared with AD-Control (A, middle panel, Q-PCR, mean±SD of three independent experiments, P>0.05), whereas significant overexpression of miR-199a-5p was observed (A, middle panel, Q-PCR, mean±SD of three independent experiments, P<0.05). AD-miR-199a-5p (but not AD-Control)-mediated miR-199a-5p overexpression led to downregualtion of the HIF-1α protein (A, bottom, Western blot with semiquantitative histograms, mean±SD of three independent experiments, P<0.05). (B) RT-PCR and Q-PCR shows that AD-miR-199a-5p (but not AD-Control)-mediated miR-199a-5p overexpression led to a decrease in expression of HIF-1α downstream genes (VEGF, CXCR4, BNIP-3 and BCL-xL) in PC-3 and DU145 cells. (top panel, histograms showing quantitative analysis of three independent experiments, P<0.05). Western blotting shows that the HIF-1α downstream genes BNIP3, BCL-xL, VEGF and CXCR4 were simultaneously downregulated upon artificial miR-199a-5p overexpression and consequent HIF-1α downregulation (bottom panel, histograms showing semiquantitative analysis of three independent experiments, P<0.05).
Biological effects of miR-199a-5p overexpression and HIF-1α downregulation
Synchronous with the changes in HIF/BNIP3/BCL-xL/VEGF/CXCR4 upon artificial miR-199a-5p overexpression, PC-3 and DU145 cells showed reduced growth, invasiveness and tumor angiogenic ability (Figure 5A, 5B and 5C) but increased apoptosis (as assessed by the TUNEL assay; Figure 5D).
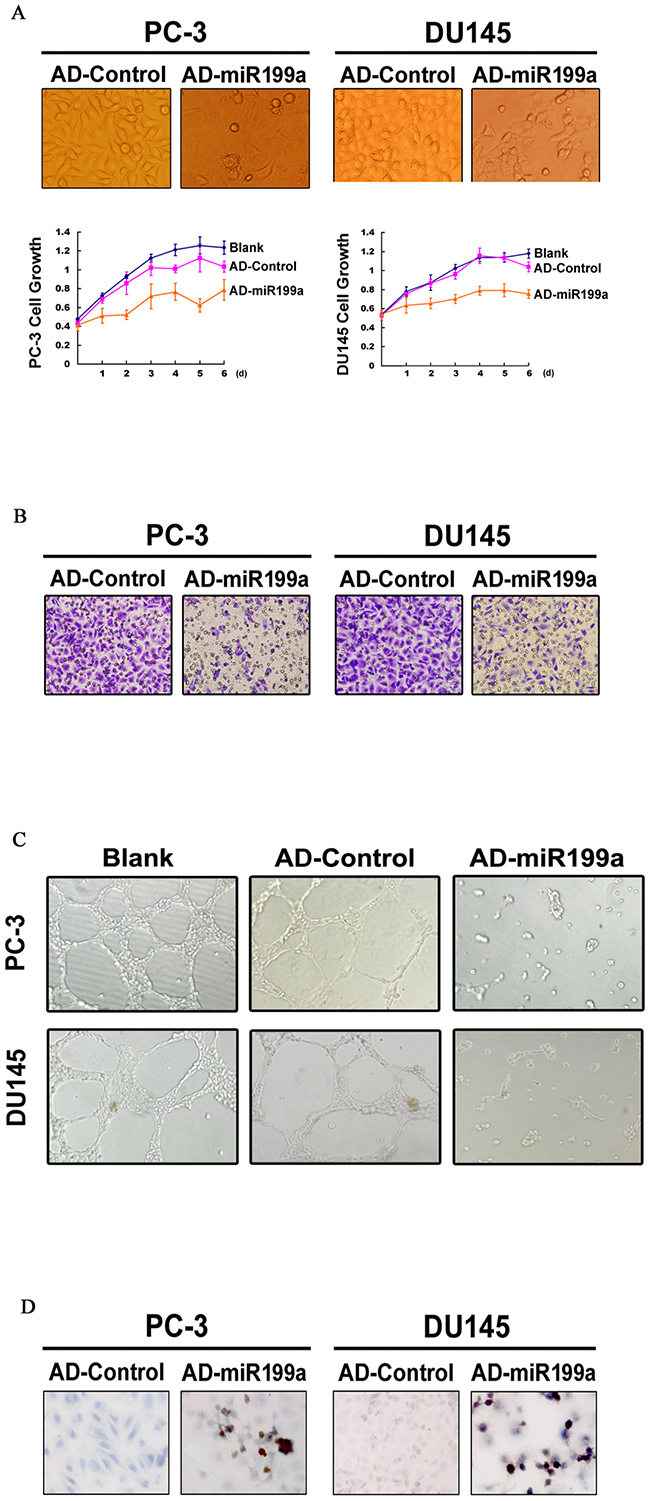
Figure 5: (A) Cell growth was significantly reduced upon artificial miR-199a-5p overexpression (original magnification ×400). (B) miR-199a-5p overexpression reduced cell invasiveness (original magnification ×400). (C) A tubule-formation assay showed reduced endothelial tubule formation when incubated with a tumor conditioned medium collected from PC-3/DU145 cells infected with AD-miR-199a (original magnification ×100). (D) Increased apoptosis upon miR-199a-5p overexpression, as shown by the TUNEL assay (original magnification ×400).
DISCUSSION
In this study, we show that HIF-1α mRNA is a functionally relevant target of miR-199a-5p, the downregulation of which contributes to the oncogenic high level of HIF-1α in Pca [11, 16-18], as well as tumor progression and unfavorable patient survival.
A large body of experimental evidence supports that hypoxia-mediated or -independent increases of HIF-1α plays critical roles in tumorigenesis and progression of many cancers via HIF-1α-dependent activation of genes that promote cancer cell survival or proliferation (such as BCL-xL), spread (e.g., CXCR4), and angiogenesis (e.g., VEGF) [26-29]. High levels of HIF-1α protein and mRNA have been observed in PCa tissues and cell lines [30-32], and our data demonstrate that HIF-N (nuclear HIF-1α expression, the functional state) correlates significantly with TNM stage, Gleason score, tumor progression and poor survival (both DSS and PFS).
HIF-1α, a transcription factor normally regulated by tissue oxygen concentrations [33], regulates numerous genes such as BNIP3, BCL-xL, VEGF, CXCR4, and Survivin [11, 34-37], which are involved in cell survival, proliferation, apoptosis and angiogenesis. Physiologically, HIF-1α mediates the cellular response to hypoxia. Under normoxic conditions, HIF-1α is hydroxylated at crucial prolyl residues, which is followed by binding to pVHL, ubiquitination and proteasome-mediated degradation. Conversely, hypoxia inhibits prolyl hydroxylation, thus preventing pVHL-mediated HIF-1α ubiquitination and degradation [38]. HIF-1α is regulated by major signaling pathways, including the extracellular signal-regulated kinase (ERK) and protein kinase B (AKT) pathways [39, 40]. More recent studies highlight the importance of epigenetic or post-transcriptional modulation of HIF-1α. For example, the histone deacetylase SIRT1 suppresses acetylation of H3K14 and inhibits HIF-1α at the transcriptional level [41]. The long non-coding RNA (lncRNA) CPS1-IT1 acts as a co-chaperone, alters Hsp90 and HIF-1α binding affinity and reduces HIF-1α activity in hepatocellular carcinoma [42]. In addition, LINK-A recruits BRK and LRRK2, which phosphorylate HIF-1α at Tyr565 and Ser797, respectively, preventing HIF-1α degradation [43].
In our previous work, we found reduced levels of miR-145, miR-200c and miR-199b, which target BNIP3, IRS1 and HIF-1α, respectively, in PCa [16-18]. A number of miRNAs that are differentially expressed in response to hypoxia (hypoxia-regulated miRNAs; HRMs) may stabilize/destabilize HIF-1α. Hypoxia-induced miR-210 and miR-424 may stabilize HIF-1α by repressing glycerol-3-phosphate dehydrogenase 1-like (GPDL1) and cullin2 (CUL2), respectively [44, 45]. Some HRMs such as miR-20b, miR-199 and miR-17-92 may destabilize HIF-1α [46-48]. We previously showed that miR-199b negatively regulated HIF-1α by targeting its 3’-UTR region and that downregulation of miR-199b in PCa induced cell growth and decreased cell death [17]. It has been reported that miR-199a-5p may also target HIF-1α to reduce proliferation and angiogenesis in melanoma, multiple myeloma and soft tissue sarcoma [49-51].
The miR-199a-5p expression status appears to vary in different tumors. For example, it has been reported to be upregulated in gastric cancer and pancreatic adenocarcinoma but downregulated in testicular cancer, ovarian cancer, multiple myeloma, colorectal cancer and hepatocellular carcinoma [19-24, 49, 52-54]. Different populations of cancer cells derived from epithelial ovarian cancers (EOC) may express different levels of miR-199a-5p [55, 56]. Therefore, miR-199a-5p expression appears to be defined by the specific tissue and environment.
Data for miR-199a-5p expression and functions in prostate cancer are very limited [25, 52, 57]. Two microarray screening assays indicate that miR-199a-5p is downregulated in PCa and that miR-199a-5p cooperates with miR-181a and miR-30d to reduce PCa drug resistance by targeting GRP78. Our data demonstrated that miR-199a-5p is downregulated in PCa, but, in contrast to HIF-1α nuclear expression level, it alone was not significantly associated with patient survival, indicating miR-199a-5p was among many factors influencing HIF-1α level, which was a major determinant of tumor progression and patient survival in PCa.
Several other genes have been shown to be targeted by miR-199a-5p [20-22, 52, 54, 58, 59]. Ets-1, V-ets erythroblastosis virus E26 oncogene homolog 1, is suppressed by miR-199a-5p, the loss of which may promote breast cancer cell invasion [59]. Inhibition of pro-cell proliferation gene CAC1 by miR-199a-5p reduces colorectal cancer cell growth and multidrug resistance [20]. DDR1, a collagen tyrosine kinase, is downregulated by miR-199a-5p, which decreases multiple myeloma cell invasiveness [49]. Nonetheless, it has been reported that miR-199a-5p induces melanoma metastasis and angiogenesis by inhibiting ApoE, an inhibitor of metastasis and angiogenesis, through interaction at distinct ApoE receptors [22]. These results indicate complex and tissue-specific regulatory differences of miR-199a-5p.
Little is known regarding the molecular mechanisms responsible for miR-199a-5p downregulation in PCa. It has been reported that the transcription factors TWIST1 and EGR1 as well as the methylation status of miR-199a promoters may be involved [60-62]. Activation of the AKT pathway, which is associated with PCa progression, can also downregulate miR-199a-5p [49, 63]. It is also intriguing that double-negative feedback loops exist between miR-199a-5p and its targets: miR-199a-5p targets and reduces expression of the Brm subunit of SWI/SNF, which negatively regulates Egr1 (a positive regulator of miR-199a-2, the precursor gene of miR-199a-5p) [61]. Clearly, further studies regarding the regulation of miR-199a-5p expression are needed.
In summary, we report that miR-199a-5p plays a tumor-suppressive role by directly targeting HIF-1α and thereby suppresses genes downstream of HIF-1α, such as VEGF, CXCR4, BNIP3 and BCL-xL. These data provide evidence for an additional dimension of the already rather complex regulation of HIF-1α in PCa, which may help in the development of miR-199a-5p-based strategies for treating this disease.
MATERIALS AND METHODS
Cell lines and general reagents
Human PCa cell lines PC-3, DU145, LNCaP and CL1 were obtained from American Type Culture Collection and maintained in RPMI 1640 medium (61870044; GIBCO, Rockville, MD) supplemented with 10% fetal calf serum (FCS, 1009-141; GIBCO, Rockville, MD). The adenovirus-immortalized human embryonic kidney epithelial cell line HEK-293 was maintained in Dulbecco’s Modified Eagle Medium (DMEM, 10566016; GIBCO, Rockville, MD) with 10% FCS. Tris base, Tween 20, dithiothreitol (DTT), and ethylenediaminetetraacetic acid (EDTA) were purchased from Amresco (Solon, OH). Phenylmethylsulfonyl fluoride, leupepstatin, and aprotinin were purchased from Roche Diagnostics (Mannheim, Germany).
Tissue samples and clinical data
203 archived, formalin-fixed, paraffin- embedded samples, including 134 prostate adeno-carcinomas (121 needle biopsies, 13 transurethral resections of prostate samples) and 69 benign prostate tissues (all from needle biopsies), were used. In addition, 6 snap-frozen fresh tissue samples (2 cancerous, 2 benign prostate hyperplasia and 2 normal) obtained from prostatectomy specimens were included. All tissue samples were obtained from West China Hospital and were collected and used according to the ethical guidelines and procedures approved by the institutional supervisory committee. Exclusion criteria for the prostate adenocarcinoma group were the presence of another cancer or previous treatment (surgery, endocrine therapy or chemo-radiotherapy). The Gleason scores (GS) of the prostate adenocarcinomas were as follows: GS6 (8 cases, 6%); GS7 (38 cases, 28%); and GS8-10 (88 cases, 66%). The tumor-node-metastasis (TNM) stages were as follows: stage II, 10 cases (7%); stage III, 79 cases (59%); and stage IV, 45 cases (34%). This cohort of patients ranged in age from 53 to 86 years (mean, 69.2) and was treated by combined androgen blockade (surgical castration plus flutamide). Patients were followed by clinical and laboratory monitoring on a regular basis starting at definitive diagnosis. The disease-specific survival (DSS)time was defined as the time from definitive diagnosis to disease-specific death, and the progression-free survival (PFS) time was defined as the time from definitive diagnosis to any of the following events after initial treatment: prostate-specific antigen failure, local progression, metastasis, or disease-specific death.
Stem-loop reverse transcription, conventional reverse transcription-PCR, and genomic DNA PCR
Total RNA was extracted using Trizol reagent (15596018; Invitrogen, Carlsbad, CA). The stem-loop reverse transcription-polymerase chain reaction (RT-PCR) technique was used to examine mature miR-199a-5p. The sequence of the stem-loop RT primer was 5’-GTCGTATCCAGTGCAGGGTCCGAGGTATTCGCACTGGATACG ACGAACACAGA-3’. RT-PCR was performed in a 20-μl volume containing 2.5 μg total RNA, 1.6 mmol/l miR-199a stem-loop primer, 2 μl 10 mmol/l deoxynucleotide triphosphates, 1 μl 0.1 mol/L DTT, and 1 μl M-MLV reverse transcriptase (2641Q; Takara, Dalian, China) at 16°C for 30 min, 42°C for 30 min, and 85°C for 5 min. The sequence of the PCR primers for mature miR-199a-5p were as follows: sense, 5’-GCATAGCCCGCCCAGTGTT-3’; antisense, 5’-GTGCAGGGTCCGAGGT-3’ (product length, 67 bp).
The random RT primer 5’-(dN)9-3’(D6045; Takara, Dalian, China) was used for other genes, the PCR primers of which were designed according to their respective cDNA sequences (GenBank), as follows: HIF-1α, 5’-CCTATGACCTGCTTGGTGCTG-3’ and 5’-CTGGCTCATATCCCATCAATTCG-3’, 157 bp; Actin, 5’-TGGAGAAATCTGGCACCAC-3’ and 5’-GAGGCGTACAGGGATAGCAC-3’, 190 bp; U6, 5’-TGGAACGATACAGAGAAGATTAGCA-3’ and 5’-AACGCTTCACGAATTTGCGT-3’, 66 bp; BNIP3, 5’-ACCAACAGGGCTTCTGAAAC-3’ and 5’-GAGGGTGGCCGTGCGC-3’, 159 bp; BCL-xL, 5’-CTGTGCGTGGAAAGCGTAG-3’ and 5’-CTCG GCTGCTGCATTGTTC-3’, 159 bp; Survivin, 5’-GCAG TTTGAAGAATTAACCCTTG-3’ and 5’-CACTTTCT CCGCAGTTTCCTC-3’ 121 bp; VEGF, 5’-AGGAGGG CAGAATCATCACG-3’ and 5’-GCACACAGGATGGCT TGAAGA-3’, 140 bp; CXCR4, 5’-ACTACACCGAGGAA ATGGGCT-3’ and 5’-CCCACAATGCCAGTT AAGAAGA-3’, 133 bp; GAPDH, 5’-CCACCCATGGCAA ATTCCATGGCA-3’ and 5’-TCAAGACGGCAGG TCAGGTCCACC-3’, 597 bp. Standard PCR protocols were used. Products were resolved by 2% agarose gel electrophoresis or 10% polyacrylamide gel electrophoresis (PAGE) and visualized by staining with the fluorescent dye Goldview (HGV-II; SBS, Beijing, China). Images were captured using a Bio-Rad Gel Doc XR (Bio-Rad, Berkeley, CA). Semiquantitative analysis was performed using ImageQuant 5.2 software (Molecular Dynamics, WA).
The HIF-1α 3’-UTR was amplified and sequenced using the following primers: 5’-TCTAGACTCGAGTACAAGGCAGCAGAAAC-3’ and 5’-TCTAGAGTTTGTGCAGTATTGTAGCC-3’ (187 bp).
Real-time quantitative PCR
Real-time quantitative PCR (Q-PCR) was used together with stem-loop RT to quantitate mature miR-199a-5p. Q-PCR was performed with Light Cycler software 4.05 (Roche Diagnostics, Mannheim, Germany), as described. The β-actin gene was used as a control. The copy number of target genes (relative to β-actin) was determined using the 2−ΔΔCt method: ΔΔCt=ΔCtexp−ΔCtcon=(Ctexp-target−Ctexp-actin)−(Ctcon-target−Ctcon-actin), where ‘exp’ represents the experimental group, ‘con’ the control group, and ‘target’ the gene of interest.
Locked nucleic acid (LNA) in situ hybridization
A digoxigenin-labeled, LNA-modified miR-199a probe (20 nmol/L; 5’-CAACAGGTAGTCTGAACACTGG G-3’, Invitrogen) was incubated at 53°C for 18 h; an LNA probe for U6 (5’-CACGAATTTGCGTGTCATCCTT-3’) was used as a control (hybridization temperature at 50°C). The detailed procedure was described previously [16].
The locked nucleic acid in situ hybridization (LNA-ISH) signal intensity was recorded semiquantitatively, with 0 indicating no signal and 1, 2 and 3 indicating weak, moderate, and strong signals, respectively. The extent of LNA-ISH signal was defined as the percentage of cells showing signal and recorded as 0 (0%), 1 (1-30%), and 2 (>30%). An integrated score of LNA-ISH signal (obtained by the product of the intensity score and extent score) of 4 or more was designated as miR-199a-5p positive.
Western blotting
Primary antibodies against the following were used: HIF-1α (mouse monoclonal, 1:1 500, MAB5382; Chemicon Inc, Billerica, MD); BNIP3 (mouse monoclonal, 1:3000, B7931; Sigma, St. Louis, MI); BCL-xL (rabbit polyclonal, SAB3500349; 1:1000, Sigma, St. Louis, MI); VEGF (rabbit polyclonal, 1:500, PB0084; Boster, Wuhan, China); GAPDH (mouse monoclonal, 1:10000, KC-5G4; KangCheng, Shanghai, China); and β-tubulin (mouse monoclonal, 1:1000, A06868; Boster, Wuhan, China). Horseradish peroxidase-labeled secondary antibodies were obtained from Zymed Laboratories Inc (San Francisco, CA). Western blot assays were performed as previously described [16].
Immunohistochemistry
An anti-HIF-1α antibody used for immuno-histochemistry (mouse monoclonal, 1:200, MAB5382; Chemicon, Billerica, MD). Immunostaining was performed as previously described [11]. The percentage of cells with positive nuclear (HIF-N) or cytoplasmic (HIF-C) immunostaining was examined by light microscopy following a protocol we previously described [64]. The cut-off values for HIF-N and HIF-C were 3% and score 2, respectively, as based on preliminary assays.
Recombinant adenoviral vectors for overexpression of miR-199a-5p
The pri-miR-199a (total sequence 422 bp) was amplified from HEK-293 cell genomic DNA with the indicated primers. The PCR product was cloned into pMD18-T (6011; TaKaRa, Dalian, China), verified by sequencing, and subcloned into the shuttle plasmid pAdTrack-CMV (designated pAdTrack-miR-199a). pAdTrack-miR-199a was linearized with PmeI and used to transform BJ5183-AD-1 cells harboring adenoviral pAdeasy-1 vectors (VXS0387; Stratagene, La Jolla, CA) for homologous recombination. Colonies were screened by plasmid miniprep and PacI restriction analysis to obtain clones with recombinant miR-199a (designated as AD-miR-199a). AD-miR-199a was amplified by repeated infection and verified by PCR. The pAdTrack-CMV empty vector was used as a control (designated as AD-Control). Titers and multiplicity of infection (MOI) values were determined according to the manufacturer’s protocols.
Cell viability assay
Cells were collected and stained with trypan blue (200 mg/ml, T6146; Sigma, St. Louis, MO). The number of viable cells was determined by microscopic examination.
MTT [3-(4,5-dimethylthiazol-2-yl)-2,5-diphenyl-tetrazolium bromide] assay
PC-3 and DU145 cells were incubated overnight in a 96-well plate (1×10⁴ cells/ml) and then treated with AD-miR-199a. Cells incubated with AD-Control served as the control group. Cell viability was evaluated at 24 h, 48 h, and 72 h of incubation using the MTT (298-93-1; Amresco, Solon, OH) assay. The MTT assays were performed using a standard protocol, and the optical density was measured at 570 nm using a spectrophotometer. The background wavelength of MTT is 630 nm.
Terminal deoxynucleotidyltransferase-mediated biotinylated dUTP nick-end labeling
Terminal deoxynucleotidyltransferase-mediated dUTP nick-end labeling (TUNEL) was performed using an in situ cell death detection kit (11 684 817 910; Roche Diagnostic, Mannheim, Germany), as previously described [11].
Transwell invasion assay
AD-miR-199a- or AD-Control-infected PC-3 and DU145 cells (1.0×10⁵ cells) were seeded in Matrigel-coated chambers with 8-μm pores (PIEP12R48; Millipore, Billerica, MA). Cells were suspended in serum-free medium and allowed to migrate toward a complete medium supplemented with 10% fetal bovine serum for 36 h. Non-invading cells were physically removed by scraping, and invading cells were stained with 0.1% crystal violet solution and counted under a light microscope.
Luciferase reporter constructs and site-directed mutagenesis
The seed sequence of the HIF-1α 3’-UTR (31-37 nt) and flanking sequences were amplified from PC-3 cell genomic DNA. UTR-wt (-65 bp to +113 bp, with +1 being the first base after the stop codon) was prepared with the primers HIF-1α-XbaI-FP (5’-TCTAGACTCGAGTACAAGGCAGCAGAAAC-3’) and HIF-1α-XbaI-RP (5’-TCTAGAGTTTGTGCAGTATTGTAGCC-3’). The PCR products were cloned into pMD18-T and subcloned into pGL3-Promoter (E1761; Promega, Madison, WI); the product was designated pGL3-HIF-3’UTR. Overlapping PCR was used for site-directed mutagenesis of the seed sequence (from ACACTGG to CAGATCT, designated pGL3-mut HIF). The PCR primers were HIF-UTR-MUT-FP (5’-GGCAGATCTTGGCTCACTACC-3’) and HIF-UTR-MUT-RP (5’-CAAGATCTGCCAAAAAAAGGAATG-3’).
Dual reporter gene assay
PC-3 cells were cultured in 24-well plates and transfected with 0.4 μg of the reporter constructs using Lipofectamine 2000 (11668019; Invitrogen, Carlsbad, CA). The pRL-CMV plasmid (E2261; Promega, Madison, WI) containing the Renilla luciferase gene (0.02 μg) was cotransfected as an internal control. Cells were infected with AD-miR-199a or AD-Control (MOI 100) at 4 h after transfection and collected 24 h later. Firefly and Renilla luciferase activities were assessed using a Luminometer TD-20/20 (Turner Design, Sunnyvale, CA).
Tubule-formation assay to measure in vitro angiogenesis of vascular endothelial cells
Culture plates (48-well) were coated with 100 μl of Matrigel (356234; BD, San Jose, CA) per well and incubated at 37°C for 1 h or until the gel solidified. A total of 5×10⁴ human umbilical vein endothelial cells (HUVECs) were then seeded in each coated well and incubated with a tumor conditioned medium. The tumor conditioned medium was collected from cultures of PC-3 or DU145 cells that had been infected with AD-miR-199a or AD-Control for 48 h. After incubation at 37°C for 2, 4, 6, 8, 12, or 24 h, the HUVEC cells were examined for capillary-like network formation and imaged under a light microscope for each time point. Images were captured from 5 different fields in each well. Tubule formation was quantified by measuring the total tubule length and total number of branch points in triplicate wells using Image Pro Plus 6.0 (Media Cybernetics, Rochville, MD) software according to a published protocol [65].
Statistical analyses
The SPSS 10 program was used for general statistical and survival analyses. Fisher’s exact test was used for between-group comparison, and Spearman rank order correlation was used for correlation analysis. The Kaplan-Meier method with the log-rank test was used for univariate survival analysis.
Abbreviations
BCL2-xL: BCL2 Like 1, BNIP3: BCL2/Adenovirus E1B 19kD Interacting Protein 3, BPH: benign prostate hyperplasia, CXCR4: C-X-C chemokine receptor type 4, HIF-1α: hypoxia-inducible factor-1α, miRNA: microRNA, PCa: prostate adenocarcinoma, VEGF: vascular endothelial growth factor.
Author contributions
Xueqin Chen and Qiao Zhou designed the project and revised the manuscript. Xueqin Chen and Jinjing Zhong collected and analyzed data and prepared the manuscript. All authors contributed to data collection and writing of the manuscript.
CONFLICTS OF INTEREST
No conflicts of benefits declared.
FUNDING
The authors are supported by grants from the National Science Foundation of China (NSFC 81572540, 81572541, 81272820, 81272848, 81302225 and 81402110).
REFERENCES
1. Siegel RL, Miller KD, Jemal A. Cancer statistics, 2015. CA Cancer J Clin. 2015; 65:5–29. https://doi.org/10.3322/caac.21254.
2. Zhang L, Wu S, Guo LR, Zhao XJ. Diagnostic strategies and the incidence of prostate cancer: reasons for the low reported incidence of prostate cancer in China. Asian J Androl. 2009; 11:9–13. https://doi.org/10.1038/aja.2008.21.
3. Zhang L, Yang BX, Zhang HT, Wang JG, Wang HL, Zhao XJ. Prostate cancer: an emerging threat to the health of aging men in Asia. Asian J Androl. 2011; 13:574–78. https://doi.org/10.1038/aja.2010.126.
4. Zhang W, Meng Y, Liu N, Wen XF, Yang T. Insights into Chemoresistance of Prostate Cancer. Int J Biol Sci. 2015; 11:1160–70. https://doi.org/10.7150/ijbs.11439.
5. Heidenreich A, Bastian PJ, Bellmunt J, Bolla M, Joniau S, van der Kwast T, Mason M, Matveev V, Wiegel T, Zattoni F, Mottet N, and European Association of Urology. EAU guidelines on prostate cancer. Part II: treatment of advanced, relapsing, and castration-resistant prostate cancer. Eur Urol. 2014; 65:467–79. https://doi.org/10.1016/j.eururo.2013.11.002.
6. Talks KL, Turley H, Gatter KC, Maxwell PH, Pugh CW, Ratcliffe PJ, Harris AL. The expression and distribution of the hypoxia-inducible factors HIF-1alpha and HIF-2alpha in normal human tissues, cancers, and tumor-associated macrophages. Am J Pathol. 2000; 157:411–21. https://doi.org/10.1016/S0002-9440(10)64554-3.
7. Zhong H, De Marzo AM, Laughner E, Lim M, Hilton DA, Zagzag D, Buechler P, Isaacs WB, Semenza GL, Simons JW. Overexpression of hypoxia-inducible factor 1alpha in common human cancers and their metastases. Cancer Res. 1999; 59:5830–35.
8. Semenza GL. Targeting HIF-1 for cancer therapy. Nat Rev Cancer. 2003; 3:721–32. https://doi.org/10.1038/nrc1187.
9. Semenza GL. HIF-1 and tumor progression: pathophysiology and therapeutics. Trends Mol Med. 2002; 8:S62–67. https://doi.org/10.1016/S1471-4914(02)02317-1.
10. Lee JW, Bae SH, Jeong JW, Kim SH, Kim KW. Hypoxia-inducible factor (HIF-1)alpha: its protein stability and biological functions. Exp Mol Med. 2004; 36:1–12. https://doi.org/10.1038/emm.2004.1.
11. Chen N, Chen X, Huang R, Zeng H, Gong J, Meng W, Lu Y, Zhao F, Wang L, Zhou Q. BCL-xL is a target gene regulated by hypoxia-inducible factor-1{alpha}. J Biol Chem. 2009; 284:10004–12. https://doi.org/10.1074/jbc.M805997200.
12. Luczak MW, Roszak A, Pawlik P, Kędzia H, Kędzia W, Malkowska-Walczak B, Lianeri M, Jagodziński PP. Transcriptional analysis of CXCR4, DNMT3A, DNMT3B and DNMT1 gene expression in primary advanced uterine cervical carcinoma. Int J Oncol. 2012; 40:860–66. https://doi.org/10.3892/ijo.2011.1183.
13. Ling H, Fabbri M, Calin GA. MicroRNAs and other non-coding RNAs as targets for anticancer drug development. Nat Rev Drug Discov. 2013; 12:847–65. https://doi.org/10.1038/nrd4140.
14. Casanova-Salas I, Rubio-Briones J, Calatrava A, Mancarella C, Masiá E, Casanova J, Fernández-Serra A, Rubio L, Ramírez-Backhaus M, Armiñán A, Domínguez-Escrig J, Martínez F, García-Casado Z, et al. Identification of miR-187 and miR-182 as biomarkers of early diagnosis and prognosis in patients with prostate cancer treated with radical prostatectomy. J Urol. 2014; 192:252–59. https://doi.org/10.1016/j.juro.2014.01.107.
15. Haflidadóttir BS, Larne O, Martin M, Persson M, Edsjö A, Bjartell A, Ceder Y. Upregulation of miR-96 enhances cellular proliferation of prostate cancer cells through FOXO1. PLoS One. 2013; 8:e72400. https://doi.org/10.1371/journal.pone.0072400.
16. Chen X, Gong J, Zeng H, Chen N, Huang R, Huang Y, Nie L, Xu M, Xia J, Zhao F, Meng W, Zhou Q. MicroRNA145 targets BNIP3 and suppresses prostate cancer progression. Cancer Res. 2010; 70:2728–38. https://doi.org/10.1158/0008-5472.CAN-09-3718.
17. Shang W, Chen X, Nie L, Xu M, Chen N, Zeng H, Zhou Q. MiR199b suppresses expression of hypoxia-inducible factor 1α (HIF-1α) in prostate cancer cells. Int J Mol Sci. 2013; 14:8422–36. https://doi.org/10.3390/ijms14048422.
18. Su W, Xu M, Chen X, Nie L, Chen N, Gong J, Zhang M, Su Z, Huang L, Zhou Q. MiR200c targets IRS1 and suppresses prostate cancer cell growth. Prostate. 2015; 75:855–62. https://doi.org/10.1002/pros.22968.
19. Cheung HH, Davis AJ, Lee TL, Pang AL, Nagrani S, Rennert OM, Chan WY. Methylation of an intronic region regulates miR-199a in testicular tumor malignancy. Oncogene. 2011; 30:3404–15. https://doi.org/10.1038/onc.2011.60.
20. Kong Y, Bai PS, Sun H, Nan KJ, Chen NZ, Qi XG. The deoxycholic acid targets miRNA-dependent CAC1 gene expression in multidrug resistance of human colorectal cancer. Int J Biochem Cell Biol. 2012; 44:2321–32. https://doi.org/10.1016/j.biocel.2012.08.006.
21. Wang W, Zhao LJ, Tan YX, Ren H, Qi ZT. Identification of deregulated miRNAs and their targets in hepatitis B virus-associated hepatocellular carcinoma. World J Gastroenterol. 2012; 18:5442–53. https://doi.org/10.3748/wjg.v18.i38.5442.
22. Pencheva N, Tran H, Buss C, Huh D, Drobnjak M, Busam K, Tavazoie SF. Convergent multi-miRNA targeting of ApoE drives LRP1/LRP8-dependent melanoma metastasis and angiogenesis. Cell. 2012; 151:1068–82. https://doi.org/10.1016/j.cell.2012.10.028.
23. Ueda T, Volinia S, Okumura H, Shimizu M, Taccioli C, Rossi S, Alder H, Liu CG, Oue N, Yasui W, Yoshida K, Sasaki H, Nomura S, et al. Relation between microRNA expression and progression and prognosis of gastric cancer: a microRNA expression analysis. Lancet Oncol. 2010; 11:136–46. https://doi.org/10.1016/S1470-2045(09)70343-2.
24. Bloomston M, Frankel WL, Petrocca F, Volinia S, Alder H, Hagan JP, Liu CG, Bhatt D, Taccioli C, Croce CM. MicroRNA expression patterns to differentiate pancreatic adenocarcinoma from normal pancreas and chronic pancreatitis. JAMA. 2007; 297:1901–08. https://doi.org/10.1001/jama.297.17.1901.
25. Porkka KP, Pfeiffer MJ, Waltering KK, Vessella RL, Tammela TL, Visakorpi T. MicroRNA expression profiling in prostate cancer. Cancer Res. 2007; 67:6130–35. https://doi.org/10.1158/0008-5472.CAN-07-0533.
26. Jochmanová I, Yang C, Zhuang Z, Pacak K. Hypoxia-inducible factor signaling in pheochromocytoma: turning the rudder in the right direction. J Natl Cancer Inst. 2013; 105:1270–83. https://doi.org/10.1093/jnci/djt201.
27. Philip B, Ito K, Moreno-Sánchez R, Ralph SJ. HIF expression and the role of hypoxic microenvironments within primary tumours as protective sites driving cancer stem cell renewal and metastatic progression. Carcinogenesis. 2013; 34:1699–707. https://doi.org/10.1093/carcin/bgt209.
28. Raja R, Kale S, Thorat D, Soundararajan G, Lohite K, Mane A, Karnik S, Kundu GC. Hypoxia-driven osteopontin contributes to breast tumor growth through modulation of HIF1α-mediated VEGF-dependent angiogenesis. Oncogene. 2014; 33:2053–64. https://doi.org/10.1038/onc.2013.171.
29. Zecchini V, Madhu B, Russell R, Pértega-Gomes N, Warren A, Gaude E, Borlido J, Stark R, Ireland-Zecchini H, Rao R, Scott H, Boren J, Massie C, et al. Nuclear ARRB1 induces pseudohypoxia and cellular metabolism reprogramming in prostate cancer. EMBO J. 2014; 33:1365–82. https://doi.org/10.15252/embj.201386874.
30. Hartl DM, Mamelle E, Borget I, Leboulleux S, Mirghani H, Schlumberger M. Influence of prophylactic neck dissection on rate of retreatment for papillary thyroid carcinoma. World J Surg. 2013; 37:1951–58. https://doi.org/10.1007/s00268-013-2089-3.
31. Zhong H, Semenza GL, Simons JW, De Marzo AM. Up-regulation of hypoxia-inducible factor 1alpha is an early event in prostate carcinogenesis. Cancer Detect Prev. 2004; 28:88–93. https://doi.org/10.1016/j.cdp.2003.12.009.
32. Zhong H, Agani F, Baccala AA, Laughner E, Rioseco-Camacho N, Isaacs WB, Simons JW, Semenza GL. Increased expression of hypoxia inducible factor-1alpha in rat and human prostate cancer. Cancer Res. 1998; 58:5280–84.
33. Sharp FR, Bernaudin M. HIF1 and oxygen sensing in the brain. Nat Rev Neurosci. 2004; 5:437–48. https://doi.org/10.1038/nrn1408.
34. Shaida N, Launchbury R, Boddy JL, Jones C, Campo L, Turley H, Kanga S, Banham AH, Malone PR, Harris AL, Fox SB. Expression of BNIP3 correlates with hypoxia-inducible factor (HIF)-1alpha, HIF-2alpha and the androgen receptor in prostate cancer and is regulated directly by hypoxia but not androgens in cell lines. Prostate. 2008; 68:336–43. https://doi.org/10.1002/pros.20707.
35. Wang TS, Evans DB, Fareau GG, Carroll T, Yen TW. Effect of prophylactic central compartment neck dissection on serum thyroglobulin and recommendations for adjuvant radioactive iodine in patients with differentiated thyroid cancer. Ann Surg Oncol. 2012; 19:4217–22. https://doi.org/10.1245/s10434-012-2594-x.
36. de Wit RH, Mujić-Delić A, van Senten JR, Fraile-Ramos A, Siderius M, Smit MJ. Human cytomegalovirus encoded chemokine receptor US28 activates the HIF-1α/PKM2 axis in glioblastoma cells. Oncotarget. 2016; 7:67966–85. https://doi.org/10.18632/oncotarget.11817.
37. Qi H, Liu C, Long L, Ren Y, Zhang S, Chang X, Qian X, Jia H, Zhao J, Sun J, Hou X, Yuan X, Kang C. Blood Exosomes Endowed with Magnetic and Targeting Properties for Cancer Therapy. ACS Nano. 2016; 10:3323–33. https://doi.org/10.1021/acsnano.5b06939.
38. Gnarra JR, Zhou S, Merrill MJ, Wagner JR, Krumm A, Papavassiliou E, Oldfield EH, Klausner RD, Linehan WM. Post-transcriptional regulation of vascular endothelial growth factor mRNA by the product of the VHL tumor suppressor gene. Proc Natl Acad Sci USA. 1996; 93:10589–94. https://doi.org/10.1073/pnas.93.20.10589.
39. Agani F, Jiang BH. Oxygen-independent regulation of HIF-1: novel involvement of PI3K/AKT/mTOR pathway in cancer. Curr Cancer Drug Targets. 2013; 13:245–51. https://doi.org/10.2174/1568009611313030003.
40. Belaiba RS, Bonello S, Zähringer C, Schmidt S, Hess J, Kietzmann T, Görlach A. Hypoxia up-regulates hypoxia-inducible factor-1alpha transcription by involving phosphatidylinositol 3-kinase and nuclear factor kappaB in pulmonary artery smooth muscle cells. Mol Biol Cell. 2007; 18:4691–97. https://doi.org/10.1091/mbc.E07-04-0391.
41. Dong SY, Guo YJ, Feng Y, Cui XX, Kuo SH, Liu T, Wu YC. The epigenetic regulation of HIF-1α by SIRT1 in MPP(+) treated SH-SY5Y cells. Biochem Biophys Res Commun. 2016; 470:453–59. https://doi.org/10.1016/j.bbrc.2016.01.013.
42. Wang TH, Yu CC, Lin YS, Chen TC, Yeh CT, Liang KH, Shieh TM, Chen CY, Hsueh C. Long noncoding RNA CPS1-IT1 suppresses the metastasis of hepatocellular carcinoma by regulating HIF-1α activity and inhibiting epithelial-mesenchymal transition. Oncotarget. 2016; 7:43588–603. https://doi.org/10.18632/oncotarget.9635.
43. Lin A, Li C, Xing Z, Hu Q, Liang K, Han L, Wang C, Hawke DH, Wang S, Zhang Y, Wei Y, Ma G, Park PK, et al. The LINK-A lncRNA activates normoxic HIF1α signalling in triple-negative breast cancer. Nat Cell Biol. 2016; 18:213–24. https://doi.org/10.1038/ncb3295.
44. Kelly TJ, Souza AL, Clish CB, Puigserver P. A hypoxia-induced positive feedback loop promotes hypoxia-inducible factor 1alpha stability through miR-210 suppression of glycerol-3-phosphate dehydrogenase 1-like. Mol Cell Biol. 2011; 31:2696–706. https://doi.org/10.1128/MCB.01242-10.
45. Ghosh G, Subramanian IV, Adhikari N, Zhang X, Joshi HP, Basi D, Chandrashekhar YS, Hall JL, Roy S, Zeng Y, Ramakrishnan S. Hypoxia-induced microRNA-424 expression in human endothelial cells regulates HIF-α isoforms and promotes angiogenesis. J Clin Invest. 2010; 120:4141–54. https://doi.org/10.1172/JCI42980.
46. Lei Z, Li B, Yang Z, Fang H, Zhang GM, Feng ZH, Huang B. Regulation of HIF-1alpha and VEGF by miR-20b tunes tumor cells to adapt to the alteration of oxygen concentration. PLoS One. 2009; 4:e7629. https://doi.org/10.1371/journal.pone.0007629.
47. Taguchi A, Yanagisawa K, Tanaka M, Cao K, Matsuyama Y, Goto H, Takahashi T. Identification of hypoxia-inducible factor-1 alpha as a novel target for miR-17-92 microRNA cluster. Cancer Res. 2008; 68:5540–45. https://doi.org/10.1158/0008-5472.CAN-07-6460.
48. Rane S, He M, Sayed D, Vashistha H, Malhotra A, Sadoshima J, Vatner DE, Vatner SF, Abdellatif M. Downregulation of miR-199a derepresses hypoxia-inducible factor-1alpha and Sirtuin 1 and recapitulates hypoxia preconditioning in cardiac myocytes. Circ Res. 2009; 104:879–86. https://doi.org/10.1161/CIRCRESAHA.108.193102.
49. Raimondi L, Amodio N, Di Martino MT, Altomare E, Leotta M, Caracciolo D, Gullà A, Neri A, Taverna S, D’Aquila P, Alessandro R, Giordano A, Tagliaferri P, Tassone P. Targeting of multiple myeloma-related angiogenesis by miR-199a-5p mimics: in vitro and in vivo anti-tumor activity. Oncotarget. 2014; 5:3039–54. https://doi.org/10.18632/oncotarget.1747.
50. Yang X, Lei S, Long J, Liu X, Wu Q. MicroRNA-199a-5p inhibits tumor proliferation in melanoma by mediating HIF-1α. Mol Med Rep. 2016; 13:5241–47. https://doi.org/10.3892/mmr.2016.5202.
51. Keßler J, Rot S, Bache M, Kappler M, Würl P, Vordermark D, Taubert H, Greither T. miR-199a-5p regulates HIF-1α and OSGIN2 and its expression is correlated to soft-tissue sarcoma patients’ outcome. Oncol Lett. 2016; 12:5281–88. https://doi.org/10.3892/ol.2016.5320.
52. Su SF, Chang YW, Andreu-Vieyra C, Fang JY, Yang Z, Han B, Lee AS, Liang G. miR-30d, miR-181a and miR-199a-5p cooperatively suppress the endoplasmic reticulum chaperone and signaling regulator GRP78 in cancer. Oncogene. 2013; 32:4694–701. https://doi.org/10.1038/onc.2012.483.
53. Nam EJ, Yoon H, Kim SW, Kim H, Kim YT, Kim JH, Kim JW, Kim S. MicroRNA expression profiles in serous ovarian carcinoma. Clin Cancer Res. 2008; 14:2690–2695. https://doi.org/10.1158/1078-0432.CCR-07-1731.
54. Shen Q, Cicinnati VR, Zhang X, Iacob S, Weber F, Sotiropoulos GC, Radtke A, Lu M, Paul A, Gerken G, Beckebaum S. Role of microRNA-199a-5p and discoidin domain receptor 1 in human hepatocellular carcinoma invasion. Mol Cancer. 2010; 9:227. https://doi.org/10.1186/1476-4598-9-227.
55. Chen R, Alvero AB, Silasi DA, Kelly MG, Fest S, Visintin I, Leiser A, Schwartz PE, Rutherford T, Mor G. Regulation of IKKbeta by miR-199a affects NF-kappaB activity in ovarian cancer cells. Oncogene. 2008; 27:4712–23. https://doi.org/10.1038/onc.2008.112.
56. Yin G, Chen R, Alvero AB, Fu HH, Holmberg J, Glackin C, Rutherford T, Mor G. TWISTing stemness, inflammation and proliferation of epithelial ovarian cancer cells through MIR199A2/214. Oncogene. 2010; 29:3545–53. https://doi.org/10.1038/onc.2010.111.
57. Szczyrba J, Löprich E, Wach S, Jung V, Unteregger G, Barth S, Grobholz R, Wieland W, Stöhr R, Hartmann A, Wullich B, Grässer F. The microRNA profile of prostate carcinoma obtained by deep sequencing. Mol Cancer Res. 2010; 8:529–38. https://doi.org/10.1158/1541-7786.MCR-09-0443.
58. Matà R, Palladino C, Nicolosi ML, Lo Presti AR, Malaguarnera R, Ragusa M, Sciortino D, Morrione A, Maggiolini M, Vella V, Belfiore A. IGF-I induces upregulation of DDR1 collagen receptor in breast cancer cells by suppressing MIR-199a-5p through the PI3K/AKT pathway. Oncotarget. 2016; 7:7683–700. https://doi.org/10.18632/oncotarget.6524.
59. Li W, Wang H, Zhang J, Zhai L, Chen W, Zhao C. miR-199a-5p regulates β1 integrin through Ets-1 to suppress invasion in breast cancer. Cancer Sci. 2016; 107:916–23. https://doi.org/10.1111/cas.12952.
60. Lee YB, Bantounas I, Lee DY, Phylactou L, Caldwell MA, Uney JB. Twist-1 regulates the miR-199a/214 cluster during development. Nucleic Acids Res. 2009; 37:123–28. https://doi.org/10.1093/nar/gkn920.
61. Sakurai K, Furukawa C, Haraguchi T, Inada K, Shiogama K, Tagawa T, Fujita S, Ueno Y, Ogata A, Ito M, Tsutsumi Y, Iba H. MicroRNAs miR-199a-5p and -3p target the Brm subunit of SWI/SNF to generate a double-negative feedback loop in a variety of human cancers. Cancer Res. 2011; 71:1680–89. https://doi.org/10.1158/0008-5472.CAN-10-2345.
62. Cheung HH, Lee TL, Davis AJ, Taft DH, Rennert OM, Chan WY. Genome-wide DNA methylation profiling reveals novel epigenetically regulated genes and non-coding RNAs in human testicular cancer. Br J Cancer. 2010; 102:419–27. https://doi.org/10.1038/sj.bjc.6605505.
63. Rane S, He M, Sayed D, Yan L, Vatner D, Abdellatif M. An antagonism between the AKT and beta-adrenergic signaling pathways mediated through their reciprocal effects on miR-199a-5p. Cell Signal. 2010; 22:1054–62. https://doi.org/10.1016/j.cellsig.2010.02.008.
64. Yin W, Chen N, Zhang Y, Zeng H, Chen X, He Y, Wang X, Zhou Q. Survivin nuclear labeling index: a superior biomarker in superficial urothelial carcinoma of human urinary bladder. Mod Pathol. 2006; 19:1487–97. https://doi.org/10.1038/modpathol.3800675.
65. Cao X, Geradts J, Dewhirst MW, Lo HW. Upregulation of VEGF-A and CD24 gene expression by the tGLI1 transcription factor contributes to the aggressive behavior of breast cancer cells. Oncogene. 2012; 31:104–15. https://doi.org/10.1038/onc.2011.219.