
INTRODUCTION
Cancer is still a global public health problem. According to the GLOBOCAN estimates, about 14.1 million new cancer cases and 8.2 million deaths occurred in 2012 worldwide [1]. In China, cancer has become the leading cause of death since 2010, with an estimate of 4292,000 new cancer cases and 2814,000 cancer deaths in 2015 [2]. As a multifactorial disease, it involves both genetic and environmental factors [3]. Accumulating evidence has indicated that inflammation plays a vital role in cancer development [4–6], and approximately 20% of all cancers are associated with chronic inflammation [7].
Interleukin-10 (IL-10) is an anti-inflammatory cytokine with both immunosuppressive and immunostimulatory activities [8]. Although the relationship between IL-10 and cancer has been extensively studied, the exact role of IL-10 in cancer is still elusive, since IL-10 have both cancer-promoting and -inhibiting properties [9, 10]. In view of these properties, we hypothesized that IL-10 gene polymorphisms could influence cancer susceptibility.
The IL-10 gene is located on chromosome 1q31-32, and is composed of five exons and four introns. IL-10 gene promoter region is highly polymorphic, and three promoter single nucleotide polymorphisms (SNPs) such as -1082A/G (rs1800896), -819T/C (rs1800871) and -592A/C (rs1800872) have been reported to regulate IL-10 expression [11, 12] and alter the susceptibility to various types of cancers [13–16]. In the Chinese population, numerous case-control studies were performed to investigate the role of IL-10 -1082A/G, -819T/C and -592A/C polymorphisms in cancer risk. However, the results remain inconclusive. Hence, we performed the present meta-analysis to investigate the association between three polymorphisms in IL-10 gene and cancer susceptibility in the Chinese population.
RESULTS
Study characteristics
As shown in Figure 1, 1,596 published records were initially retrieved from PubMed, Embase, Chinese National Knowledge Infrastructure (CNKI) and Wanfang database, and 14 more articles were identified by checking the references in the retrieved publications. After reviewing of the titles and abstracts, 1,535 articles were excluded, leaving only 75 articles for further assessment. Among them, we excluded one study [17] that was covered by another included publication [18], five case-only studies [19–23], five lacking detailed data for further analysis [24–28], and eleven that were considering the deviation from the Hardy-Weinberg equilibrium (HWE) [29–39]. Ultimately, 53 articles were included in the final meta-analysis. Of these 53 articles, 24 articles [40–63] include 26 studies examining IL-10 -1082A/G polymorphism, 28 articles [18, 42, 43, 45, 47, 49, 52, 53, 57-61, 63-77] include 33 studies examining the -819T/C polymorphism, and 39 articles [18, 42, 43, 45, 47, 52, 53, 56-67, 69, 70, 73-76, 78-91] include 42 studies examining the -592A/C polymorphism (Table 1). Of the 53 articles, two publications [18, 45] with three cancer types were considered as three studies and one publication [65] with two cancer types were also considered as two studies.
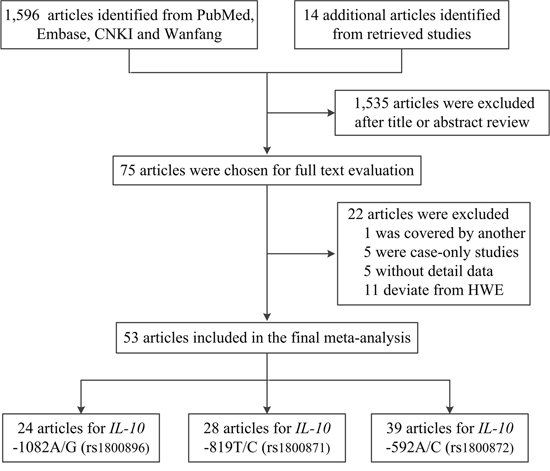
Figure 1: Flow diagram of the study selection process.
Table 1: Characteristics of studies included in the meta-analysis
Surname [ref] |
Year |
Cancer type |
Control source |
Genotype method |
Case |
Control |
MAF |
HWE |
Score |
||||||
|---|---|---|---|---|---|---|---|---|---|---|---|---|---|---|---|
11 |
12 |
22 |
All |
11 |
12 |
22 |
All |
||||||||
-1082A/G polymorphism |
|||||||||||||||
Wu [40] |
2002 |
Gastric |
HB |
Sequencing |
135 |
14 |
1 |
150 |
208 |
11 |
1 |
220 |
0.03 |
0.057 |
6 |
Heneghan [41] a |
2003 |
HCC |
PB |
Probe |
86 |
12 |
0 |
98 |
90 |
7 |
0 |
97 |
0.04 |
0.712 |
10 |
Shih [42]a |
2005 |
Lung |
HB |
PCR-RFLP |
115 |
39 |
0 |
154 |
194 |
11 |
0 |
205 |
0.03 |
0.693 |
8 |
Wei [43] |
2007 |
NPC |
HB |
PCR-RFLP |
123 |
61 |
14 |
198 |
167 |
38 |
5 |
210 |
0.11 |
0.124 |
8 |
Bai [44]b |
2008 |
Gastric |
HB |
PCR-RFLP |
89 |
22 (AG+GG) |
111 |
104 |
7 (AG+GG) |
111 |
NA |
NA |
7 |
||
Hsing [45] |
2008 |
Gallbladder |
PB |
Taqman |
231 |
23 |
1 |
255 |
624 |
99 |
7 |
730 |
0.08 |
0.173 |
12 |
Hsing [45] a |
2008 |
EHBD |
PB |
Taqman |
107 |
18 |
0 |
125 |
664 |
108 |
7 |
779 |
0.08 |
0.270 |
12 |
Hsing [45]a |
2008 |
AV |
PB |
Taqman |
38 |
9 |
0 |
47 |
664 |
108 |
7 |
779 |
0.08 |
0.270 |
12 |
Hao [46] b |
2009 |
Lung |
PB |
Taqman |
36 |
7 (AG+GG) |
43 |
46 |
6 (AG+GG) |
52 |
NA |
NA |
7 |
||
Xiao [47] a |
2009 |
Gastric |
HB |
PCR-RFLP |
176 |
41 |
3 |
220 |
593 |
31 |
0 |
624 |
0.03 |
0.525 |
9 |
Kong [48] |
2010 |
Breast |
HB |
PCR-RFLP |
285 |
29 |
1 |
315 |
285 |
35 |
2 |
322 |
0.06 |
0.422 |
9 |
Liu [49] |
2010 |
HCC |
HB |
Taqman |
131 |
35 |
4 |
170 |
160 |
24 |
3 |
187 |
0.08 |
0.075 |
5 |
Niu [50] b |
2011 |
Prostate |
PB |
Sequencing |
24 |
74 (AG+GG) |
98 |
42 |
46 (AG+GG) |
88 |
NA |
NA |
9 |
||
Wang [51] |
2011 |
Cervical |
PB |
PCR-SSP |
77 |
85 |
24 |
186 |
103 |
76 |
21 |
200 |
0.30 |
0.222 |
8 |
He [52] a |
2012 |
Gastric |
HB |
PCR-RFLP |
154 |
42 |
0 |
196 |
194 |
54 |
0 |
248 |
0.11 |
0.055 |
9 |
Chang [53] a |
2013 |
HN |
HB |
Taqman |
289 |
23 |
1 |
313 |
268 |
27 |
0 |
295 |
0.05 |
0.410 |
10 |
Chen [54] |
2013 |
Bladder |
HB |
AS-PCR |
374 |
25 |
1 |
400 |
350 |
48 |
2 |
400 |
0.07 |
0.799 |
10 |
Du [55] |
2013 |
Esophageal |
HB |
PCR |
95 |
20 |
3 |
118 |
103 |
15 |
1 |
119 |
0.07 |
0.587 |
8 |
Pan [56] |
2013 |
Gastric |
HB |
MassARRAY |
263 |
41 |
4 |
308 |
264 |
41 |
3 |
308 |
0.08 |
0.329 |
9 |
Cheng [57] a |
2015 |
NTCL |
HB |
PCR-LDR |
101 |
24 |
0 |
125 |
237 |
60 |
3 |
300 |
0.11 |
0.710 |
10 |
Fei [58] |
2015 |
AML |
HB |
PCR-RFLP |
75 |
70 |
22 |
167 |
159 |
134 |
35 |
328 |
0.31 |
0.398 |
8 |
Hsu [59] a |
2015 |
Oral |
HB |
PCR-SSP |
130 |
14 |
1 |
145 |
96 |
16 |
0 |
112 |
0.07 |
0.416 |
7 |
Yang [60] |
2015 |
Esophageal |
HB |
MassARRAY |
41 |
106 |
99 |
246 |
46 |
204 |
242 |
492 |
0.30 |
0.751 |
9 |
Bai [61] |
2016 |
Cervical |
HB |
PCR-RFLP |
74 |
75 |
16 |
165 |
80 |
72 |
13 |
165 |
0.30 |
0.563 |
8 |
Cai [62] a |
2016 |
Colorectal |
HB |
MassARRAY |
323 |
50 |
2 |
375 |
343 |
39 |
0 |
382 |
0.05 |
0.293 |
9 |
Peng [63] |
2016 |
HCC |
PB |
PCR-RFLP |
83 |
74 |
16 |
173 |
96 |
74 |
12 |
182 |
0.27 |
0.653 |
10 |
-819T/C polymorphism |
|||||||||||||||
Wu [64] |
2003 |
Gastric |
HB |
Sequencing |
88 |
105 |
27 |
220 |
127 |
83 |
20 |
230 |
0.27 |
0.231 |
9 |
Savage [65] |
2004 |
Gastric |
PB |
SBE |
37 |
38 |
9 |
84 |
170 |
163 |
49 |
382 |
0.34 |
0.315 |
11 |
Savage [65] |
2004 |
Esophageal |
PB |
SBE |
53 |
46 |
17 |
116 |
170 |
163 |
49 |
382 |
0.34 |
0.315 |
12 |
Shih [42] |
2005 |
Lung |
HB |
PCR-RFLP |
66 |
58 |
30 |
154 |
104 |
86 |
15 |
205 |
0.28 |
0.627 |
8 |
Wei [43] |
2007 |
NPC |
HB |
PCR-RFLP |
82 |
81 |
35 |
198 |
94 |
92 |
24 |
210 |
0.33 |
0.836 |
8 |
Hsing [45] |
2008 |
Gallbladder |
PB |
Taqman |
122 |
92 |
23 |
237 |
311 |
335 |
82 |
728 |
0.34 |
0.564 |
12 |
Hsing [45] |
2008 |
EHBD |
PB |
Taqman |
55 |
52 |
17 |
124 |
334 |
353 |
90 |
777 |
0.34 |
0.823 |
12 |
Hsing [45] |
2008 |
AV |
PB |
Taqman |
20 |
6 |
21 |
47 |
334 |
353 |
90 |
777 |
0.34 |
0.823 |
12 |
Yao [66] |
2008 |
Oral |
HB |
PCR-RFLP |
113 |
120 |
47 |
280 |
129 |
134 |
37 |
300 |
0.35 |
0.809 |
10 |
Xiao [47] |
2009 |
Gastric |
HB |
PCR-RFLP |
100 |
100 |
20 |
220 |
272 |
283 |
69 |
624 |
0.34 |
0.719 |
9 |
Liu [67] |
2010 |
Prostate |
HB |
PCR-RFLP |
120 |
108 |
34 |
262 |
132 |
110 |
28 |
270 |
0.31 |
0.477 |
10 |
Liu [49] |
2010 |
HCC |
HB |
Taqman |
79 |
73 |
18 |
170 |
75 |
92 |
20 |
187 |
0.35 |
0.292 |
5 |
Oh [18] |
2010 |
Esophageal |
PB |
Taqman |
90 |
79 |
27 |
196 |
179 |
158 |
42 |
379 |
0.32 |
0.426 |
13 |
Oh [18] |
2010 |
Gastric |
PB |
Taqman |
81 |
87 |
20 |
188 |
179 |
158 |
42 |
379 |
0.32 |
0.426 |
13 |
Oh [18] |
2010 |
HCC |
PB |
Taqman |
91 |
70 |
25 |
186 |
179 |
158 |
42 |
379 |
0.32 |
0.426 |
13 |
Su [68] |
2010 |
Gastric |
HB |
PCR-RFLP |
18 |
21 |
4 |
43 |
51 |
43 |
6 |
100 |
0.28 |
0.433 |
6 |
Bei [69] |
2011 |
HCC |
HB |
Taqman |
44 |
247 |
298 |
589 |
51 |
240 |
306 |
597 |
0.29 |
0.686 |
12 |
Liu [70] |
2011 |
Gastric |
HB |
PCR-RFLP |
99 |
96 |
39 |
234 |
109 |
106 |
28 |
243 |
0.33 |
0.773 |
7 |
He [52] |
2012 |
Gastric |
HB |
PCR-RFLP |
82 |
96 |
18 |
196 |
92 |
128 |
28 |
248 |
0.37 |
0.095 |
9 |
He [71] |
2012 |
Breast |
HB |
MALDI-TOF MS |
177 |
141 |
29 |
347 |
229 |
223 |
44 |
496 |
0.31 |
0.322 |
10 |
Yuan [72] |
2012 |
Gastric |
HB |
MassARRAY |
108 |
129 |
42 |
279 |
142 |
120 |
34 |
296 |
0.32 |
0.266 |
9 |
Zeng [73] |
2012 |
Gastric |
PB |
SBE |
60 |
80 |
11 |
151 |
78 |
65 |
10 |
153 |
0.28 |
0.467 |
10 |
Chang [53] |
2013 |
HN |
HB |
Taqman |
132 |
153 |
28 |
313 |
136 |
130 |
29 |
295 |
0.32 |
0.798 |
10 |
Yao [74] |
2013 |
AML |
HB |
PCR-RFLP |
68 |
38 |
9 |
115 |
56 |
63 |
18 |
137 |
0.36 |
0.966 |
9 |
Cheng [57] |
2015 |
NTCL |
HB |
PCR-LDR |
57 |
59 |
9 |
125 |
136 |
125 |
39 |
300 |
0.34 |
0.230 |
10 |
Fei [58] |
2015 |
AML |
HB |
PCR-RFLP |
57 |
72 |
38 |
167 |
137 |
137 |
54 |
328 |
0.37 |
0.052 |
8 |
Hsu [59] |
2015 |
Oral |
HB |
PCR-SSP |
33 |
101 |
11 |
145 |
53 |
51 |
8 |
112 |
0.30 |
0.363 |
7 |
Yang [60] |
2015 |
Esophageal |
HB |
MassARRAY |
101 |
105 |
40 |
246 |
219 |
203 |
69 |
492 |
0.35 |
0.051 |
9 |
Zhang [75] |
2015 |
Lung |
HB |
PCR-RFLP |
108 |
135 |
87 |
330 |
145 |
144 |
47 |
336 |
0.35 |
0.247 |
8 |
Bai [61] |
2016 |
Cervical |
HB |
PCR-RFLP |
44 |
76 |
45 |
165 |
28 |
73 |
64 |
165 |
0.39 |
0.362 |
8 |
Cui [76] |
2016 |
Osteosarcoma |
HB |
PCR-RFLP |
34 |
120 |
106 |
260 |
43 |
118 |
99 |
260 |
0.39 |
0.438 |
10 |
Li [77] |
2016 |
Gastric |
HB |
PCR-RFLP |
36 |
83 |
38 |
157 |
36 |
127 |
85 |
248 |
0.40 |
0.300 |
6 |
Peng [63] |
2016 |
HCC |
PB |
PCR-RFLP |
74 |
77 |
22 |
173 |
86 |
78 |
17 |
181 |
0.31 |
0.910 |
10 |
-592A/C polymorphism |
|||||||||||||||
Wu [64] |
2003 |
Gastric |
HB |
Sequencing |
88 |
105 |
27 |
220 |
127 |
83 |
20 |
230 |
0.27 |
0.231 |
9 |
Savage [65] |
2004 |
Gastric |
PB |
SBE |
9 |
39 |
36 |
84 |
49 |
166 |
171 |
386 |
0.34 |
0.383 |
11 |
Savage [65] |
2004 |
Esophageal |
PB |
SBE |
17 |
51 |
51 |
119 |
49 |
166 |
171 |
386 |
0.34 |
0.383 |
12 |
Shih [42] |
2005 |
Lung |
HB |
PCR-RFLP |
66 |
70 |
18 |
154 |
116 |
76 |
13 |
205 |
0.25 |
0.907 |
8 |
Tseng [78] |
2006 |
HCC |
HB |
MALDI-TOF MS |
93 |
84 |
31 |
208 |
90 |
75 |
19 |
184 |
0.31 |
0.567 |
7 |
Wei [43] |
2007 |
NPC |
HB |
PCR-RFLP |
82 |
81 |
35 |
198 |
94 |
92 |
24 |
210 |
0.33 |
0.836 |
8 |
Hsing [45] |
2008 |
Gallbladder |
PB |
Taqman |
121 |
91 |
23 |
235 |
318 |
334 |
82 |
734 |
0.34 |
0.684 |
12 |
Yao [66] |
2008 |
Oral |
HB |
PCR-RFLP |
113 |
120 |
47 |
280 |
129 |
134 |
37 |
300 |
0.35 |
0.809 |
10 |
Xiao [47] |
2009 |
Gastric |
HB |
PCR-RFLP |
100 |
100 |
20 |
220 |
272 |
283 |
69 |
624 |
0.34 |
0.719 |
9 |
Liu [67] |
2010 |
Prostate |
HB |
PCR-RFLP |
120 |
108 |
34 |
262 |
132 |
110 |
28 |
270 |
0.31 |
0.477 |
10 |
Oh [18] |
2010 |
Esophageal |
PB |
SNPlex |
81 |
72 |
26 |
179 |
167 |
159 |
36 |
362 |
0.32 |
0.837 |
13 |
Oh [18] |
2010 |
Gastric |
PB |
SNPlex |
77 |
81 |
20 |
178 |
167 |
159 |
36 |
362 |
0.32 |
0.837 |
13 |
Oh [18] |
2010 |
HCC |
PB |
SNPlex |
82 |
68 |
19 |
169 |
167 |
159 |
36 |
362 |
0.32 |
0.837 |
13 |
Xiong [79] |
2010 |
Cervical |
HB |
PCR-RFLP |
35 |
23 |
12 |
70 |
51 |
44 |
13 |
108 |
0.32 |
0.467 |
7 |
Bei [69] |
2011 |
HCC |
HB |
Taqman |
42 |
248 |
299 |
589 |
49 |
244 |
304 |
597 |
0.29 |
0.997 |
12 |
Liang [80] |
2011 |
Lung |
HB |
PCR-RFLP |
69 |
36 |
11 |
116 |
69 |
44 |
7 |
120 |
0.24 |
0.997 |
9 |
Liu [70] |
2011 |
Gastric |
HB |
PCR-RFLP |
99 |
96 |
39 |
234 |
109 |
106 |
28 |
243 |
0.33 |
0.773 |
7 |
Yu [81] |
2011 |
Cervical |
PB |
PCR-RFLP |
59 |
37 |
7 |
103 |
52 |
44 |
19 |
115 |
0.36 |
0.075 |
10 |
He [52] |
2012 |
Gastric |
HB |
PCR-RFLP |
82 |
96 |
18 |
196 |
92 |
128 |
28 |
248 |
0.37 |
0.095 |
9 |
Zeng [73] |
2012 |
Gastric |
PB |
SBE |
59 |
77 |
15 |
151 |
80 |
66 |
7 |
153 |
0.26 |
0.148 |
10 |
Zhang [82] |
2012 |
NHL |
PB |
Taqman |
226 |
228 |
60 |
514 |
269 |
235 |
53 |
557 |
0.31 |
0.872 |
14 |
Chang [53] |
2013 |
HN |
HB |
Taqman |
134 |
152 |
27 |
313 |
137 |
129 |
29 |
295 |
0.32 |
0.864 |
10 |
Pan [56] |
2013 |
Gastric |
HB |
MassARRAY |
144 |
128 |
36 |
308 |
142 |
135 |
31 |
308 |
0.32 |
0.896 |
9 |
Sun [83] |
2013 |
Esophageal |
HB |
SNPscan |
162 |
163 |
31 |
356 |
191 |
141 |
33 |
365 |
0.28 |
0.347 |
10 |
Tsai [84] |
2013 |
NPC |
HB |
PCR-RFLP |
93 |
66 |
17 |
176 |
261 |
205 |
56 |
522 |
0.30 |
0.103 |
9 |
Yao [74] |
2013 |
AML |
HB |
PCR-RFLP |
68 |
38 |
9 |
115 |
56 |
63 |
18 |
137 |
0.36 |
0.966 |
9 |
Bei [85] |
2014 |
HCC |
HB |
Taqman |
356 |
312 |
52 |
720 |
392 |
313 |
79 |
784 |
0.30 |
0.160 |
11 |
Hsia [86] |
2014 |
Lung |
HB |
PCR-RFLP |
173 |
145 |
40 |
358 |
368 |
277 |
71 |
716 |
0.29 |
0.080 |
12 |
Kuo [87] |
2014 |
Gastric |
HB |
PCR-RFLP |
186 |
134 |
38 |
358 |
180 |
141 |
37 |
358 |
0.30 |
0.235 |
9 |
Yu [88] |
2014 |
Colorectal |
PB |
PCR-RFLP |
153 |
114 |
31 |
298 |
118 |
135 |
38 |
291 |
0.36 |
0.950 |
13 |
Cheng [57] |
2015 |
NTCL |
HB |
PCR-LDR |
57 |
59 |
9 |
125 |
138 |
124 |
38 |
300 |
0.33 |
0.225 |
10 |
Fei [58] |
2015 |
AML |
HB |
PCR-RFLP |
54 |
74 |
39 |
167 |
126 |
142 |
59 |
328 |
0.40 |
0.091 |
8 |
Hsu [59] |
2015 |
Oral |
HB |
PCR-SSP |
33 |
101 |
11 |
145 |
53 |
51 |
8 |
112 |
0.30 |
0.363 |
7 |
Yang [60] |
2015 |
Esophageal |
HB |
MassARRAY |
85 |
116 |
45 |
246 |
185 |
228 |
79 |
492 |
0.39 |
0.534 |
9 |
Yin [89] |
2015 |
Gastric |
HB |
SNPscan |
112 |
96 |
20 |
228 |
235 |
184 |
42 |
461 |
0.29 |
0.491 |
10 |
Zhang [75] |
2015 |
Lung |
HB |
PCR-RFLP |
64 |
156 |
110 |
330 |
85 |
176 |
75 |
336 |
0.49 |
0.374 |
8 |
Bai [61] |
2016 |
Cervical |
HB |
PCR-RFLP |
63 |
82 |
20 |
165 |
70 |
80 |
15 |
165 |
0.33 |
0.243 |
8 |
Cai [62] |
2016 |
Colorectal |
HB |
MassARRAY |
221 |
128 |
26 |
375 |
184 |
158 |
40 |
382 |
0.31 |
0.485 |
9 |
Chang [90] |
2016 |
RCC |
HB |
PCR-RFLP |
61 |
27 |
4 |
92 |
371 |
185 |
24 |
580 |
0.20 |
0.877 |
9 |
Cui [76] |
2016 |
Osteosarcoma |
HB |
PCR-RFLP |
108 |
125 |
27 |
260 |
100 |
128 |
32 |
260 |
0.37 |
0.359 |
10 |
Peng [63] |
2016 |
HCC |
PB |
PCR-RFLP |
57 |
81 |
35 |
173 |
79 |
81 |
22 |
182 |
0.34 |
0.860 |
10 |
Ma [91] |
2016 |
Gastric |
HB |
PCR-RFLP |
67 |
63 |
17 |
147 |
71 |
67 |
12 |
150 |
0.30 |
0.486 |
8 |
MAF: minor allele frequency; HWE: Hardy-Weinberg equilibrium; HB: hospital based; PB: population based; NA: not applicable; HCC: hepatocellular carcinoma; NPC: nasopharyngeal carcinoma; EHBD: extrahepatic bile duct; AV: ampulla of vater; HN: head and neck; NTCL: NK/T-cell lymphoma; AML: acute myeloid leukemia; NHL: non-Hodgkin’s lymphoma; RCC: renal cell carcinoma; PCR-RFLP: polymorphism chain reaction restriction fragment length polymorphism; PCR-SSP: polymerase chain reaction sequence-specific primer; AS-PCR: allele-specific polymorphism chain reaction; PCR-LDR: polymorphism chain reaction-ligase detection reaction; SBE: single base extension; MALDI-TOF MS: matrix-assisted laser desorption/ionization-time-of-flight mass spectrometry.
a Heneghan [41], Shih [42], Hsing [44] (extrahepatic bile duct cancer and ampulla of vater cancer), Xiao [47], He [52], Chang [53], Cheng [57], Hsu [59] and Cai [62] were only calculated for the heterozygous model, dominant model and allele comparison for the IL-10 -1082A/G polymorphism, and the number of GG genotype was zero.
b Bai [44], Hao [46] and Niu [50] were only calculated for the dominant model.
For the studies assessing three polymorphisms (-1082A/G, -819T/C and -592A/C) [32, 37], two (-1082A/G and -592A/C) [31], only one such as -1082A/G [29, 30, 33-35, 38] or -819T/C [36, 39] polymorphism and cancer risk but no other IL-10 gene polymorphisms, the genotypes distribution in the controls were deviated from HWE, thus, these studies were excluded in the final analysis. Sixteen studies were also deviated from HWE, but the genotypes distribution in the controls of eight studies [18, 64-67, 70, 73, 76] were consistent with that expected from the HWE for both -819T/C and -592A/C polymorphisms, five [81, 84, 86, 87, 90] for the -592A/C polymorphism and three [41, 48, 54] for the -1082A/G polymorphism, thus, these studies were included in the final analysis. For those studies [18, 45, 65] with the same control subjects, the control numbers were calculated once in the total number. Overall, 26 studies with 4,901 cases and 6,426 controls for the -1082A/G polymorphism, 33 studies with 6,717 cases and 8,550 controls for the -819T/C polymorphism, and 42 studies with 9,934 cases and 13,169 controls for the -592A/C polymorphism were considered in this meta-analysis. Sample sizes for cases of the included studies ranged from 43 to 400 for the -1082A/G polymorphism, 43 to 589 for the -819T/C polymorphism, and 70 to 720 for the -592A/C polymorphism.
As regards the -1082A/G polymorphism, five studies focused on gastric cancer [40, 44, 47, 52, 56], three on hepatocellular carcinoma [41, 49, 63], two studies for each of the following cancer types, such as lung cancer [42, 46], cervical cancer [51, 61] and esophageal cancer [55, 60], and the other cancer types with one study per each cancer type. As regards the -819T/C polymorphism, 10 studies focused on gastric cancer [18, 47, 52, 64, 65, 68, 70, 72, 73, 77], four on hepatocellular carcinoma [18, 49, 63, 69], three on esophageal cancer [18, 60, 65], two studies for each of the following cancer types, such as lung cancer [42, 75], oral cancer [59, 66] and acute myeloid leukemia [58, 74], and the other cancer types with one study per each cancer type. As regards the -592A/C polymorphism, 11 studies focused on gastric cancer [18, 47, 52, 56, 64, 65, 70, 73, 87, 89, 91], five on hepatocellular carcinoma [18, 63, 69, 78, 85], four studies for each of the following cancer types, such as lung cancer [42, 75, 80, 86] and esophageal cancer [18, 60, 65, 83], three on cervical cancer [61, 79, 81], two studies for each of the following cancer types, such as nasopharyngeal carcinoma [43, 84], oral cancer [59, 66], acute myeloid leukemia [58, 74] and colorectal cancer [62, 88], and the other cancer types with one study per each cancer type. Among all studies, 18 were hospital-based and eight were population-based associated to the -1082A/G polymorphism, 23 were hospital-based and 10 were population-based associated to the -819T/C polymorphism, 31 were hospital-based and 11 were population-based associated to the -592A/C polymorphism. Furthermore, 18 studies were rated as low quality (quality score ≤ 9) and eight were considered as high quality (quality score > 9) for the -1082A/G polymorphism, 16 were low quality and 17 were high quality studies for the -819T/C polymorphism, 21 were low quality and 21 were high quality studies for the -592A/C polymorphism. Controls were matched for age and sex in most studies, and cases were mostly histologically confirmed.
Meta-analysis results
The main results regarding the association between IL-10 -1082A/G polymorphism and cancer risk are shown in Table 2 and Figure 2. A significant association was found between IL-10 -1082A/G polymorphism and overall cancer risk [dominant: odds ratio (OR) = 1.32, 95% confidence interval (CI) = 1.04-1.67, P < 0.001]. In the subgroup analysis, a statistically significant association was found for hepatocellular carcinoma (heterozygous: OR = 1.40, 95% CI = 1.01-1.94, P = 0.433; dominant: OR = 1.43, 95% CI = 1.04-1.95, P = 0.497 and allele comparison: OR = 1.35, 95% CI = 1.04-1.75, P = 0.480) and low quality studies (heterozygous: OR = 1.42, 95% CI = 1.05-1.91, P < 0.001; dominant: OR = 1.56, 95% CI = 1.17-2.08, P < 0.001 and allele comparison: OR = 1.43, 95% CI = 1.08-1.88, P < 0.001).
Table 2: Meta-analysis of the association between IL-10 polymorphisms and cancer risk
Variables |
No. of studies |
Sample size (case/controls) |
Homozygous |
Heterozygous |
Recessive |
Dominant |
Allele comparison |
|||||
|---|---|---|---|---|---|---|---|---|---|---|---|---|
OR (95% CI) |
Phet |
OR (95% CI) |
Phet |
OR (95% CI) |
Phet |
OR (95% CI) |
Phet |
OR (95% CI) |
Phet |
|||
-1082A/G |
GG vs. AA |
AG vs. AA |
GG vs.(AA+AG) |
(AG+GG) vs. AA |
G vs.A |
|||||||
All |
26 |
4,901/6,426 |
1.21 (0.80-1.85) |
0.025 |
1.22 (0.97-1.54) |
<0.001 |
1.12 (0.84-1.48) |
0.242 |
1.32 (1.04-1.67) |
<0.001 |
1.22 (0.99-1.51) |
<0.001 |
Cancer type |
||||||||||||
Gastric |
5 |
985/1,511 |
1.38 (0.37-5.20) |
0.930 |
1.70 (0.79-3.66) |
<0.001 |
1.37 (0.36-5.13) |
0.953 |
1.97 (0.97-3.99) |
<0.001 |
1.72 (0.79-3.71) |
<0.001 |
HCC |
3 |
441/466 |
1.56 (0.77-3.18) |
0.950 |
1.40 (1.01-1.94) |
0.433 |
1.45 (0.73-2.90) |
0.978 |
1.43 (1.04-1.95) |
0.497 |
1.35 (1.04-1.75) |
0.480 |
Lung a |
2 |
197/257 |
NA |
NA |
NA |
NA |
NA |
NA |
3.24 (0.84-12.54) |
0.047 |
NA |
NA |
Cervical |
2 |
351/365 |
1.45 (0.87-2.40) |
0.792 |
1.31 (0.96-1.79) |
0.371 |
1.26 (0.78-2.04) |
0.991 |
1.33 (0.99-1.79) |
0.386 |
1.24 (0.99-1.55) |
0.490 |
Esophageal |
2 |
364/611 |
0.88 (0.14-5.40) |
0.099 |
0.88 (0.36-2.14) |
0.041 |
0.94 (0.29-3.01) |
0.205 |
0.87 (0.29-2.56) |
0.009 |
1.00 (0.44-2.26) |
0.015 |
Others |
12 |
2,563/3,216 |
1.30 (0.59-2.85) |
0.168 |
0.96 (0.74-1.25) |
0.002 |
1.30 (0.68-2.46) |
0.280 |
1.05 (0.78-1.41) |
<0.001 |
0.97 (0.74-1.27) |
<0.001 |
Source of control |
||||||||||||
PB |
8 |
1,025/1,398 |
1.42 (0.87-2.33) |
0.454 |
1.13 (0.84-1.53) |
0.114 |
1.25 (0.78-2.01) |
0.538 |
1.29 (0.92-1.80) |
0.013 |
1.07 (0.82-1.41) |
0.078 |
HB |
18 |
3,876/5,028 |
1.20 (0.69-2.09) |
0.018 |
1.25 (0.93-1.68) |
<0.001 |
1.13 (0.78-1.64) |
0.183 |
1.33 (0.98-1.80) |
<0.001 |
1.27 (0.97-1.68) |
<0.001 |
Score |
||||||||||||
Low |
18 |
3,365/4,373 |
1.29 (0.78-2.12) |
0.012 |
1.42 (1.05-1.91) |
<0.001 |
1.16 (0.83-1.63) |
0.160 |
1.56 (1.17-2.08) |
<0.001 |
1.43 (1.08-1.88) |
<0.001 |
High |
8 |
1,536/2,053 |
1.13 (0.52-2.48) |
0.349 |
0.89 (0.68-1.17) |
0.073 |
1.15 (0.57-2.31) |
0.417 |
0.88 (0.67-1.67) |
0.059 |
0.88 (0.68-1.14) |
0.047 |
-819T/C |
CC vs.TT |
CT vs.TT |
CC vs.(TT+CT) |
(CT+CC) vs.TT |
C vs.T |
|||||||
All |
33 |
6,717/8,550 |
1.19 (1.00-1.41) |
<0.001 |
1.04 (0.93-1.16) |
<0.001 |
1.17 (1.00-1.36) |
<0.001 |
1.08 (0.97-1.20) |
<0.001 |
1.08 (1.00-1.18) |
<0.001 |
Cancer type |
||||||||||||
Gastric |
10 |
1,772/2,142 |
1.08 (0.79-1.47) |
0.021 |
1.15 (0.95-1.38) |
0.046 |
1.01 (0.81-1.27) |
0.196 |
1.14 (0.93-1.40) |
0.007 |
1.08 (0.92-1.27) |
0.002 |
HCC |
4 |
1,118/1,344 |
1.14 (0.86-1.51) |
0.744 |
0.96 (0.78-1.19) |
0.396 |
1.04 (0.86-1.26) |
0.668 |
1.00 (0.82-1.22) |
0.412 |
1.01 (0.90-1.15) |
0.549 |
Esophageal |
3 |
558/873 |
1.23 (0.90-1.67) |
0.940 |
1.02 (0.82-1.27) |
0.741 |
1.21 (0.91-1.61) |
0.966 |
1.07 (0.87-1.31) |
0.763 |
1.09 (0.94-1.27) |
0.852 |
Lung |
2 |
484/541 |
2.66 (1.84-3.84) |
0.569 |
1.18 (0.90-1.56) |
0.560 |
2.40 (1.71-3.37) |
0.399 |
1.49 (1.16-1.92) |
0.633 |
1.59 (1.33-1.91) |
0.920 |
Oral |
2 |
425/412 |
1.58 (1.01-2.46) |
0.464 |
1.77 (0.58-5.37) |
0.001 |
1.35 (0.89-2.06) |
0.583 |
1.80 (0.67-4.82) |
0.002 |
1.38 (0.94-2.02) |
0.080 |
AML |
2 |
282/465 |
0.87 (0.22-3.48) |
0.006 |
0.80 (0.32-2.01) |
0.007 |
0.98 (0.38-2.53) |
0.046 |
0.82 (0.29-2.34) |
0.001 |
0.88 (0.38-2.03) |
<0.001 |
Others |
10 |
2,078/2,773 |
1.08 (0.76-1.53) |
<0.001 |
0.91 (0.76-1.09) |
0.047 |
1.14 (0.79-1.65) |
<0.001 |
0.95 (0.82-1.11) |
0.117 |
1.10 (0.87-1.18) |
0.001 |
Source of control |
||||||||||||
PB |
10 |
1,502/1,872 |
1.24 (0.93-1.65) |
0.035 |
0.96 (0.79-1.16) |
0.035 |
1.31 (0.92-1.86) |
<0.001 |
1.01 (0.88-1.16) |
0.248 |
1.08 (0.95-1.24) |
0.031 |
HB |
23 |
5,215/6,678 |
1.17 (0.94-1.44) |
<0.001 |
1.08 (0.95-1.22) |
0.001 |
1.12 (0.95-1.33) |
<0.001 |
1.10 (0.96-1.27) |
<0.001 |
1.08 (0.97-1.20) |
<0.001 |
Score |
||||||||||||
Low |
16 |
3,039/4,160 |
1.21 (0.89-1.64) |
<0.001 |
1.07 (0.89-1.29) |
<0.001 |
1.18 (0.92-1.51) |
<0.001 |
1.11 (0.91-1.36) |
<0.001 |
1.10 (0.94-1.29) |
<0.001 |
High |
17 |
3,678/4,390 |
1.17 (0.98-1.39) |
0.075 |
1.01 (0.89-1.13) |
0.097 |
1.16 (0.95-1.42) |
0.001 |
1.03 (0.94-1.12) |
0.409 |
1.05 (0.97-1.14) |
0.089 |
-592A/C |
CC vs.AA |
AC vs.AA |
CC vs.(AA+AC) |
(AC+CC) vs.AA |
C vs.A |
|||||||
All |
42 |
9,934/13,169 |
1.13 (1.00-1.28) |
0.001 |
1.04 (0.96-1.13) |
0.001 |
1.10 (0.99-1.21) |
0.035 |
1.06 (0.97-1.15) |
<0.001 |
1.05 (0.99-1.12) |
<0.001 |
Cancer type |
||||||||||||
Gastric |
11 |
2,324/2,775 |
1.18 (0.96-1.44) |
0.289 |
1.08 (0.94-1.23) |
0.200 |
1.11 (0.94-1.32) |
0.562 |
1.10 (0.95-1.27) |
0.093 |
1.08 (0.97-1.21) |
0.080 |
HCC |
5 |
1,859/2,109 |
1.20 (0.82-1.75) |
0.032 |
1.09 (0.94-1.27) |
0.650 |
1.10 (0.80-1.50) |
0.039 |
1.09 (0.94-1.27) |
0.373 |
1.08 (0.93-1.24) |
0.094 |
Esophageal |
4 |
900/1,243 |
1.18 (0.90-1.54) |
0.637 |
1.13 (0.93-1.36) |
0.399 |
1.11 (0.88-1.39) |
0.498 |
1.15 (0.96-1.37) |
0.582 |
1.10 (0.97-1.25) |
0.702 |
Lung |
4 |
958/1,377 |
1.64 (1.19-2.24) |
0.301 |
1.17 (0.94-1.45) |
0.285 |
1.52 (1.20-1.93) |
0.402 |
1.27 (1.01-1.60) |
0.198 |
1.27 (1.06-1.52) |
0.149 |
Cervical |
3 |
338/388 |
0.89 (0.35-2.24) |
0.031 |
0.91 (0.67-1.25) |
0.431 |
0.94 (0.41-2.19) |
0.042 |
0.89 (0.60-1.32) |
0.174 |
0.91 (0.60-1.38) |
0.034 |
NPC |
2 |
374/732 |
1.19 (0.62-2.31) |
0.116 |
0.95 (0.72-1.25) |
0.697 |
1.22 (0.66-2.25) |
0.125 |
0.99 (0.77-1.29) |
0.346 |
1.05 (0.78-1.42) |
0.129 |
Oral |
2 |
425/412 |
1.58 (1.01-2.46) |
0.464 |
1.77 (0.58-5.37) |
0.001 |
1.35 (0.89-2.06) |
0.583 |
1.80 (0.67-4.82) |
0.002 |
1.38 (0.94-2.02) |
0.080 |
AML |
2 |
282/465 |
0.84 (0.23-3.05) |
0.011 |
0.79 (0.33-1.90) |
0.010 |
0.95 (0.40-2.27) |
0.064 |
0.80 (0.30-2.16) |
0.002 |
0.86 (0.39-1.88) |
0.001 |
Colorectal |
2 |
673/673 |
0.58 (0.40-0.85) |
0.694 |
0.66 (0.53-0.83) |
0.882 |
0.70 (0.49-1.01) |
0.599 |
0.65 (0.52-0.80) |
0.994 |
0.72 (0.61-0.85) |
0.750 |
Others |
7 |
1,801/2,995 |
0.98 (0.77-1.24) |
0.313 |
1.01 (0.86-1.17) |
0.246 |
0.98 (0.80-1.21) |
0.437 |
1.00 (0.86-1.16) |
0.185 |
0.99 (0.88-1.11) |
0.187 |
Source of control |
||||||||||||
PB |
11 |
2,203/2,780 |
1.08 (0.82-1.43) |
0.011 |
0.96 (0.82-1.13) |
0.056 |
1.08 (0.89-1.33) |
0.117 |
0.99 (0.82-1.18) |
0.004 |
1.01 (0.87-1.16) |
0.001 |
HB |
31 |
7,731/10,389 |
1.14 (0.99-1.31) |
0.009 |
1.07 (0.97-1.17) |
0.004 |
1.10 (0.98-1.24) |
0.054 |
1.09 (0.99-1.20) |
<0.001 |
1.07 (1.00-1.15) |
<0.001 |
Score |
||||||||||||
Low |
21 |
4,240/6,041 |
1.23 (1.02-1.49) |
0.012 |
1.03 (0.90-1.19) |
<0.001 |
1.21 (1.05-1.40) |
0.193 |
1.08 (0.93-1.25) |
<0.001 |
1.09 (0.98-1.21) |
<0.001 |
High |
21 |
5,694/7,128 |
1.05 (0.89-1.23) |
0.023 |
1.05 (0.96-1.15) |
0.161 |
1.02 (0.89-1.16) |
0.100 |
1.05 (0.95-1.15) |
0.033 |
1.03 (0.95-1.11) |
0.007 |
Het: heterogeneity; NA: not applicable; HCC: hepatocellular carcinoma; NPC: nasopharyngeal carcinoma; AML: acute myeloid leukemia; PB: population based; HB: hospital based.
a Lung cancer was only calculated for the dominant model.
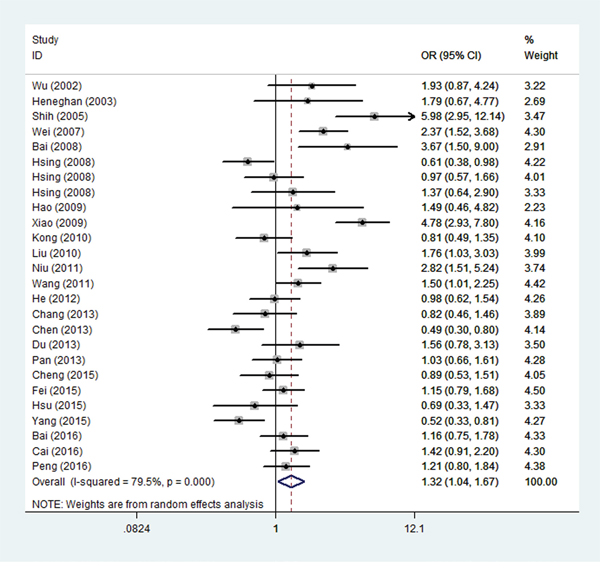
Figure 2: Forest plot for overall cancer risk associated with the IL-10 -1082A/G polymorphism by a dominant model. For each study, the estimated OR and its 95% CI are plotted with a box and a horizontal line. ◊, pooled ORs and its 95% CIs.
The overall results regarding the association between IL-10 -819T/C polymorphism and cancer risk are shown in Table 2. A significant association was found between IL-10 -819T/C polymorphism and overall cancer risk (homozygous: OR = 1.19, 95% CI = 1.00-1.41, P < 0.001; recessive: OR = 1.17, 95% CI = 1.00-1.36, P < 0.001 and allele comparison: OR = 1.08, 95% CI = 1.00-1.18, P < 0.001). In the subgroup analysis, a statistically significant association was found for lung cancer (homozygous: OR = 2.66, 95% CI = 1.84-3.84, P = 0.569; recessive: OR = 2.40, 95% CI = 1.71-3.37, P = 0.399; dominant: OR = 1.49, 95% CI = 1.16-1.92, P = 0.633 and allele comparison: OR = 1.59, 95% CI = 1.33-1.91, P = 0.920) and oral cancer (homozygous: OR = 1.58, 95% CI = 1.01-2.46, P = 0.464).
The detailed results regarding the association between IL-10 -592A/C polymorphism and cancer risk are shown in Table 2. A significant association was found between IL-10 -592A/C polymorphism and increased overall cancer risk (homozygous: OR = 1.13, 95% CI = 1.00-1.28, P = 0.001). In the subgroup analysis, a statistically significant increased risk was found for lung cancer (homozygous: OR = 1.64, 95% CI = 1.19-2.24, P = 0.301; recessive: OR = 1.52, 95% CI = 1.20-1.93, P = 0.402; dominant: OR = 1.27, 95% CI = 1.01-1.60, P = 0.198 and allele comparison: OR = 1.27, 95% CI = 1.06-1.52, P = 0.149), oral cancer (homozygous: OR = 1.58, 95% CI = 1.01-2.46, P = 0.464), hospital-based studies (allele comparison: OR = 1.07, 95% CI = 1.00-1.15, P < 0.001) and low quality studies (homozygous: OR = 1.23, 95% CI = 1.02-1.49, P = 0.012 and recessive: OR = 1.21, 95% CI = 1.05-1.40, P = 0.193). In contrast, a significantly decreased risk was observed for colorectal cancer (homozygous: OR = 0.58, 95% CI = 0.40-0.85, P = 0.694; heterozygous: OR = 0.66, 95% CI = 0.53-0.83, P = 0.882; dominant: OR = 0.65, 95% CI = 0.52-0.80, P = 0.994 and allele comparison: OR = 0.72, 95% CI = 0.61-0.85, P = 0.750).
Heterogeneity and sensitivity analysis
Substantial heterogeneities were found among all studies regarding IL-10 -1082A/G polymorphism and overall cancer risk (homozygous: P = 0.025; heterozygous: P < 0.001; dominant: P < 0.001 and allele comparison: P < 0.001), but not under the recessive model (P = 0.242) (Table 2). Considerable heterogeneities were also observed for the -819T/C (all P < 0.001) and -592A/C (homozygous: P = 0.001; heterozygous: P = 0.001; recessive: P = 0.035; dominant: P < 0.001 and allele comparison: P < 0.001) polymorphisms. Therefore, the random-effect model was used to generate wider CIs. Sensitivity analysis was conducted and the results indicated that each individual study did not influence the pooled ORs obviously (data not shown).
Publication bias
The funnel plot was symmetric for the -1082A/G (Figure 3), -819T/C and -592A/C polymorphisms, indicating no presence of publication bias, which was further supported by the Egger’s test for the -1082A/G polymorphism (homozygous: P = 0.428; heterozygous: P = 0.395; recessive: P = 0.168; dominant: P = 0.223 and allele comparison: P = 0.179), -819T/C polymorphism (homozygous: P = 0.589; heterozygous: P = 0.777; recessive: P = 0.616; dominant: P = 0.797 and allele comparison: P = 0.576), and -592A/C polymorphism (homozygous: P = 0.727; heterozygous: P = 0.763; recessive: P = 0.748; dominant: P = 0.474 and allele comparison: P = 0.677).
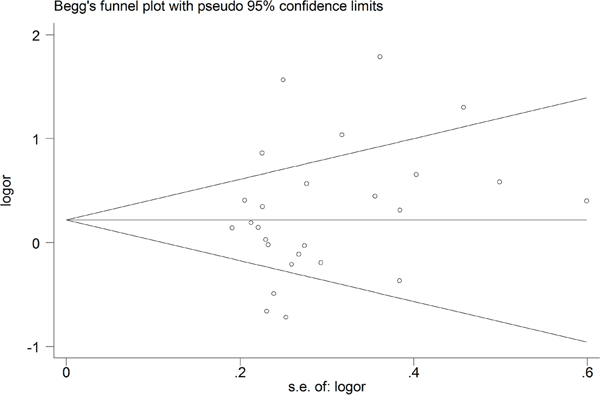
Figure 3: Begg’s funnel plot for the IL-10 -1082A/G polymorphism and overall cancer risk by a dominant model.
False-positive report probability (FPRP) test analysis
The significant findings were assessed using the FPRP test and the results are shown in Table 3. With a prior probability of 0.1, assuming that the OR for a specific genotype was 0.67/1.50 (protection/risk), with statistical power of 0.857, the FPRP value was 0.179 for the -1082A/G polymorphism and cancer risk under the dominant model, and a positive association was also found for low quality studies (dominant: FPRP = 0.053 and allele comparison: FPRP = 0.129). As regards the -819T/C polymorphism, a positive association was found for lung cancer (homozygous: FPRP = 0.001; recessive: FPRP = 0.001; dominant: FPRP = 0.034 and allele comparison: FPRP < 0.001). As regards the -592A/C polymorphism, noteworthy findings were observed for lung cancer (homozygous: FPRP = 0.055; recessive: FPRP = 0.011 and allele comparison: FPRP = 0.078), colorectal cancer (homozygous: FPRP = 0.165; heterozygous: FPRP = 0.007; dominant: FPRP = 0.001 and allele comparison: FPRP = 0.001) and low quality studies (recessive: FPRP = 0.086). However, greater FPRP values were observed for other significant findings, which need validation in further studies.
Table 3: False-positive report probability values for associations between cancer risk and IL-10 polymorphisms
Genotype |
Crude OR (95% CI) |
P-valuea |
Statistical powerb |
Prior probability |
||||
|---|---|---|---|---|---|---|---|---|
0.25 |
0.1 |
0.01 |
0.001 |
0.0001 |
||||
-1082A/G |
||||||||
All |
||||||||
Dominant |
1.32 (1.04-1.67) |
0.021 |
0.857 |
0.068 |
0.179 |
0.705 |
0.960 |
0.996 |
Cancer type-HCC |
||||||||
Heterozygous |
1.40 (1.01-1.94) |
0.043 |
0.661 |
0.164 |
0.371 |
0.866 |
0.985 |
0.998 |
Dominant |
1.43 (1.04-1.95) |
0.024 |
0.619 |
0.103 |
0.257 |
0.792 |
0.975 |
0.997 |
Allele comparison |
1.35 (1.04-1.75) |
0.023 |
0.787 |
0.082 |
0.211 |
0.747 |
0.967 |
0.997 |
Quality score-low |
||||||||
Heterozygous |
1.42 (1.05-1.91) |
0.020 |
0.641 |
0.087 |
0.223 |
0.759 |
0.970 |
0.997 |
Dominant |
1.56 (1.17-2.08) |
0.002 |
0.395 |
0.018 |
0.053 |
0.380 |
0.861 |
0.984 |
Allele comparison |
1.43 (1.08-1.88) |
0.010 |
0.634 |
0.047 |
0.129 |
0.619 |
0.942 |
0.994 |
-819T/C |
||||||||
All |
||||||||
Homozygous |
1.19 (1.00-1.41) |
0.044 |
0.996 |
0.118 |
0.286 |
0.815 |
0.978 |
0.998 |
Recessive |
1.17 (1.00-1.36) |
0.041 |
0.999 |
0.109 |
0.269 |
0.802 |
0.976 |
0.998 |
Allele comparison |
1.08 (1.00-1.18) |
0.088 |
1.000 |
0.210 |
0.443 |
0.898 |
0.989 |
0.999 |
Cancer type-lung cancer |
||||||||
Homozygous |
2.66 (1.84-3.84) |
<0.001 |
0.001 |
<0.001 |
0.001 |
0.015 |
0.137 |
0.613 |
Recessive |
2.40 (1.71-3.37) |
<0.001 |
0.003 |
<0.001 |
0.001 |
0.013 |
0.114 |
0.564 |
Dominant |
1.49 (1.16-1.92) |
0.002 |
0.521 |
0.012 |
0.034 |
0.281 |
0.797 |
0.975 |
Allele comparison |
1.59 (1.33-1.91) |
<0.001 |
0.267 |
<0.001 |
<0.001 |
<0.001 |
0.003 |
0.026 |
Cancer type-oral cancer |
||||||||
Homozygous |
1.58 (1.01-2.46) |
0.043 |
0.409 |
0.239 |
0.485 |
0.912 |
0.991 |
0.999 |
-592A/C |
||||||||
All |
||||||||
Homozygous |
1.13 (1.00-1.28) |
0.055 |
1.000 |
0.141 |
0.330 |
0.844 |
0.982 |
0.998 |
Cancer type-lung cancer |
||||||||
Homozygous |
1.64 (1.19-2.24) |
0.002 |
0.287 |
0.019 |
0.055 |
0.392 |
0.867 |
0.985 |
Recessive |
1.52 (1.20-1.93) |
0.001 |
0.457 |
0.004 |
0.011 |
0.113 |
0.563 |
0.928 |
Dominant |
1.27 (1.01-1.60) |
0.043 |
0.921 |
0.122 |
0.294 |
0.821 |
0.979 |
0.998 |
Allele comparison |
1.27 (1.06-1.52) |
0.009 |
0.965 |
0.028 |
0.078 |
0.484 |
0.904 |
0.990 |
Cancer type-oral cancer |
||||||||
Homozygous |
1.58 (1.01-2.46) |
0.043 |
0.409 |
0.239 |
0.485 |
0.912 |
0.991 |
0.999 |
Cancer type-colorectal cancer |
||||||||
Homozygous |
0.58 (0.40-0.85) |
0.005 |
0.238 |
0.062 |
0.165 |
0.685 |
0.956 |
0.995 |
Heterozygous |
0.66 (0.53-0.83) |
<0.001 |
0.466 |
0.002 |
0.007 |
0.075 |
0.449 |
0.891 |
Dominant |
0.65 (0.52-0.80) |
<0.001 |
0.406 |
<0.001 |
0.001 |
0.012 |
0.105 |
0.541 |
Allele comparison |
0.72 (0.61-0.85) |
<0.001 |
0.818 |
<0.001 |
0.001 |
0.013 |
0.113 |
0.562 |
Control source-HB |
||||||||
Allele comparison |
1.07 (1.00-1.15) |
0.066 |
1.000 |
0.165 |
0.372 |
0.867 |
0.985 |
0.998 |
Quality score-low |
||||||||
Homozygous |
1.23 (1.02-1.49) |
0.034 |
0.979 |
0.095 |
0.240 |
0.777 |
0.972 |
0.997 |
Recessive |
1.21 (1.05-1.40) |
0.010 |
0.998 |
0.030 |
0.086 |
0.508 |
0.913 |
0.991 |
HCC: hepatocellular carcinoma; HB: hospital based.
aChi-square test was used to calculate the genotype frequency distributions.
bStatistical power was calculated using the number of observations in the subgroup and the OR and P values in this table.
DISCUSSION
In this meta-analysis, we comprehensively investigated the associations between three promoter variants (-1082A/G, -819T/C and -592A/C) in IL-10 gene and cancer risk in the Chinese population through 53 articles. The results revealed that all the three IL-10 gene polymorphisms we considered were associated with an increased overall cancer risk. Stratification analysis showed that the association between the -1082A/G polymorphism and cancer risk was more evident for hepatocellular carcinoma and low quality studies, the association between the -819T/C polymorphism and cancer risk was more obvious for lung cancer and oral cancer. However, the -592A/C polymorphism showed a statistically significant increased risk for lung cancer, oral cancer, hospital-based studies and low quality studies, but a decreased risk for colorectal cancer. To our knowledge, this is so far the first meta-analysis that has assessed multiple promoter polymorphisms in IL-10 gene with cancer risk in the Chinese population.
Three meta-analyses including international studies have investigated the association of IL-10 -1082A/G, -819T/C and -592A/C polymorphisms with overall cancer susceptibility. The study carried out by Wang et al. [92] analyzed IL-10 -1082A/G polymorphism, consisting 61 international studies with a total of 14,499 cases and 16,967 controls, in which no significant association was found between this polymorphism and overall cancer risk. Another meta-analysis [93] including 15,942 cases and 22,336 controls investigated IL-10 -819C/T polymorphism and cancer risk, without finding any significant association between this polymorphism and overall cancer risk. The study carried out by Ding et al. [94] considered IL-10 -592C/A polymorphism, in which a decreased risk of overall cancer was found with the AA genotype. Other meta-analyses with international studies have assessed the association between polymorphisms in IL-10 gene and susceptibility to some types of cancer. For example, two studies [95, 96] revealed no significant association between IL-10 -1082A/G, -819T/C and -592A/C polymorphisms with non-Hodgkin lymphoma susceptibility. Some of the significant associations found in the previous studies were not validated in our meta-analysis, for example, IL-10 -1082A/G polymorphism was associated with an increased lung cancer risk [92]. We also found some significant associations that were not observed in previous analyses. For instance, we found that IL-10 -592A/C polymorphism was associated with a decreased colorectal cancer risk. The discrepancy occurred because our analysis was carried out only in the Chinese population, suggesting that the polymorphisms on cancer risk might vary among different study subjects’ ethnicity or lifestyle factors.
To make our significant findings more noteworthy, FPRP analysis was performed. Interestingly, FPRP test results revealed that only the association between IL-10 -1082A/G polymorphism and overall cancer risk remained significant at the prior probability level of 0.1. In the subgroup analysis, only the low quality studies, lung cancer and colorectal cancer remained significant. Other findings were false-positive, which might be due to the limited sample size.
Our present meta-analysis has some highlights. First, it identified the significant association between IL-10 -1082A/G, -819T/C and -592A/C polymorphisms and an increased overall cancer risk in the Chinese population. Second, the quality of each included study was evaluated by the quality score criteria. Third, no publication bias was detected in the study, indicating the robustness of the results. Finally, the significant findings were further validated using the FPRP test, making the results more authentic. However, some possible limitations should be considered. First, the total sample size in each individual study was less than 1000 in all but four studies [69, 82, 85, 86], which might reflect a difficulty to evaluate the real association. Second, our results were based on unadjusted estimates, which might cause confounding bias. Third, in the subgroup analysis by cancer type, only two studies were included for some types of cancer, which might affect the detection of the real association. Finally, the potential gene-gene, and gene-environment interactions were not assessed due to the lack of information in the original studies.
In conclusion, this meta-analysis suggested an association between IL-10 gene polymorphisms and cancer risk in the Chinese population, especially for lung cancer, colorectal cancer and low quality studies. Well-designed studies with large sample size are required to verify our findings.
MATERIALS AND METHODS
Search strategy
A systematic literature search was conducted in PubMed, Embase, CNKI and Wanfang database using the following MeSH terms and their synonyms: (“interleukin-10” or “interleukin 10” or “IL-10” or “IL 10”) AND (“polymorphism, single nucleotide” [MeSH] or “SNP” or “single nucleotide polymorphism” or “polymorphism” or “variant” or “variation”) AND (“neoplasms” [MeSH] or “neoplasia” or “neoplasm” or “tumor” or “malignancy” or “cancer”), up to 19 January, 2017. In addition, review articles and references of the selected articles were manually searched to identify additional relevant articles. Only the most recent publications or the ones with most participants were included in the final meta-analysis in cases of overlapping data.
Inclusion and exclusion criteria
The inclusion criteria were as follows: (1) studies investigating the association between IL-10 -1082A/G, -819T/C and -592A/C polymorphisms with cancer risk in Chinese populations; (2) case-control studies; (3) studies providing sufficient data for calculation of ORs and 95% CIs. Studies were excluded if any of the following aspects existed: (1) not a case-control study; (2) duplicate publications; (3) studies without available genotype data; (4) review articles, meta-analyses, conference abstracts or editorial articles; and (5) genotype frequencies in the controls departure from HWE.
Data extraction
Two investigators independently extracted the relevant data from all included studies based on the inclusion criteria listed above. Disagreement was resolved by discussion with a third investigator. The following information was extracted from each included study: first author’s surname, publication year, cancer type, control source (hospital-based or population-based), genotyping methods, and number of cases and controls with different genotypes.
Quality assessment
Two independent investigators assessed the qualities of all included studies according to the criteria from a previous meta-analysis [97]. Quality scores of studies ranged from 0 (lowest) to 15 (highest), and the studies with scores > 9 were considered of high quality.
Statistical analysis
The strength of association between IL-10 -1082A/G, -819T/C and -592A/C polymorphisms and cancer risk was assessed by calculating the ORs and the corresponding 95% CIs. The pooled ORs were calculated for the homozygous model, heterozygous model, recessive model, dominant model and an allele comparison. The between-study heterogeneity was quantified by chi-square based Q test and the fixed-effects model (the Mantel-Haenszel method) [98] was used when no significant heterogeneity was observed (P > 0.1); otherwise, the random-effects model (the DerSimonian and Laird method) [99] was adopted. Subgroup analysis was performed by cancer type (if one cancer type contained less than two studies, it was merged into the “other cancers” group), control source (hospital-based studies and population-based studies), and quality scores (≤ 9 and > 9). Sensitivity analysis was performed to assess results stability. Publication bias was examined using Begg’s funnel plot and Egger’s linear regression test.
The FPRP was calculated to examine the significant associations found in the present meta-analysis. FPRP was calculated with 0.2 as a FPRP threshold and a prior probability of 0.1 was assigned to detect an OR of 0.67/1.50 (protective/risk effects) for an association with the genotypes under investigation [100]. FPRP values below threshold 0.2 were considered as noteworthy associations. All the statistical tests were performed using STATA version 12.0 (Stata Corporation, College Station, TX). All the P values were two-sided, and P < 0.05 were considered statistically significant.
Author contributions
Ping Wang, Junling An and Yanfeng Zhu performed the research study and collected the data; Ping Wang, Xuedong Wan and Hongzhen Zhang analyzed the data; Shoumin Xi and Sanqiang Li designed the research study; Ping Wang wrote the paper. All authors read and approve the final manucript.
ACKNOWLEDGMENTS
This work was supported by the Key Scientific and Technological Project of Henan province (Grant No. 162102310413).
CONFLICTS OF INTEREST
The authors declare no conflicts of interest.
REFERENCES
1. Torre LA, Bray F, Siegel RL, Ferlay J, Lortet-Tieulent J, Jemal A. Global cancer statistics, 2012. CA Cancer J Clin. 2015; 65:87-108.
2. Chen W, Zheng R, Baade PD, Zhang S, Zeng H, Bray F, Jemal A, Yu XQ, He J. Cancer statistics in China, 2015. CA Cancer J Clin. 2016; 66:115-132.
3. Pharoah PD, Dunning AM, Ponder BA, Easton DF. Association studies for finding cancer-susceptibility genetic variants. Nat Rev Cancer. 2004; 4:850-860.
4. O’Callaghan DS, O’Donnell D, O’Connell F, O’Byrne KJ. The role of inflammation in the pathogenesis of non-small cell lung cancer. J Thorac Oncol. 2010; 5:2024-2036.
5. Grivennikov SI, Greten FR, Karin M. Immunity, inflammation, and cancer. Cell. 2010; 140:883-899.
6. Terzić J, Grivennikov S, Karin E, Karin M. Inflammation and colon cancer. Gastroenterology. 2010; 138:2101-2114.
7. Grivennikov SI. Inflammatory cytokines in cancer: tumour necrosis factor and interleukin 6 take the stage. Ann Rheum Dis. 2011; 70:i104-i108.
8. Chen S, Kapturczak MH, Wasserfall C, Glushakova OY, Campbell-Thompson M, Deshane JS, Joseph R, Cruz PE, Hauswirth WW, Madsen KM. Interleukin 10 attenuates neointimal proliferation and inflammation in aortic allografts by a heme oxygenase-dependent pathway. Proc Natl Acad Sci U S A. 2005; 102:7251-7256.
9. Mocellin S, Marincola FM, Young HA. Interleukin-10 and the immune response against cancer: a counterpoint. J Leukocyte Biol. 2005; 78:1043-1051.
10. Howell WM, Rosezerilli MJ. Cytokine gene polymorphisms, cancer susceptibility, and prognosis. J Nutr. 2007; 137:194S-199S.
11. Turner DM, Williams DM, Sankaran D, Lazarus M, Sinnott PJ, Hutchinson IV. An investigation of polymorphism in the interleukin-10 gene promoter. Eur J Immunogenet. 1997; 24:1-8.
12. Kingo K, Rätsep R, Kõks S, Karelson M, Silm H, Vasar E. Influence of genetic polymorphisms on interleukin-10 mRNA expression and psoriasis susceptibility. J Dermatol Sci. 2005; 37:111-113.
13. Pooja S, Chaudhary P, Nayak LV, Rajender S, Saini KS, Deol D, Kumar S, Bid HK, Konwar R. Polymorphic variations in IL-1β, IL-6 and IL-10 genes, their circulating serum levels and breast cancer risk in Indian women. Cytokine. 2012; 60:122-128.
14. Lee JY, Kim HY, Kim KH, Kim SM, Jang MK, Park JY, Lee JH, Kim JH, Yoo JY. Association of polymorphism of IL-10 and TNF-A genes with gastric cancer in Korea. Cancer Lett. 2005; 225:207-214.
15. Jeong SW, Tae K, Lee SH, Kim KR, Park CW, Park BL, Shin HD. Cox-2 and IL-10 polymorphisms and association with squamous cell carcinoma of the head and neck in a Korean sample. J Korean Med Sci. 2010; 25:1024-1028.
16. Peddireddy V, Badabagni SP, Sulthana S, Kolla VK, Gundimeda SD, Mundluru H. Association of TNFα−308, IFNγ+874, and IL10-1082 gene polymorphisms and the risk of non-small cell lung cancer in the population of the South Indian state of Telangana. Int J Clin Oncol. 2016; 21:843-852.
17. Li Y, Chang SC, Goldstein BY, Scheider WL, Cai L, You NC, Tarleton HP, Ding B, Zhao J, Wu M, Jiang Q, Yu S, Rao J, et al. Green tea consumption, inflammation and the risk of primary hepatocellular carcinoma in a Chinese population. Cancer Epidemiol. 2011; 35:362-368.
18. Oh SS, Chang SC, Cai L, Cordon-Cardo C, Ding BG, Greenland S, He N, Jiang Q, Kheifets L, Le A, Lee YC, Liu S, Lu ML, et al. Single nucleotide polymorphisms of 8 inflammation-related genes and their associations with smoking-related cancers. Int J Cancer. 2010; 127:2169-2182.
19. Sun F, Sun Y, Zhang D, Zhang J, Song B, Zheng H. Association of interleukin-10 gene polymorphism with cachexia in Chinese patients with gastric cancer. Ann Clin Lab Sci. 2010; 40:149-155.
20. Liang X, Zhang J, Zhu Y, Lu Y, Zhou X, Wang Z, Yu J, Yan Y, Di L, Che L, Jiang H, Shao B, Wang X, et al. Specific genetic polymorphisms of IL10-592 AA and IL10-819 TT genotypes lead to the key role for inducing docetaxel-induced liver injury in breast cancer patients. Clin Transl Oncol. 2013; 15:331-334.
21. Lu XH, Mao GX, Zhang YY, Chu YS, Yuan HX, Zhu XQ. Association between variants of IL-8 and IL-10 genes, and efficacy of transcatheter arterial chemoembolization and subsequent prognosis in patients with liver cancer. Eur Rev Med Pharmacol Sci. 2015; 19:3218-3223.
22. Yuan C, Yip SP, Wu VW, Kwong DL, Cheuk IW, Ying M. Association between genetic polymorphisms and carotid atherosclerosis in patients treated with radiotherapy for nasopharyngeal carcinoma. Radiat Oncol. 2015; 10:39.
23. Wang YM, Li ZX, Tang FB, Zhang Y, Zhou T, Zhang L, Ma JL, You WC, Pan KF. Association of genetic polymorphisms of interleukins with gastric cancer and precancerous gastric lesions in a high-risk Chinese population. Tumor Biol. 2016; 37:2233-2242.
24. Nieters A, Yuan JM, Sun CL, Zhang ZQ, Stoehlmacher J, Govindarajan S, Yu MC. Effect of cytokine genotypes on the hepatitis B virus-hepatocellular carcinoma association. Cancer. 2005; 103:740-748.
25. Wang J, Ni H, Chen L, Song WQ. Interleukin-10 promoter polymorphisms in patients with hepatitis B virus infection or hepatocellular carcinoma in Chinese Han ethnic population. Hepatobiliary Pancreat Dis Int. 2006; 5:60-64.
26. Zhou SZ, Zhu WL, Li MY, Li HY, Zhang JR. [Association of single nucleotide polymorphism at interleukin-10 gene 1082 nt with the risk of gastric cancer in Chinese population]. [Article in Chinese]. Nan Fang Yi Ke Da Xue Xue Bao. 2008; 28:1335-1338.
27. Hosgood HD, Au WY, Kim HN, Liu J, Hu W, Tse J, Song B, Wong KF, Lee JJ, Chanock SJ, Siu LP, Purdue MP, Shin MH, et al. IL10 and TNF variants and risk of non-Hodgkin lymphoma among three Asian populations. Int J Hematol. 2013; 97:793-799.
28. Wang N, Wang L, Yang H, Zhang HQ, Lan B, He X, Jin TB, Kang LL, Chen C. Multiple genetic variants are associated with colorectal cancer risk in the Han Chinese population. Eur J Cancer Prev. 2015; 24:1-5.
29. Guo W, Wang N, Wang YM, Li Y, Wen DG, Chen ZF, He YT, Zhang JH. Interleukin-10 -1082 promoter polymorphism is not associated with susceptibility to esophageal squamous cell carcinoma and gastric cardiac adenocarcinoma in a population of high-incidence region of north China. World J Gastroenterol. 2005; 11:858-862.
30. Lu W, Pan K, Zhang L, Lin D, Miao X, You W. Genetic polymorphisms of interleukin (IL)-1B, IL-1RN, IL-8, IL-10 and tumor necrosis factor α and risk of gastric cancer in a Chinese population. Carcinogenesis. 2005; 26:631-636.
31. Deng WY, He LP, Peng XW. [The relationship among IL-10 gene polymorphisms, H elicobacter pylori and noncardia gastric cancer development in Fujian province]. [Article in Chinese]. Wei Chang Bing Xue He Gan Bing Xue Za Zhi. 2008; 17:212-214.
32. He XP, Wang LL, Zhao H, Wu D, Tang HD, Cao FL. [Association of interleukin-10 polymorphisms with susceptibility to ovarian cancer in Chinese Han population]. [Article in Chinese]. Zhongguo You Sheng Yu Yi Chuan Za Zhi. 2008; 16:37-38.
33. Zhou Y, Hu W, Zhuang W, Wu X. Interleukin-10 -1082 promoter polymorphism and gastric cancer risk in a Chinese Han population. Mol Cell Biochem. 2011; 347:89-93.
34. Bai DS, Ma D, Li O. [Study on IL-10 -1082G/A polymorphism in high risk-HPV 16, 18-associated cervical carcinoma in Tangshan]. [Article in Chinese]. Zhongguo Mei Tan Gong Ye Yi Xue Za Zhi. 2012; 15:1147-1149.
35. Yin YQ, Liu CJ, Zhang MM, Zhou Y. [Interleukin-10 -1082 promoter polymorphism and the risk of gastric cancer]. [Article in Chinese]. Sichuan Da Xue Xue Bao Yi Xue Ban. 2012; 43:378-381.
36. Jin T, Li X, Zhang J, Wang H, Geng T, Li G, Gao G, Chen C. Genetic association between selected cytokine genes and glioblastoma in the Han Chinese population. BMC Cancer. 2013; 13:236.
37. Tsai CW, Chang WS, Lin KC, Shih LC, Tsai MH, Hsiao CL, Yang MD, Lin CC, Bau DT. Significant association of Interleukin-10 genotypes and oral cancer susceptibility in Taiwan. Anticancer Res. 2014; 34:3731-3737.
38. Zeng YY, Chen XY, Tian KG, Ren HY, Li ZR, Zhao Q. [The correlation of interleukin-10 gene polymorphism and HPV infection and cervical lesions in Dongguan region]. [Article in Chinese]. Lin Chuang He Shi Yan Yi Xue Za Zhi. 2015; 14:636-639.
39. Ma B, Li L. [Interaction between H. pylori infection and IL-10-819C/T polymorphism in gastric cancer]. [Article in Chinese]. Zhonghua Pu Wai Ke Shou Shu Xue Za Zhi. 2016; 10:255-258.
40. Wu MS, Huang SP, Chang YT, Shun CT, Chang MC, Lin MT, Wang HP, Lin JT. Tumor necrosis factor-alpha and interleukin-10 promoter polymorphisms in Epstein-Barr virus-associated gastric carcinoma. J Infect Dis. 2002; 185:106-109.
41. Heneghan MA, Johnson PJ, Clare M, Ho S, Harrison PM, Donaldson PT. Frequency and nature of cytokine gene polymorphisms in hepatocellular carcinoma in Hong Kong Chinese. J Gastrointest Cancer. 2003; 34:19-26.
42. Shih CM, Lee YL, Chiou HL, Hsu WF, Chen WE, Chou MC, Lin LY. The involvement of genetic polymorphism of IL-10 promoter in non-small cell lung cancer. Lung Cancer. 2005; 50:291-297.
43. Wei YS, Kuang XH, Zhu YH, Liang WB, Yang ZH, Tai SH, Zhao Y, Zhang L. Interleukin-10 gene promoter polymorphisms and the risk of nasopharyngeal carcinoma. Tissue Antigens. 2007; 70:12-17.
44. Bai XL, Sun LP, Liu J, Chen W, Zhang Y, Yuan Y. [Correlation of interleukin-10-1082G/A single nucleotide polymorphism to the risk of gastric cancer in North China: a case-control study]. [Article in Chinese]. Ai Zheng. 2008; 27:35-40.
45. Hsing AW, Sakoda LC, Rashid A, Andreotti G, Chen J, Wang BS, Shen MC, Chen BE, Rosenberg PS, Zhang M. Variants in inflammation genes and the risk of biliary tract cancers and stones: a population-based study in China. Cancer Res. 2008; 68:6442-6452.
46. Hao MG, Wang WJ, Lu Y, Ying XP, Liu CZ, Hu XJ, Gao ZQ, Lu W. [Association of genetic polymorphism within promoter region of TNF-α, IL-1β and IL-10 with the susceptibility to lung cancer]. [Article in Chinese]. Huan Jing Yu Zhi Ye Yi Xue. 2009; 26:24-27.
47. Xiao H, Jiang Y, Li R, Xia B. [Association of IL-10 gen polymorphisms with gastroduodenal in Hubei Han population]. [Article in Chinese]. Zhonghua Yi Xue Yi Chuan Xue Za Zhi. 2009; 26:423-426.
48. Kong F, Liu J, Liu Y, Song B, Wang H, Liu W. Association of interleukin-10 gene polymorphisms with breast cancer in a Chinese population. J Exp Clin Cancer Res. 2010; 29:72.
49. Liu JJ, Gao YT, Du Z, Yang B, Jing X, Wang YJ, Wang FM, Liu T. [Relationship between IL-10 gene promoter polymorphisms and outcome of hepatitis B virus infection]. [Article in Chinese]. Shijie Huaren Xiao Hua Za Zhi. 2010; 18:1656-1663.
50. Niu WQ. [The study on the association between the IL-10 promoter genetic polymorphisms and prostate cancer in Hubei Hans population]. [Article in Chinese]. Guoji Jian Yan Yi Xue Za Zhi. 2011; 32:42-43.
51. Wang Q, Zhang C, Walayat S, Chen HW, Wang Y. Association between cytokine gene polymorphisms and cervical cancer in a Chinese population. Eur J Obstet Gyn R B. 2011; 158:330-333.
52. He B, Pan Y, Xu Y, Nie Z, Chen L, Gu L, Wang S. Increased risk for gastric cancer in carriers of the lymphotoxin-α+252G variant infected by Helicobacter pylori. Genet Test Mol Bioma. 2012; 16:9-14.
53. Chang JS, Lo HI, Wong TY, Huang CC, Lee WT, Tsai ST, Chen KC, Yen CJ, Wu YH, Hsueh WT, Yang MW, Wu SY, Chang KY, et al. Investigating the association between oral hygiene and head and neck cancer. Oral Oncol. 2013; 49:1010-1017.
54. Chen ZG, Zhou W, Dai GJ, Wu ZG, Jin R. [Association between the interaction polymorphisms of interleukin-10 and smoking on patients with bladder cancer risk from a case-control study]. [Article in Chinese]. Zhonghua Liu Xing Bing Xue Za Zhi. 2013; 34:183-186.
55. Du WP, Ye WJ, Chen MH, Li D, Jing XA. [Association research between polymorphism of IFN-γ and IL-10, environmental risk factors, and susceptibility to esophageal cancer]. [Article in Chinese]. Wei Sheng Yan Jiu. 2013; 42:770-776.
56. Pan XF, Yang SJ, Loh M, Xie Y, Wen YY, Tian Z, Huang H, Lan H, Chen F, Soong R, Yang CX. Interleukin-10 gene promoter polymorphisms and risk of gastric cancer in a Chinese population: single nucleotide and haplotype analyses. Asian Pac J Cancer P. 2013; 14:2577-2582.
57. Cheng S, Li J, Liu W, Liu C, Su L, Liu X, Guo L, Ma Y, Song B, Liu J. LTA + 252A > G polymorphism is associated with risk of nasal NK/T-cell lymphoma in a Chinese population: a case-control study. BMC Cancer. 2015; 15:480.
58. Fei C, Yao XM, Sun Y, Gu XZ, Yu LQ, Lai X. Interleukin-10 polymorphisms associated with susceptibility to acute myeloid leukemia. Genet Mol Res. 2015; 14:925-930.
59. Hsu HJ, Yang YH, Shieh TY, Chen CH, Kao YH, Yang CF, Ko EC. TGF-beta1 and IL-10 single nucleotide polymorphisms as risk factors for oral cancer in Taiwanese. Kaohsiung J Med Sci. 2015; 31:123-129.
60. Yang Y, Fa X. Role of IL-10 gene polymorphisms on the susceptibility for esophageal cancer and its association with environmental factors. Int J Clin Exp Pathol. 2015; 8:9580-9585.
61. Bai CY, Shi XY, He J, Xue J, Feng Y. Association between IL-10 genetic variations and cervical cancer susceptibility in a Chinese population. Genet Mol Res 2016; 15. doi: 10.4238/gmr.15038116.
62. Cai J, Zhang Z. An analysis of IL-10/IL-10R genetic factors related to risk of colon cancer and inflammatory bowel disease in a Han Chinese population. Clin Lab. 2016; 62:1147-1154.
63. Peng MW, Lu SQ, Liu J, Dong CY. Role of IL-10 polymorphisms in susceptibility to hepatitis B virus-related hepatocellular carcinoma. Genet Mol Res. 2016; 15. doi: 10.4238/gmr.15017984.
64. Wu MS, Wu CY, Chen CJ, Lin MT, Shun CT, Lin JT. Interleukin-10 genotypes associate with the risk of gastric carcinoma in Taiwanese Chinese. Int J Cancer. 2003; 104:617-623.
65. Savage SA, Abnet CC, Haque K, Mark SD, Qiao YL, Dong ZW, Dawsey SM, Taylor PR, Chanock SJ. Polymorphisms in interleukin -2, -6, and -10 are not associated with gastric cardia or esophageal cancer in a high-risk Chinese population. Cancer Epidem Biomar. 2004; 13:1547-1549.
66. Yao JG, Gao LB, Liu YG, Li J, Pang GF. Genetic variation in interleukin-10 gene and risk of oral cancer. Clin Chim Acta. 2008; 388:84-88.
67. Liu J, Song B, Bai X, Liu W, Li Z, Wang J, Zheng Y, Wang Z. Association of genetic polymorphisms in the interleukin-10 promoter with risk of prostate cancer in Chinese. BMC Cancer. 2010; 10:456.
68. Su SP, Yang ZB, Tian YL, Xiang Y, Wu M, Ma XJ. [Relationship between polymorphisms of IL-1β-31, IL-10-819 and TNF-α-1031 genes and susceptibilities to H. pylori infection-associated gastric ulcer and cancer]. [Article in Chinese]. Chin J Biologicals. 2010; 23:517-520.
69. Bei CH, Qiu XQ, Zeng XY, Yang Y, Huang JM, Fan XJ. [Association of interleukin-10 gene polymorphism with hepatocellular carcinoma]. [Article in Chinese]. Zhongguo Gong Gong Wei Sheng. 2011; 27:309-311.
70. Liu J, Song B, Wang JL, Li ZJ, Li WH, Wang ZH. Polymorphisms of interleukin-10 promoter are not associated with prognosis of advanced gastric cancer. World J Gastroenterol. 2011; 17:1362-1367.
71. He JR, Chen LJ, Su Y, Cen YL, Tang LY, Yu DD, Chen WQ, Wang SM, Song EW, Ren ZF. Joint effects of Epstein-Barr virus and polymorphisms in interleukin-10 and interferon-gamma on breast cancer risk. J Infect Dis. 2012; 205:64-71.
72. Yuan LJ, Jin TB, Yin JK, Du XL, Wang Q, Dong R, Wang SZ, Cui Y, Chen C, Lu JG. Polymorphisms of tumor-related genes IL-10, PSCA, MTRR and NOC3L are associated with the risk of gastric cancer in the Chinese Han population. Cancer Epidemiol. 2012; 36:e366-e372.
73. Zeng X, Li Y, Liu T, Zhang J. Diverse H. pylori strains, IL-10 promoter polymorphisms with high morbidity of gastric cancer in Hexi area of Gansu Province, China. Mol Cell Biochem. 2012; 362:241-248.
74. Yao CJ, Du W, Chen HB, Xiao S, Wang CH, Fan ZL. Associations of IL-10 gene polymorphisms with acute myeloid leukemia in Hunan, China. Asian Pac J Cancer P. 2013; 14:2439-2442.
75. Zhang YM, Mao YM, Sun YX. Genetic polymorphisms of IL-6 and IL-10 genes correlate with lung cancer in never-smoking Han population in China. Int J Clin Exp Med. 2015; 8:1051-1058.
76. Cui Y, Zhu JJ, Ma CB, Cui K, Wang F, Ni SH, Zhang ZY. Interleukin 10 gene -1082A/G polymorphism is associated with osteosarcoma risk and poor outcomes in the Chinese population. Tumor Biol. 2016; 37:4517-4522.
77. Li L, Ye LM, Li Y. Investigation on the association between IL-10 C819T gene polymorphisms and susceptibility to gastric cancer. J Digest Dis. 2016; 17:117-118.
78. Tseng LH, Lin MT, Shau WY, Lin WC, Chang FY, Chien KL, Hansen JA, Chen DS, Chen PJ. Correlation of interleukin-10 gene haplotype with hepatocellular carcinoma in Taiwan. Tissue Antigens. 2006; 67:127-133.
79. Xiong XD, Lu SX, Zeng LQ, Chen MJ, Yang ZH, Luo XP, Liu XG. [Relationship between IL-10-592A>C promoter polymorphism and the susceptibility to cervical cancer]. [Article in Chinese]. Zhongguo You Sheng Yu Yi Chuan Za Zhi. 2010; 18:46-48.
80. Liang HG, Zhao-Ran FU, Xi-Ming QI. [Relationship between the genetic polymorphism in Interleukin-10-592C/A and susceptibility to non-small cell lung cancer]. [Article in Chinese]. Zhongguo Xian Dai Yi Xue Za Zhi. 2011; 21:189-193.
81. Yu XM, Ma D, Wu SQ, Guan WJ, Feng FM, Gao HX, Li O. [Relationship between polymorphisms of IL-10 gene and cervical cancer]. [Article in Chinese]. Zhonghua Yi Yuan Gan Ran Xue Za Zhi. 2011; 21:239-241.
82. Zhang Y, Wang MY, He J, Wang JC, Yang YJ, Jin L, Chen ZY, Ma XJ, Sun MH, Xia KQ, Hong XN, Wei QY, Zhou XY. Tumor necrosis factor-alpha induced protein 8 polymorphism and risk of non-Hodgkin's lymphoma in a Chinese population: a case-control study. PLoS One. 2012; 7:e37846.
83. Sun JM, Li Q, Gu HY, Chen YJ, Wei JS, Zhu Q, Chen L. Interleukin 10 rs1800872 T>G polymorphism was associated with an increased risk of esophageal cancer in a Chinese population. Asian Pac J Cancer P. 2013; 14:3443-3447.
84. Tsai CW, Tsai MH, Shih LC, Chang WS, Lin CC, Bau DT. Association of interleukin-10 (IL10) promoter genotypes with nasopharyngeal carcinoma risk in Taiwan. Anticancer Res. 2013; 33:3391-3396.
85. Bei CH, Bai H, Yu HP, Yang Y, Liang QQ, Deng YY, Tan SK, Qiu XQ. Combined effects of six cytokine gene polymorphisms and SNP-SNP interactions on hepatocellular carcinoma risk in Southern Guangxi, China. Asian Pac J Cancer P. 2014; 15:6961-6967.
86. Hsia TC, Chang WS, Liang SJ, Chen WC, Tu CY, Chen HJ, Yang MD, Tsai CW, Hsu CM, Tsai CH, Bau DT. Interleukin-10 (IL-10) promoter genotypes are associated with lung cancer risk in Taiwan males and smokers. Anticancer Res. 2014; 34:7039-7044.
87. Kuo WH, Huang CY, Fu CK, Hsieh YH, Liao CH, Hsu CM, Huang YK, Tsai CW, Chang WS, Bau DT. Effects of interleukin-10 polymorphisms and smoking on the risk of gastric cancer in Taiwan. In Vivo. 2014; 28:967-971.
88. Yu Y, Zheng S, Zhang S, Jin W, Liu H, Jin M, Chen Z, Ding Z, Wang L, Chen K. Polymorphisms of inflammation-related genes and colorectal cancer risk: a population-based case-control study in China. Int J Immunogenet. 2014; 41:289-297.
89. Yin J, Wang X, Wei J, Wang L, Shi Y, Zheng L, Tang W, Ding G, Liu C, Liu R, Chen S, Xu Z, Gu H. Interleukin 12B rs3212227 T > G polymorphism was associated with an increased risk of gastric cardiac adenocarcinoma in a Chinese population. Dis Esophagus. 2015; 28:291-298.
90. Chang WS, Liao CH, Tsai CW, Hu PS, Wu HC, Hsu SW, Ji HX, Hsiao CL, Bau DT. The role of IL-10 promoter polymorphisms in renal cell carcinoma. Anticancer Res. 2016; 36:2205-2209.
91. Ma B, Zhang TY, Wan Y, Zhan FS. [A case-control study of interleukin-10 gene -592A/C polymorphism and the risk of gastric cancer]. [Article in Chinese]. Ningxia Yi Xue Za Zhi. 2016; 38:580-582.
92. Wang J, Ding Q, Shi Y, Cao Q, Qin C, Zhu J, Chen J, Yin C. The interleukin-10-1082 promoter polymorphism and cancer risk: a meta-analysis. Mutagenesis. 2012; 27:305-312.
93. Yu Z, Liu Q, Huang C, Wu M, Li G. The interleukin 10 -819C/T polymorphism and cancer risk: a HUGE review and meta-analysis of 73 studies including 15,942 cases and 22,336 controls. Omics. 2013; 17:200-214.
94. Ding Q, Shi Y, Fan B, Fan Z, Ding L, Li F, Tu W, Jin X, Wang J. The interleukin-10 promoter polymorphism rs1800872 (-592C>A), contributes to cancer susceptibility: meta-analysis of 16,785 cases and 19,713 controls. PLoS One. 2013; 8:e57246.
95. Zhang T, Xie S, Zhu JH, Li QW, He J, Zeng AP. Association of IL10 -819C>T and -592C>A polymorphisms with non-Hodgkin lymphoma susceptibility: evidence from published studies. J Cancer. 2015; 6:709-716.
96. Zhang Y, Xia ZG, Zhu JH, Chen MB, Wang TM, Shen WX, He J. Association of Interleukin-10 -3575T>A and -1082A>G polymorphisms with non-Hodgkin lymphoma susceptibility: a comprehensive review and meta-analysis. Mol Genet Genomics. 2015; 290:2063-2073.
97. He J, Liao XY, Zhu JH, Xue WQ, Shen GP, Huang SY, Chen W, Jia WH. Association of MTHFR C677T and A1298C polymorphisms with non-Hodgkin lymphoma susceptibility: evidence from a meta-analysis. Sci Rep. 2014; 4:6159.
98. Mantel N, Haenszel W. Statistical aspects of the analysis of data from retrospective studies of disease. J Natl Cancer Inst. 1959; 22:719-748.
99. Dersimonian R, Laird N. Meta-analysis in clinical trials. Control Clin Trials. 1986; 7:177-188.
100. He J, Wang MY, Qiu LX, Zhu ML, Shi TY, Zhou XY, Sun MH, Yang YJ, Wang JC, Jin L. Genetic variations of mTORC1 genes and risk of gastric cancer in an eastern Chinese population. Mol Carcinogen. 2013; 52:70-79.