
INTRODUCTION
Tartrate-resistant acid phosphatase (TRACP) isoforms 5a and 5b are expressed in monocytes during inflammation, and TRACP-5b is a biomarker for osteoclast activity and has been correlated with osteolytic responses, bone resorption, and bony metastases [1-5]. In contrast, TRACP-5a has been identified as a biomarker for cancer cachexia, metastatic breast cancer progression, end-stage renal disease, rheumatoid arthritis, and sarcoidosis [6-10] and as a potential risk factor for cardiovascular disease [11].
Multiple biomarkers are under investigation for their correlations with cardiovascular complications of metabolic syndrome (MetS) [12-19]. Documented inflammatory markers include interleukin-6 (IL-6), high sensitivity C-reactive protein (CRP), procalcitonin, calprotectin, and osteocalcin [12, 13, 15, 17, 19, 20]. Among these, CRP levels are strongly associated with cardiovascular risk [13, 19, 21, 22], but are sensitive to infection and various clinical and subclinical inflammatory reactions. In contrast, TRACP-5a may be a more specific biomarker for chronic inflammatory responses associated with MetS [8-11].
MetS is an aggregate of cardiovascular risk factors, including hypertension, obesity, dyslipidemia, and blood glucose intolerance [21, 23-26]. Patients with MetS are defined by the presence of at least three of the following characteristics based on the revised National Cholesterol Education Program’s Adult Treatment Panel III [27]: (1) systolic blood pressure (SBP) ≥ 130 mmHg or diastolic blood pressure (DBP) ≥ 85 mmHg; (2) waist circumference ≥ 90 cm in males or ≥ 80 cm in females; (3) high-density lipoprotein (HDL) < 40 mg/dL (1.03 mmol/L) in males or < 50 mg/dl (1.29 mmol/L) in females; (4) fasting glucose ≥ 100 mg/dl (5.6 mmol/L); and (5) triglyceride levels ≥ 150 mg/dL (1.7 mmol/L). Recent studies have correlated cardiovascular events and MetS with chronic subclinical inflammatory responses [22, 28], potentially reflecting increased oxidative stress due to dyslipidemia and insulin resistance, and the ensuing monocyte-associated vascular endothelial damage. In this study, we investigated TRACP-5a as an independent risk factor for MetS.
RESULTS
Demographic characteristics
Demographic characteristics of the 100 participants were stratified by sex and are presented in Table 1. The male to female ratio was 88:12, and twenty-two participants met the criteria for MetS. Components and distributions of MetS between male and female subjects were similar, except that blood pressure was predominantly higher in the male group. Age, body mass index, fasting glucose levels, and lipid profiles did not differ significantly between male and female study groups (p > 0.05).
Table 1: Demographic characteristics and metabolic syndrome components of the 100 study participants
Variables, mean(SD) |
Male (N = 88) |
Female (N = 12) |
P-value |
|---|---|---|---|
MetS, n(%) |
19(21.6) |
3(25) |
0.723* |
Age |
27.79(4.05) |
26.97(2.27) |
0.466 |
SBP |
121.5(14.3) |
110.9(9.80) |
<0.05† |
DBP |
78.34(10.1) |
70.08(8.32) |
<0.05† |
Body mass index |
27.79(4.05) |
26.97(2.27) |
0.307 |
Waist circumference (cm) |
87.36(10.1) |
82.25(8.72) |
0.081 |
Triglyceride (mg/dL) |
114.8(58.5) |
92.42(50.3) |
0.177 |
High-density lipoprotein (mg/dL) |
44.45(9.66) |
52.08(14.5) |
0.102 |
Fasting glucose (mg/dL) |
94.25(10.5) |
91.08(5.48) |
0.116 |
IL-6 (pg/mL) |
3.41(16.2) |
1.40(3.51) |
0.670 |
CRP (mg/dL) |
1.53(1.68) |
1.97(1.48) |
0.385 |
TRACP-5a (μg/L) |
6.63(2.38) |
4.99(2.13) |
0.026† |
*Fisher’s exact test, †p < 0.05.
SD, standard deviation; SBP, systolic blood pressure; DBP, diastolic blood pressure.
C-statistics of MetS predictive inflammatory markers
Ranges of IL-6, CRP, and TRACP-5a levels are presented in Table 2, and receiver operating characteristic curves are shown in Figure 1. After applying c-statistics, the area under the curve for TRACP-5a was 0.730 (p = 0.001, 95% CI, 0.618–0.842) and those of CRP and IL-6 were 0.693 (p = 0.006, 95% CI, 0.587–0.799) and 0.563 (p = 0.369, 95% CI, 0.430–0.696). The optimal cut-off point for TRACP-5a and CRP levels were 5.8005 μg/L and 0.7604 mg/dL, respectively.
Table 2: C-statistics for the risk of metabolic syndrome using inflammatory biomarkers
Inflammatory markers |
Sensitivity |
Specificity |
Cut-off point |
C-statistic (95% C.I.) |
P-value |
|---|---|---|---|---|---|
IL-6 (pg/mL) |
0.682 |
0.474 |
0.2055 |
0.563 (0.430-0.696) |
0.369 |
CRP (mg/dL) |
0.864 |
0.590 |
0.7604 |
0.693 (0.587-0.799) |
0.006† |
TRACP-5a (μg/L) |
0.864 |
0.551 |
5.8005 |
0.730 (0.618-0.842) |
0.001† |
†p < 0.01.
The best deterministic value is a C-statistic (area under curve) of 1.
IL-6, Interleukin-6; TRACP-5a, tartrate-resistant acid phosphatase isoform 5a; CRP, C-reactive protein; C.I., confidence interval.
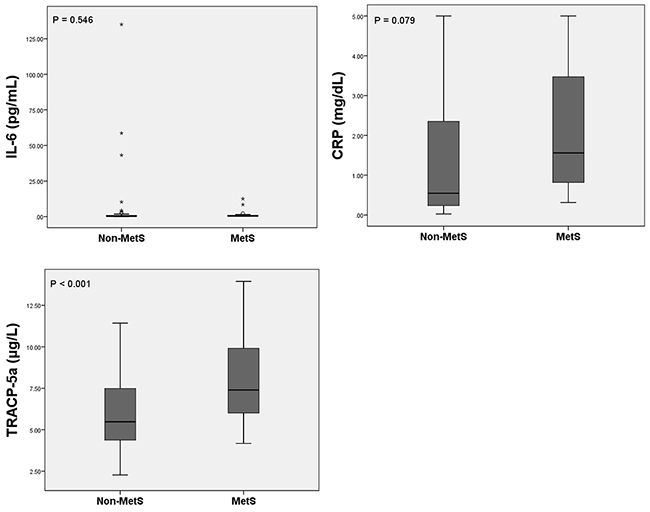
Figure 1: Receiver operating characteristic curves of inflammatory biomarkers of MetS. IL-6, interleukin-6; TRACP-5a, tartrate-resistant acid phosphatase isoform 5a.
Comparison of MetS to non-MetS patients
Although fasting glucose levels did not differ significantly between MetS and non-MetS subjects (p = 0.069), systolic blood pressure (p = 0.032), diastolic blood pressure (p = 0.001), waist circumference (p = 0.002), triglyceride levels (p < 0.001), and HDL levels (p < 0.001) differed significantly. IL-6 (p = 0.546) and CRP levels (p = 0.079) did not differ between patients with and without MetS, whereas TRACP-5a levels were significantly higher in subjects with MetS (p < 0.001; Figure 2, Table 3). No significant differences in blood urea nitrogen, creatinine, aspartate aminotransferase (AST), alanine aminotransferase (ALT), fasting glucose, and uric acid levels, or other blood cell parameters were identified between MetS and non-MetS patients.
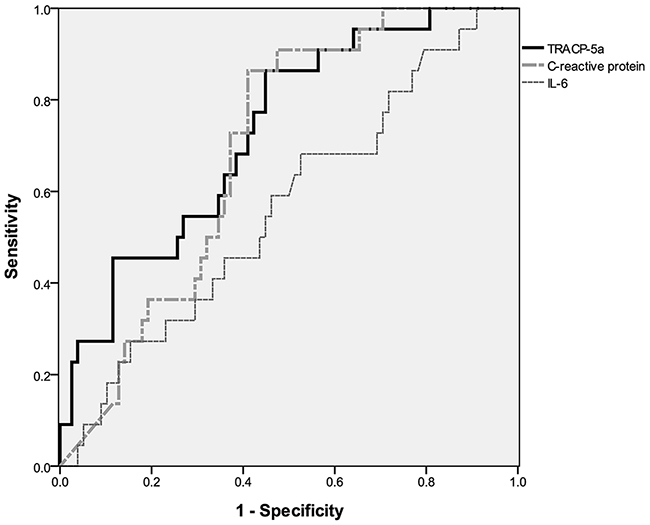
Figure 2: Serum TRACP-5a levels are significantly higher in participants with metabolic syndrome. MetS, metabolic syndrome; IL-6, interleukin-6; CRP, C-reactive protein; TRACP-5a, tartrate-resistant acid phosphatase isoform 5a.
Table 3: Comparison of the components of metabolic syndrome and TRACP-5a classificationsystems
Variables, mean (SD) |
(A) Metabolic syndrome (MetS) |
(B) TRACP-5a |
||||
|---|---|---|---|---|---|---|
Non-MetS |
MetS |
P-value |
≤ 5.8(μg/L) |
> 5.8(μg/L) |
P-value |
|
N = 78 |
N = 22 |
N = 46 |
N = 54 |
|||
Metabolic syndrome, n (%) |
- |
- |
N/A |
3 (6.52%) |
19 (35.2%) |
<0.001‡ |
Age (years) |
30.18 (6.85) |
36.45 (7.46) |
<0.001‡ |
30.63 (7.48) |
32.35 (7.35) |
0.250 |
Body height |
172.7 (7.12) |
170.9 (7.86) |
0.308 |
171.8 (7.61) |
172.7 (7.04) |
0.522 |
Body weight (kg) |
80.99 (12.0) |
86.09 (12.5) |
0.085 |
79.87 (12.4) |
84.02 (11.9) |
0.092 |
Systolic blood pressure (mmHg) |
118.6 (13.7) |
125.9 (14.6) |
0.032* |
116.7 (11.6) |
123.2 (15.5) |
0.021* |
Diastolic blood pressure (mmHg) |
75.56 (9.33) |
83.68 (10.8) |
0.001† |
73.83 (8.69) |
80.35 (10.5) |
0.001† |
Waist circumference |
85.11 (9.88) |
92.55 (8.46) |
0.002† |
84.39 (10.4) |
88.75 (9.31) |
0.030* |
Serological exams |
||||||
Total cholesterol (mg/dL) |
167.5 (30.1) |
191.0 (28.7) |
0.001† |
166.0 (33.1) |
178.4 (28.6) |
0.047* |
Triglyceride (mg/dL) |
93.68 (38.7) |
177.3 (67.3) |
<0.001‡ |
93.28 (44.6) |
128.1 (63.0) |
0.002† |
High-density lipoprotein (mg/dL) |
47.22 (9.66) |
38.80 (11.2) |
<0.001‡ |
48.11 (11.6) |
43.03 (9.05) |
0.016* |
Low-density lipoprotein (mg/dL) |
108.1 (29.1) |
128.0 (25.9) |
0.005† |
104.7 (30.1) |
119.1 (27.4) |
0.014* |
Fasting glucose (mg/dL) |
93.00 (9.01) |
97.32 (12.8) |
0.069 |
92.04 (9.80) |
95.43 (10.1) |
0.094 |
Inflammatory markers |
||||||
IL-6 |
3.659 (17.2) |
1.425 (3.04) |
0.546 |
1.583(8.59) |
4.517(19.1) |
0.339 |
CRP |
1.429 (1.64) |
2.130 (1.61) |
0.079 |
1.336(1.53) |
1.794(1.74) |
0.169 |
TRACP-5a |
5.986 (2.18) |
8.013 (2.54) |
<0.001‡ |
- |
- |
N/A |
*p < 0.05, †p < 0.01, ‡p < 0.001.
TRACP-5a, tartrate-resistant acid phosphatase isoform 5a; SD, standard deviation; IL-6, interleukin-6; CRP, C-reactive protein.
In subsequent c-statistics analyzes, participants were classified in terms of MetS risk according to a TRACP-5a cut-off level of 5.8 μg/L. This cut-off point was accompanied by significant differences in AST and ALT levels, white blood cell counts, red blood cell counts, and hemoglobin levels. Moreover, blood pressure, waist circumference, and lipid profiles corresponded significantly with TRACP-5a levels.
Elevated TRACP-5a was associated with increased risk of MetS
In further analyses, binary logistic regression models were used to adjust parameters between MetS and non-MetS groups and to determine the risk of MetS (Table 4). Based on the data in Table 3 (column A), we controlled factors that differed significantly between MetS and non-MetS groups. In regression model 1, age, total cholesterol, and low-density lipoprotein (p = 0.007, 95% CI, 1.097 to 1.809) were covariates, whereas regression model 2 included the inflammatory parameters in model 1 with SBP, DBP, waist circumference, triglyceride, HDL, and fasting glucose (p = 0.012, 95% CI, 1.148–3.013). In models 1 and 2, single unit increases in TRACP-5a levels correlated with 1.409- and 1.860-fold increases in the risk for MetS. In contrast, IL-6 and CRP levels were not predictive of the risk for MetS.
Table 4: Binary regression models of MetS predictive inflammatory markers
Variables |
(A) Metabolic syndrome |
|||
|---|---|---|---|---|
Model 1 |
Model 2 |
|||
OR (95% CI) |
P-value |
OR (95% CI) |
P-value |
|
IL-6 |
0.989 (0.935, 1.046) |
0.697 |
0.997 (0.901, 1.103) |
0.955 |
CRP |
1.097 (0.787, 1.531) |
0.584 |
0.984 (0.593, 1.635) |
0.951 |
TRACP-5a |
1.409 (1.097, 1.809) |
0.007† |
1.860 (1.148, 3.013) |
0.012* |
Variables of Table 3, column (A) that reached statistically significance were controlled by the binary regression model.
*p < 0.05, †p < 0.01.
Model 1, age + total cholesterol + low-density lipoprotein.
Model 2, Model 1 + the metabolic syndrome components systolic blood pressure, diastolic blood pressure, waist circumference, triglyceride, high-density lipoprotein, and fasting glucose.
IL-6, interleukin-6; CRP, C-reactive protein; TRACP-5a, tartrate-resistant acid phosphatase isoform 5a; CI, confidence interval; OR, odds ratio.
Elevated blood sugar and triglyceride levels are associated with increments in TRACP-5a
We used linear regression models to identify MetS components that influence serum TRACP-5a concentrations (Table 5). In these analyzes, model 1 included sex only, model 2 included model 1 with AST, ALT, and uric acid levels, and model 3 comprised the parameters of model 2 with white and red blood cell counts and hemoglobin levels. After controlling for significant parameters from the TRACP-5a group (Table 3, column B), MetS components were not cumulatively associated with TRACP-5a levels until the total number of MetS components was ≥3 (Table 5), indicating that the presence of MetS is an independent predictor of TRACP-5a levels. However, further analyses of the effects of each component on TRACP-5a levels showed that impaired glucose tolerance and excess triglyceride levels are crucial determinants of TRACP-5a levels (p = 0.006 and p = 0.031, respectively).
Table 5: Linear regression analyzes of MetS components that are predictive of TRACP-5a levels (μg/L)
Variables |
(B) TRACP-5a level |
|||||
|---|---|---|---|---|---|---|
Model 1 |
Model 2 |
Model 3 |
||||
β (95% CI) |
P-value |
β (95% CI) |
P-value |
β (95% CI) |
P-value |
|
Numbers of MetS components |
||||||
0 |
−0.859 (−2.096, 0.378) |
0.171 |
−0.362 (−1.585, 0.862) |
0.559 |
−0.265 (−1.501, 0.970) |
0.671 |
1 |
−0.844 (−1.837, 0.149) |
0.095 |
−0.641 (−1.586, 0.304) |
0.181 |
−0.487 (−1.473, 0.500) |
0.330 |
2 |
−0.239 (−1.273, 0.794) |
0.647 |
−0.591 (−1.576, 0.395) |
0.237 |
−0.876 (−1.879, 0.126) |
0.086 |
≥3 (Metabolic syndrome) |
2.062 (1.008, 3.116) |
<0.001‡ |
1.821 (0.801, 2.841) |
<0.001‡ |
1.771 (0.753, 2.788) |
<0.001‡ |
Factors of metabolic syndrome |
||||||
Central obesity |
−0.254 (−1.219, 0.710) |
0.602 |
−0.395 (−1.320, 0.530) |
0.399 |
−0.488 (−1.413, 0.437) |
0.298 |
Low HDL level |
0.404 (−0.591, 1.399) |
0.422 |
0.429 (−0.535, 1.392) |
0.379 |
0.274 (−0.692, 1.240) |
0.574 |
Elevated blood pressure |
1.284 (0.317, 2.250) |
0.010† |
1.108 (0.174, 2.042) |
0.021* |
0.938 (−0.010, 1.886) |
0.052 |
High TG level |
1.747 (0.669, 2.825) |
0.002† |
1.299 (0.226, 2.372) |
0.018* |
1.196 (0.115, 2.277) |
0.031* |
High blood sugar |
2.017 (0.886, 3.149) |
<0.001‡ |
1.520 (0.351, 2.689) |
0.011* |
1.660 (0.489, 2.831) |
0.006† |
The definition for the factors of metabolic syndrome is consistent with the revised National Cholesterol Education Program’s Adult Treatment Panel III. Variables of Table 3, column (B) that reached statistically significance were adjusted by the linear regression model.
*p < 0.05, †p < 0.01, ‡p < 0.001.
Model 1, sex.
Model 2, Model 1 + (AST, ALT, uric acid).
Model 3, Model 2 + (white blood cell, red blood cell, hemoglobin).
HDL, high-density lipoprotein; TG, triglyceride; AST, aspartate aminotransferase; ALT, alanine aminotransferase.
DISCUSSION
TRACP-5a is a monocyte-derived specific biomarker for chronic inflammatory responses and has been correlated with cardiovascular disease. TRACP-5a is also reported to be a biomarker for many benign or malignant diseases [6-10]. Chen et al. reported that the serum TRACP-5a level lower than 12.4 μg/L had better survival for metastatic breast cancer [7]. The serum TRACP-5a level also elevated significantly in active sarcoidosis compared with control group (11.66 versus 8.04 μg/L) [8]. Meanwhile, TRACP-5a levels were elevated in end-stage renal disease and rheumatoid arthritis in Janckila’s study [9, 10].
However, circulating monocytes do not secrete TRACPs prior to differentiation into macrophages [11]. Accordingly, we hypothesized that serum TRACP-5a levels are associated with MetS, which is a cluster of cardiovascular risk factors. In this prospective study, we demonstrated a significant association between MetS and TRACP-5a levels and revealed the underlying mechanisms. Specifically, serum TRACP-5a levels were correlated with elevated blood pressure, hyperlipidemia, and insulin resistance, and the TRACP-5a biomarker cut-off value of 5.8 μg/L was defined as indicative of higher MetS risk using c-statistics.
Previous studies have shown that cardiovascular disease is initiated by endothelial damage and consequent release of cytokines. These molecules (1) induce circulating monocyte adherence and transformation into macrophages, (2) induce lipid ingestion and aggregation within foam cells, and (3) transform foam cells into atherosclerotic plaques [29]. Traditional risk factors for cardiovascular disease include sex, age, smoking history, hypertension, dyslipidemia, insulin resistance, and central obesity [30]. In addition, it is well documented that cardiovascular events and MetS are strongly associated with chronic inflammation [22, 31, 32].
In the present comparisons of MetS and non-MetS patient groups, TRACP-5a levels differed significantly, whereas IL-6 and CRP levels did not. In addition, among the present parameters, only age differed significantly between MetS and non-MetS groups. These data are in agreement with a previous cohort study of females showing that serum TRACP-5a levels increase with age [33]. However, age and TRACP-5a levels were not significantly correlated according to Pearson’s coefficient (r = 0.192, p = 0.055), suggesting that increasing age is not strongly associated with differences in TRACP-5a levels between MetS and non-MetS patients.
AST, ALT, and uric acid levels, white and red blood cell counts, and hemoglobin levels were significantly stratified at the TRACP-5a cut-off of 5.8 μg/L (Table 3). However, in the present linear regression models of TRACP-5a levels, none of these parameters were significant independent correlates (p > 0.05 of β coefficient in each regression model). However, among patients that met at least three criteria for MetS, these variables were correlated with TRACP-5a levels (Table 5).
After controlling for other variables, elevated triglyceride and blood sugar were predictive of TRACP-5a levels. Insulin resistance has been associated with both serum IL-6 and CRP levels in previous studies [34-36], and concomitant improvements (reductions) in these parameters have been observed following exercise training for 12 weeks in obese subjects, whereas TRACP-5a titers remained elevated [37]. In contrast, TRACP-5a, CRP, and IL-6 levels were decreased with weight loss twelve months after bariatric surgery (gastric bypass surgery or vertical banded gastric partition) in severely obese subjects [38]. Taken with the present observations, these data suggest that TRACP-5a secretion during macrophage infiltration is associated with circulating triglyceride levels and is affected by incremental changes in adipose tissue volumes in vessel endothelia.
The present study was limited by sex bias, with male subjects comprising 80% of the cohort, although the proportion of males-to-females in MetS vs. non-MetS groups was equal (p = 0.519). This study was also limited by its cross-sectional design, which prevented evaluations of TRACP-5a responses to treatments such as lifestyle modification, exercise, and medication. Thus, future studies are required to confirm the present observations in larger cohorts of both sexes. Moreover, TRACP-5a accumulation in vascular endothelial cells needs to be verified and evaluated in autopsies from animal models. Finally, as the sample size was small, further studies are required to define relationships between TRACP-5a and individual MetS components, and the effects of treatments for insulin resistance and inflammatory markers.
In conclusion, this study warrants further consideration of increasing TRACP-5a levels as a more specific biomarker than the traditional MetS inflammatory IL-6 and CRP. Specifically, the present analyzes suggest that >5.8 μg/L TRACP-5a level is a potential cut-off point for the presence of MetS.
MATERIALS AND METHODS
Study design, participants, and blood sample collection
This was a preliminary study for observing the levels and trends of inflammatory markers in patients with MetS. This study was conducted with the annual physical examination for civilians who received physical check-up every year at a single institution. Subjects with a history of coronary artery disease or medication for hypertension, dyslipidemia, blood sugar control, or malignancy were excluded. We requested for volunteers who were willing to participate in our study without selection and the expected final participant number was designated as 100 in the beginning of this study. From April 2015 to June 2015, 100 healthy civilian volunteers were enrolled. All participants received physical examinations and serum biochemical and hematologic analyzes, and inflammatory biomarker evaluations were performed to determine IL-6, CRP, and TRACP-5a titers. Blood samples were collected in the morning after at least 8 hours (h) of fasting and were stored at −80°C within 30 min of sampling. The study was approved by the Institutional Review Board of Tri-Service General Hospital (TSGH-IRB approval number: 1-103-05-065). Written informed consent was obtained from each participant prior to participation in the study. All laboratory methods were performed in accordance with the related guidelines.
Biochemical markers and serologic data
TRACP-5a titers were assessed using a two-site immunoassay as described previously [11]. Briefly, approximately 10 μL aliquots of serum were washed and diluted with 90 μL buffer (10 mM Tris-HCl, 150 mM NaCl, pH 7.5, containing 2% glycerol, 10 mM EDTA, and 0.05% Tween-20 solution) and were added in duplicate to 1 mg biotinylated mab220-coated streptavidin wells (Pierce Chemical Co.) that were specific for TRACP-5a. Diluted samples were covered with plastic wrap and were then incubated for 16 h (overnight) at 4°C. Streptavidin wells were then washed, and 100 μL aliquots of horseradish peroxidase-conjugated anti-TRACP mab162 diluted at 1:1000 were added and incubated for 1 h at room temperature. Streptavidin wells were washed again and o-phenylenediamine dihydrochloride and H2O2 (horseradish peroxidase substrate) at pH 5.0 was added. Wells were then mixed and incubated for precisely 15 min and reactions were stopped by adding 50 μL aliquots of 2 M H2SO4. CRP levels were analyzed using enzyme-linked sandwich immunoassays with rabbit polyclonal antiserum CRP (DAKO Denmark). Serum IL-6 titers were determined using a commercial immunoassay kit (RayBiotech, Inc.).
Statistical analysis
Statistical analyzes were performed using Statistical Product and Service Solutions (SPSS) software (version 18.0; SPSS, Chicago, IL, USA). Descriptive data were expressed as means ± standard deviations and categorical variables were compared using chi-square or Fisher’s exact tests. Differences between continuous variables and categories were identified using student’s t-test, and c-statistics were used to determine cut-off points for inflammatory markers. Significant associations of parameters with MetS were identified using linear and binary regression analyzes. Differences and associations were considered significant when p < 0.05.
Abbreviations
CI, Confidence interval; CRP, C-reactive protein; DBP, Diastolic blood pressure; HDL, High-density lipoprotein; MetS, Metabolic syndrome; R.O.C, Republic of China; SBP, Systolic blood pressure; SPSS, Statistical Product and Service Solutions; TRACP, Tartrate-resistant acid phosphatase.
Author contributions
Huang YJ, Huang TW, and Wu LW participated mainly in the manuscript writing. Chao TY and Sun YS performed the laboratory tests. Chen SJ, Chu DM, and Chen WL performed the statistical analysis and crucial review of the manuscript for language editing and article structure. Wu LW and Sun YS also promoted the study design and the financial funding.
ACKNOWLEDGMENTS
The authors would like to acknowledge Miss Hsin-Yi Liu for her technical assistance and Enago (www.enago.tw) for the English language review.
CONFLICTS OF INTEREST
All authors declare that they have no financial or non-financial conflicts of interest.
FUNDING
This study was supported by grants to Dr. Li-Wei Wu (Grant No. TSGH-C104-PH-2, TSGH-PH-105-2, MAB-106-039, MAB-107-043) and a grant to Dr. Yi-Jhih Huang (TSGH-C106-158).
REFERENCES
1. Janckila AJ, Takahashi K, Sun SZ, Yam LT. Tartrate-resistant acid phosphatase isoform 5b as serum marker for osteoclastic activity. Clin Chem. 2001; 47: 74-80.
2. Mose S, Menzel C, Kurth AA, Obert K, Breidert I, Borowsky K, Böttcher HD. Tartrate-resistant acid phosphatase 5b as serum marker of bone metabolism in cancer patients. Anticancer Res. 2002; 23: 2783-2788.
3. Ylipahkala H, Halleen JM, Kaija H, Vihko P, Väänänen HK. Tartrate-resistant acid phosphatase 5B circulates in human serum in complex with α 2-macroglobulin and calcium. Biochem Biophysical Res Commun. 2003; 308: 320-324.
4. Halleen JM, Tiitinen SL, Ylipahkala H, Fagerlund KM, Vaananen HK. Tartrate-resistant acid phosphatase 5b (TRACP 5b) as a marker of bone resorption. Clin Lab. 2006; 52: 499-510.
5. Janckila AJ, Slone SP, Lear SC, Martin A, Yam LT. Tartrate-resistant acid phosphatase as an immunohistochemical marker for inflammatory macrophages. Am J Clin Pathol. 2007; 127: 556-566.
6. Wu YY, Chao TY, Liu HY, Huang TC, Chen JH, Dai MS, Janckila A, Lai SW, Chang PY. The correlation between a chronic inflammatory marker Tartrate-resistant acid phosphatase 5a with cancer cachexia. J BUON. 2015; 20: 325-331.
7. Chen YG, Janckila A, Chao TY, Yeh RH, Gao HW, Lee SH, Yu JC, Liao GS, Dai MS. Association of tartrate-resistant acid phosphatase-expressed macrophages and metastatic breast cancer progression. Medicine (Baltimore). 2015; 94: e2165.
8. Wu YY, Janckila AJ, Slone SP, Perng WC, Chao TY. Tartrate-resistant acid phosphatase 5a in sarcoidosis: further evidence for a novel macrophage biomarker in chronic inflammation. J Formos Med Assoc. 2014; 113: 364-370.
9. Janckila AJ, Lederer ED, Price BA, Yam LT. Tartrate-resistant acid phosphatase isoform 5a as an inflammation marker in end-stage renal disease. Clin Nephrol. 2009; 71: 387-396.
10. Janckila AJ, Neustadt DH, Yam LT. Significance of serum TRACP in rheumatoid arthritis. J Bone Miner Res. 2008; 23: 1287-1295.
11. Janckila AJ, Lin HF, Wu YY, Ku CH, Yang SP, Lin WS, Lee SH, Yam LT, Chao TY. Serum tartrate-resistant acid phosphatase isoform 5a (TRACP5a) as a potential risk marker in cardiovascular disease. Clin Chim Acta. 2011; 412: 963-969.
12. Magni P, Macchi C, Sirtori CR, Corsi Romanelli MM. Osteocalcin as a potential risk biomarker for cardiovascular and metabolic diseases. Clin Chem Lab Med. 2016; 54: 1579-1587.
13. Coffman E, Richmond-Bryant J. Multiple biomarker models for improved risk estimation of specific cardiovascular diseases related to metabolic syndrome: a cross-sectional study. Popul Health Metr. 2015; 13: 7.
14. Furuhashi M, Saitoh S, Shimamoto K, Miura T. Fatty acid-binding protein 4 (FABP4): pathophysiological insights and potent clinical biomarker of metabolic and cardiovascular diseases. Clin Med Insights Cardiol. 2015; 8: 23-33.
15. Pedersen L, Nybo M, Poulsen MK, Henriksen JE, Dahl J, Rasmussen LM. Plasma calprotectin and its association with cardiovascular disease manifestations, obesity and the metabolic syndrome in type 2 diabetes mellitus patients. BMC Cardiovasc Disord. 2014; 14: 196.
16. Panagiotou G, Mu L, Na B, Mukamal KJ, Mantzoros CS. Circulating irisin, omentin-1, and lipoprotein subparticles in adults at higher cardiovascular risk. Metabolism. 2014; 63: 1265-1271.
17. Devaraj S, Valleggi S, Siegel D, Jialal I. Role of C-reactive protein in contributing to increased cardiovascular risk in metabolic syndrome. Curr Atheroscler Rep. 2010; 12: 110-118.
18. Carlquist JF, Muhlestein JB, Anderson JL. Lipoprotein-associated phospholipase A2: a new biomarker for cardiovascular risk assessment and potential therapeutic target. Expert Rev Mol Diagn. 2007; 7: 511-517.
19. Abraham J, Campbell CY, Cheema A, Gluckman TJ, Blumenthal RS, Danyi P. C-reactive protein in cardiovascular risk assessment: a review of the evidence. J Cardiometab Syndr. 2007; 2: 119-123.
20. Schiopu A, Hedblad B, Engström G, Struck J, Morgenthaler NG, Melander O. Plasma procalcitonin and the risk of cardiovascular events and death: a prospective population-based study. J Intern Med. 2012; 272: 484-491.
21. Zambon A, Pauletto P, Crepaldi G. Review article: the metabolic syndrome–a chronic cardiovascular inflammatory condition. Aliment Pharmacol Ther. 2005; 22: 20-23.
22. Matsuo Y, Hashizume T, Shioji S, Akasaka T. Metabolic syndrome is strongly associated with chronic subclinical inflammation in patients achieving optimal low-density lipoprotein-cholesterol levels in secondary prevention of cardiovascular disease. Circ J. 2008; 72: 2046-2050.
23. Hanley AJ, Festa A, D’Agostino RB, Wagenknecht LE, Savage PJ, Tracy RP, Saad MF, Haffner SM. Metabolic and inflammation variable clusters and prediction of type 2 diabetes. Diabetes. 2004; 53: 1773-1781.
24. Gami AS, Witt BJ, Howard DE, Erwin PJ, Gami LA, Somers VK, Montori VM. Metabolic syndrome and risk of incident cardiovascular events and death: a systematic review and meta-analysis of longitudinal studies. J Am Coll Cardiol. 2007; 49: 403-414.
25. Mottillo S, Filion KB, Genest J, Joseph L, Pilote L, Poirier P, Rinfret S, Schiffrin EL, Eisenberg MJ. The metabolic syndrome and cardiovascular risk: a systematic review and meta-analysis. J Am Coll Cardiol. 2010; 56: 1113-1132.
26. Bassi N, Karagodin I, Wang S, Vassallo P, Priyanath A, Massaro E, Stone NJ. Lifestyle modification for metabolic syndrome: a systematic review. Am J Med. 2014; 127: 1242.e1-10.
27. Grundy SM, Cleeman JI, Daniels SR, Donato KA, Eckel RH, Franklin BA, Gordon DJ, Krauss RM, Savage PJ, Smith SC, Spertus JA. Diagnosis and management of the metabolic syndrome. Circulation. 2005; 112: 2735-2752.
28. Manabe I. Chronic inflammation links cardiovascular, metabolic and renal diseases. Circ J. 2011; 75: 2739-2748.
29. Berliner JA, Navab M, Fogelman AM, Frank JS, Demer LL, Edwards PA, Watson AD, Lusis AJ. Atherosclerosis: basic mechanisms. Circulation. 1995; 91: 2488-2496.
30. Purnell JQ, Zinman B, Brunzell JD; DCCT/EDIC Research Group. The effect of excess weight gain with intensive diabetes mellitus treatment on cardiovascular disease risk factors and atherosclerosis in type 1 diabetes mellitus: results from the Diabetes Control and Complications Trial/Epidemiology of Diabetes Interventions and Complications Study (DCCT/EDIC) study. Circulation. 2013; 127: 180-187.
31. Aballay LR, Eynard AR, del Pilar Díaz M, Navarro A, Muñoz SE. Overweight and obesity: a review of their relationship to metabolic syndrome, cardiovascular disease, and cancer in South America. Nutr Rev. 2013; 71: 168-179.
32. Dunkley AJ, Charles K, Gray LJ, Camosso-Stefinovic J, Davies MJ, Khunti K. Effectiveness of interventions for reducing diabetes and cardiovascular disease risk in people with metabolic syndrome: systematic review and mixed treatment comparison meta-analysis. Diabetes Obes Metab. 2012; 14: 616-625.
33. Chao TY, Lee SH, Chen MM, Neustadt DH, Chaudhry UA, Yam LT, Janckila AJ. Development of immunoassays for serum tartrate-resistant acid phosphatase isoform 5a. Clinic Chim acta. 2005; 359: 132-140.
34. González AS, Guerrero DB, Soto MB, Díaz SP, Martinez-Olmos M, Vidal O. Metabolic syndrome, insulin resistance and the inflammation markers C-reactive protein and ferritin. Eur J Clin Nutr. 2006; 60: 802-809.
35. McLaughlin T, Abbasi F, Lamendola C, Liang L, Reaven G, Schaaf P, Reaven P. Differentiation between obesity and insulin resistance in the association with C-reactive protein. Circulation. 2002; 106: 2908-2912.
36. Bastard JP, Maachi M, Van Nhieu JT, Jardel C, Bruckert E, Grimaldi A, Robert JJ, Capeau J, Hainque B. Adipose tissue IL-6 content correlates with resistance to insulin activation of glucose uptake both in vivo and in vitro. J Clin Endocrinol Metab. 2002; 87: 2084-2089.
37. Shih KC, Janckila AJ, Kwok CF, Ho LT, Chou YC, Chao TY. Effects of exercise on insulin sensitivity, inflammatory cytokines, and serum tartrate-resistant acid phosphatase 5a in obese Chinese male adolescents. Metabolism. 2010; 59: 144-151.
38. Shih KC, Janckila AJ, Lee WJ, Chou YC, Huang CJ, Kwok CF, Ho LT, Chao TY. Effects of bariatric weight loss surgery on glucose metabolism, inflammatory cytokines, and serum tartrate-resistant acid phosphatase 5a in obese Chinese adults. Clinic Chim Acta. 2016; 453: 197-202.