
INTRODUCTION
Human colorectal cancer (CRC) is one of the most common fatal malignancies worldwide. A large amount of evidence has demonstrated that tumor microenvironment (TME) linked closely with the initiation, promotion, and progression of CRC via diverse mechanisms such as stimulating angiogenesis and immune suppression [1]. Immune cells are the core components of the TME [2]. Regulatory T cells (Tregs) are considered to be a key mediator in subverting antitumor immune responses and subsequently promote tumor progression.
The transcription factor forkhead box P3 (FoxP3), an intracellular key molecule for Tregs development and function [3], is considered to represent the most specific Treg cell marker so far [4]. Recent studies have demonstrated that increased proportion of tumor-infiltrating FoxP3+ Tregs predict a poor prognosis of patients with cancer, including breast [5], ovarian [6], hepatocellular [7] and gastric carcinomas [8]. However, in human CRC, high density of tumor-infiltrating FoxP3+ Tregs was shown to associate with worse survival in several studies, [9, 10] while some other studies reported opposite results [11, 12]. Thus, a deep understanding is warranted. Moreover, the potential of FoxP3+ Tregs as an effective index in prognostic prediction and targeted immunotherapy is necessary to be explored.
Here, we performed this meta-analysis to test overall survival (OS) and disease-free survival (DFS) as outcomes in human CRC with known FoxP3+ Tregs density according to the compartment within tumor they invade. The aim of this study was to quantitatively summarize the association between high FoxP3+ Tregs infiltration and clinical outcomes in human CRC, and thereby provided more evidence on the clinical value of FoxP3+ Tregs as a prognostic index and immunotherapeutic target for human CRC.
RESULTS
Search results and description of studies
Literature searches yield total 1612 records and the results are shown in Figure 1. 17 studies including 3811 patients were identified for the assessment of intratumoral FoxP3+ Tregs density [12–28]. All the studies were evaluated by the Newcastle–Ottawa Scale (NOS), and were in accordance with the inclusion criteria and suitable for data consolidation. Characteristics of included studies for OS, DFS (or RFS) and clinicopathological features such as TNM stage were shown in Table 1 and Supplementary Table 1 respectively.
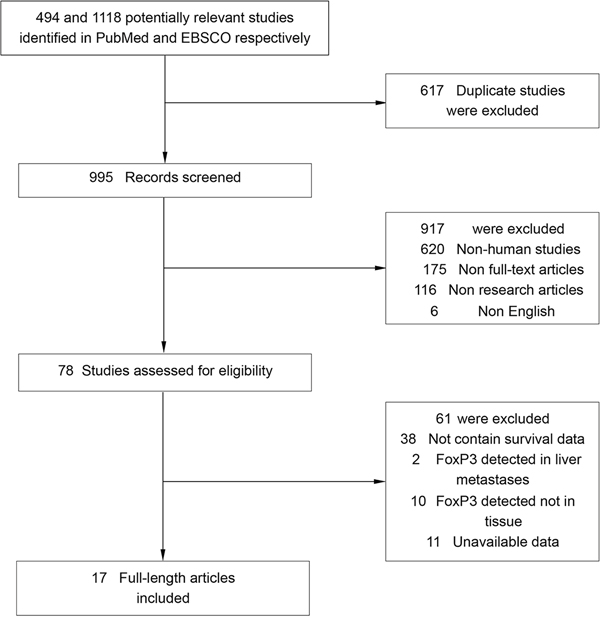
Figure 1: Flow chart diagram of study selection.
Table 1: Main characteristics of the included studies
Location of FoxP3+ Tregs |
Study |
Year |
No. of Patients |
Cut-off for high density |
FoxP3+ Tregs: high/low |
Tumor stage |
Follow-up years: |
Survival |
Quality Score (NOS) |
|---|---|---|---|---|---|---|---|---|---|
Both intraepithelial and stromal compartments |
Suzuki, H. etal [13] |
2010 |
94 |
mean |
30/64 |
I-IV |
NR |
OS, DFS |
7 |
Reimers, M. S. etal [14] |
2014 |
478 |
median |
238/240 |
I-IV |
NR |
OS, DFS |
6 |
|
Ling, A. etal [12] |
2014 |
204 |
other |
125/79 |
I-IV |
9.42 |
OS |
8 |
|
Chen, J.X. etal [15] |
2014 |
102 |
other |
47/55 |
I-IV |
NR |
OS |
7 |
|
Frey, D. M. etal [16] |
2010 |
1232 |
median |
614/618 |
NR |
NR |
OS |
6 |
|
Suzuki, H. etal [17] |
2013 |
88 |
mean |
34/54 |
I-IV |
NR |
OS, DFS |
7 |
|
Kim, M. etal [18] |
2013 |
65 |
mean |
27/38 |
I-IV |
≥ 5 |
OS |
7 |
|
Hanke, T. etal [19] |
2015 |
820 |
mean |
34/786 |
II |
3.83 (0.08, 12.67) |
OS |
6 |
|
Vlad, C. etal [21] |
2015 |
42 |
median |
21/21 |
II, III |
NR |
OS |
6 |
|
Xu, W. etal [20] |
2013 |
90 |
median |
21/69 |
I-IV |
5.42 (5.25, 6.08) |
OS |
7 |
|
Tosolini, M. etal [28] |
2011 |
56 |
mean |
18/38 |
NR |
NR |
DFS |
6 |
|
Intraepithelial compartment |
Sinicrope, F. A. etal [22] |
2009 |
160 |
other |
101/59 |
II, III |
NR |
OS, DFS |
7 |
Lee, W. S. etal [23] |
2010 |
63 |
mean |
39/24 |
II |
10.42 (3.54, 14.04) |
OS, DFS |
8 |
|
Nosho, K. etal [25] |
2010 |
768 |
median |
384/384 |
I-IV |
11.6 |
OS |
7 |
|
Zeestraten, E. C. etal [24] |
2013 |
76 |
median |
36/40 |
I-III |
7.3 (0.1, 23.1) |
OS, DFS |
7 |
|
Shinto, E. etal [26] |
2014 |
81 |
median |
36/45 |
II, III |
4.60 (1.68, 7.62) |
OS |
8 |
|
Xu, W. etal [20] |
2013 |
90 |
median |
13/77 |
I-IV |
5.42 (5.25, 6.08) |
OS |
7 |
|
Stromal compartment |
Sinicrope, F. A. etal [22] |
2009 |
160 |
other |
118/42 |
II, III |
NR |
OS, DFS |
7 |
Ling, A. etal [12] |
2014 |
405 |
other |
151/254 |
I-IV |
9.42 |
OS |
8 |
|
Lee, W. S. etal [23] |
2010 |
63 |
mean |
39/24 |
II |
10.42 (3.54, 14.04) |
OS, DFS |
8 |
|
Yoon, H. H. etal [27] |
2012 |
156 |
other |
78/78 |
II, III |
8 (4.7, 8.0) |
OS |
6 |
|
Xu, W. etal [20] |
2013 |
90 |
median |
21/69 |
I-IV |
5.42 (5.25, 6.08) |
OS |
7 |
|
Shinto, E. etal [26] |
2014 |
81 |
median |
36/45 |
II, III |
4.60 (1.68, 7.62) |
OS |
8 |
Meta-analyses
Density of FoxP3+ Tregs both in stromal and intraepithelial compartments in tumor tissue
OS
In this meta-analysis, as shown in Figure 2, pooled results indicated that high density of FoxP3+ Tregs was significantly associated with improved 1-year (OR = 1.90, 95% CI = 1.46 to 2.47, P = 0.000), 3-year (OR = 1.89, 95% CI = 1.49 to 2.41, P = 0.000) and 5-year OS (OR = 2.00, 95% CI = 1.47 to 2.71, P = 0.000) of patients. There was no significant heterogeneity among studies. Similar result was observed in analysis between FoxP3+ Tregs and 10-year OS rate (OR = 2.58, 95% CI = 1.58 to 4.21, P = 0.000), with significant heterogeneity being observed among studies.
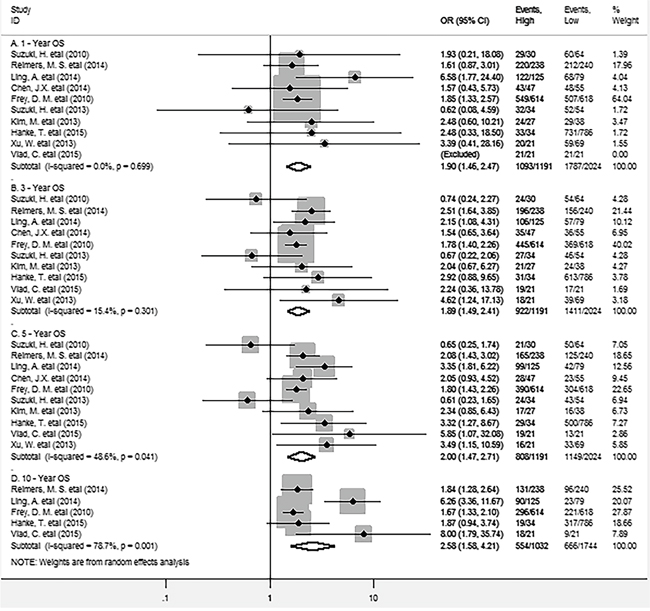
Figure 2: Forest plots describing OR of the association between FoxP3+ Tregs infiltrating into both stroma and intraepithelium and OS at 1, 3, 5 and 10-year.
DFS
The meta-analysis of all these studies showed that there were no significant association between FoxP3+ Tregs and 1, 3, 5-year DFS (OR = 1.36, 95% CI = 0.43 to 4.34, P = 0.604; OR = 1.55, 95% CI = 0.61 to 3.93, P = 0.353 and OR = 1.23, 95% CI = 0.38 to 4.01, P = 0.731 respectively) of CRC patients. Significant heterogeneity among studies was observed in each analysis (Figure 3).
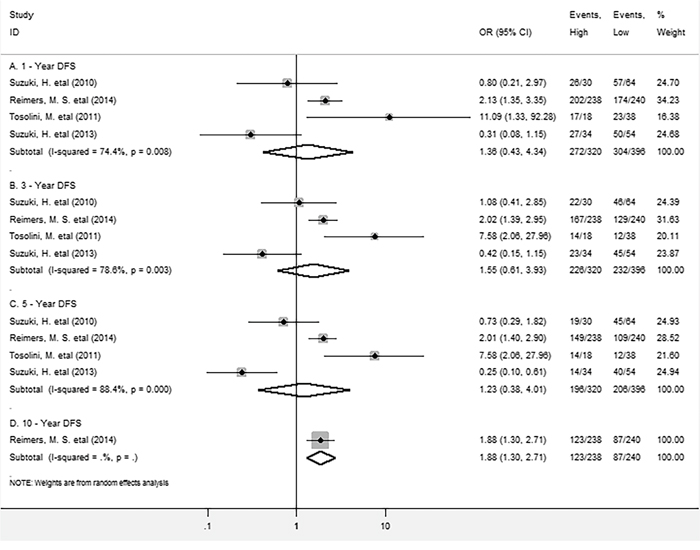
Figure 3: Forest plots describing OR of the association between FoxP3+ Tregs infiltrating into both stroma and intraepithelium and DFS at 1, 3, 5 and 10-year.
Intraepithelial FoxP3+ Tregs density in tumor tissue
OS
As for FoxP3+ Tregs density in intraepithelial compartment in tumor tissue, pooled results showed no significant association between FoxP3+ Tregs and survival, high density of FoxP3+ Tregs in intraepithelium wasn’t significantly associated with longer 1-year (OR =2.05, 95% CI = 0.72 to 5.81, P = 0.176) or 3-year OS (OR = 1.25, 95% CI = 0.65 to 2.42, P = 0.508) (Figure 4). Similar results were observed in analyses between FoxP3+ Tregs infiltration and 5-year (OR = 1.07, 95% CI = 0.55 to 2.11, P = 0.835) or 10-year OS rate (OR = 2.12, 95% CI = 0.91 to 4.96, P = 0.084).
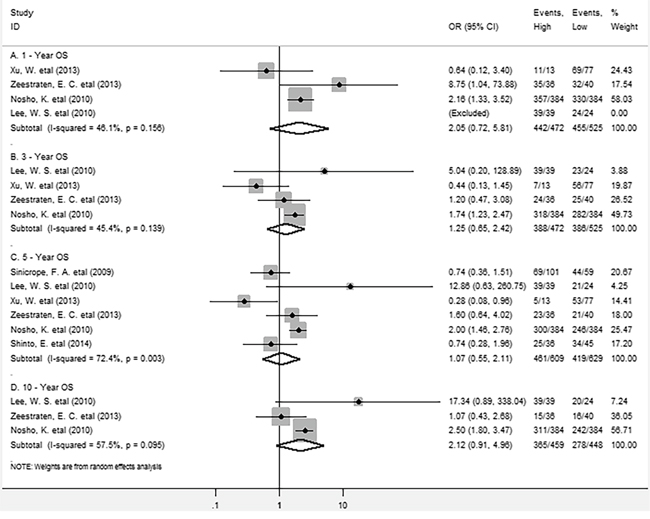
Figure 4: Forest plots describing OR of the association between intraepithelial FoxP3+ Tregs and OS at 1, 3, 5 and 10-year.
DFS
Similarily, no significant association was found between intraepithelial FoxP3+ Tregs and 1-year (OR = 1.52, 95% CI = 0.74 to 3.16, P = 0.257), 3-year (OR = 0.98, 95% CI = 0.57 to 1.67, P = 0.930), 5-year DFS (OR = 1.24, 95% CI = 0.76 to 2.05, P = 0.388) or 10-year DFS (OR = 1.80, 95% CI = 0.84 to 3.85, P = 0.128). (Supplementary Figure 1)
Stromal FoxP3+ Tregs density in tumor tissue
OS
As for FoxP3+ Tregs in the stromal compartment, the meta-analysis showed that there was no significant association between FoxP3+ Tregs and 1-year (OR = 1.01, 95% CI = 0.44 to 2.33, P = 0.987) or 10-year (OR = 3.18, 95% CI = 0.32 to 32.17, P = 0.326) OS; whereas FoxP3+ Tregs infiltration significantly improved 3-year (OR = 2.08, 95% CI = 1.36 to 3.17, P = 0.001) and 5-year (OR = 1.86, 95% CI = 1.31 to 2.63, P = 0.000) OS for CRC patients, with no significant heterogeneity existing among studies (Figure 5).
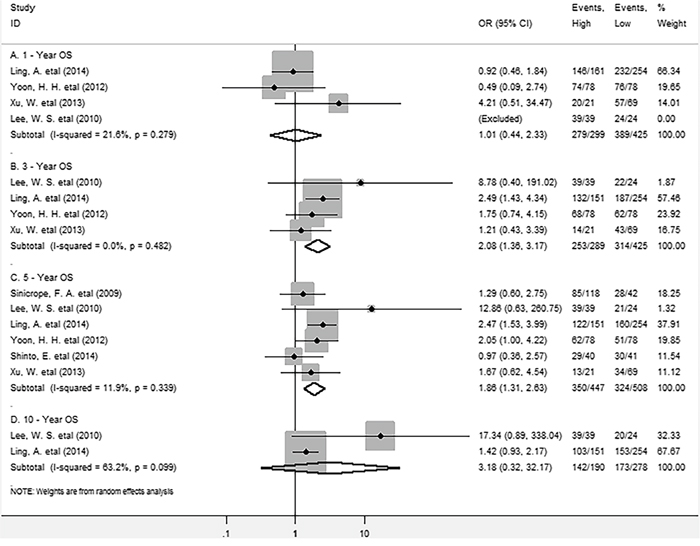
Figure 5: Forest plots describing OR of the association between stromal FoxP3+ Tregs and OS at 1, 3, 5 and 10-year.
DFS
As for the relationship between FoxP3+ Tregs and DFS, the meta-analysis showed high density of stromal FoxP3+ Tregs was not associated with improved 5-year DFS (OR = 1.75, 95% CI = 0.50 to 6.08, P = 0.121) of patients (Supplementary Figure 2).
In addition, we found that FoxP3+ Tregs infiltrating into both stromal and intraepithelial compartments was significantly associated with early TNM stage (I+II) of CRC (OR = 2.95, 95% CI = 1.81 to 4.83, P = 0.000), whereas no significant association was observed between intraepithelial or stromal FoxP3+ Tregs and TNM stage (OR = 0.99, 95% CI = 0.33 to 3.01, P = 0.908; OR = 1.57, 95% CI = 0.84 to 2.92, P = 0.158) (Supplementary Figure 3).
Sensitivity analysis
Sensitivity analyses were used to determine the influence of individual studies on the overall OR. As a result, the plot showed that all the individual studies had no important impact on the results for 1, 3, 5 or 10-year OS, which correlating with FoxP3+ Tregs both in stroma and intraepithelium within tumor (Supplementary Figure 4).
Publication bias
Funnel plot and Egger’s test were performed to assess the publication bias of this meta-analysis. No publication bias existed between FoxP3+ Tregs infiltrating into both stroma and intraepithelium and 1, 3, 5 or 10-year OS (continuity corrected P = 0.569; P = 0.913; P = 0.717 and P = 0.152 >0.05 respectively) (Figure 6) or DFS (data not shown).
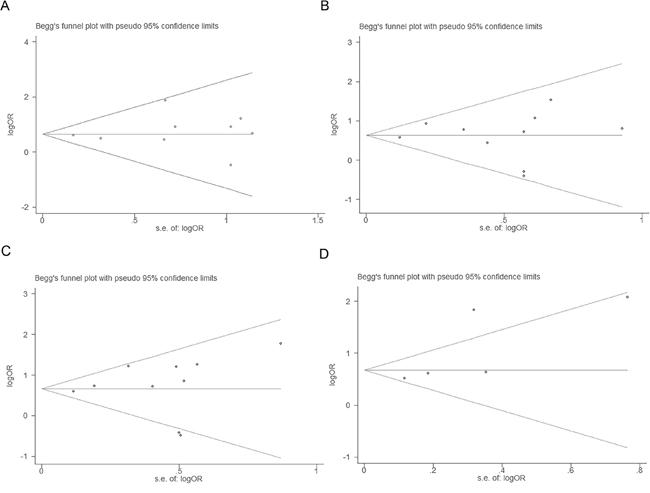
Figure 6: Tests for publication bias for OR of OS at 1, 3, 5 and 10-year (A, B, C and D respectively).
DISCUSSION
FoxP3+ Tregs are highly enriched in the TME and are considered to be a pivotal mediator of immune suppression, therefore facilitating tumor progression [31-32]. However, FoxP3+ Tregs shows its anti-tumor effect in several cancers. Previous meta-analyses reported that increased tumor-infiltrating FoxP3+ Tregs improved OS in human CRC [29, 30]. However, the studies included in these meta-analyses only reported the data on FoxP3+ Tregs either from stroma, intraepithelium or both sites. Thus, the results were not accurate even wrong when they were from the combinations of all these studies.
In this meta-analysis, we found FoxP3+ Tregs invading both stroma and intraepithelium within tumor were significantly positively correlated with 1, 3, 5 and 10-year OS, but not with 1, 3, 5 or 10-year DFS in CRC. In addition, FoxP3+ Tregs infiltration was significantly inversely associated with TNM stage of CRC. Interestingly, FoxP3+ Tregs infiltrating into different sites (intraepithelium or stroma) seemed to predict differential clinical outcomes as stated above, implicating FoxP3+ Tregs may have distinct roles depending upon their localization. The possible explanation was that FoxP3+ Tregs in stroma mainly inhibited the inflammatory anti-microbial response which facilitating tumor progression; whereas FoxP3+ Tregs in intraepithelium may inhibit anti-tumor immunity and promote tumor immune evasion maybe through the direct contact with tumor cells. We believe that our study provides significative statistical evidence to unravel the differential prognostic value of FoxP3+ Tregs in different locations in human CRC for the first time.
Several limitations should be noted from this meta-analysis. First, we can’t get pooled result as there is only one study included in some analyses. Second, significant heterogeneity observed across studies in some analyses can’t be completely accounted despite the use of random-effect models. Third, morphometric analysis for FoxP3+ Tregs used in included studies are not inconsistent. Finally, studies with negative results or small sample size may not be published, which can cause publication bias.
In conclusion, high density of FoxP3+ Tregs within tumor especially at stromal compartment leads to a favorable clinical outcome of CRC, implicating FoxP3+ Tregs are one of potential indexes for prognostic prediction and agonists through promoting FoxP3+ Tregs generation may be promising in immunotherapy for human CRC.
MATERIALS AND METHODS
Search strategy
We searched PubMed and EBSCO for studies assessing the density of FoxP3+ Tregs in tumor tissue and survival in CRC patients from 1996 to October 2016. The searching keywords were (“regulatory T cells” OR “Tregs” OR “FoxP3”) AND (“colorectal”) AND (“neoplasms” OR “cancer” OR “tumor” OR “carcinoma”). A total of 494 and 1118 entries were identified in PubMed and EBSCO respectively.
Inclusion and exclusion criteria
Inclusion criteria of the meta-analysis were: studies included must have (1) been published as original articles; (2) evaluated human subjects; (3) FoxP3+ Tregs in tumor specimens was evaluated with immunohistochemical (IHC) method; (4) provided Kaplan – Meier curves of high and low FoxP3+ Tregs density with overall survival (OS), and/or disease-free survival (DFS), or relapse-free survival (RFS); (5) published in English.
We excluded studies that were not published as full texts, including commentary, conference abstracts and letters to editors, studies that not report sufficient data to estimate survival rates; studies that evaluated FoxP3+ Tregs with Flow Cytometry (FCM) or real-time reverse transcription polymerase chain reaction (RT-PCR), detected FoxP3+ Tregs in metastases and not in tumor tissues.
Endpoints
OS and DFS (or RFS) are the endpoints used in this meta-analysis. OS was recorded as the primary endpoint, and the second endpoint was DFS (or RFS). Cut-offs of FoxP3+ Tregs density defined by individual studies classified CRC patients into high- and low- groups.
Data extraction
Two authors (GM.H. and ZA.L.) independently reviewed and extracted data using predefined data abstraction forms from each eligible studies. Extracted information included first author’s name, publication year, country, number of patients, median age, gender, Tumor, Lymph Node, Metastasis (TNM) stage, tumor differentiation, time of follow-up, technique used to quantify FoxP3+ Tregs, and cut-off value to determine high FoxP3+ Tregs density. OS, DFS (or RFS) and clinicopathological data were extracted from the text, tables, or Kaplan – Meier curves for both high and low FoxP3+ Tregs density groups.
Quality assessment
The studies included in the meta-analysis were cohort studies. The quality of each included study was assessed using Newcastle–Ottawa Scale (NOS) by two independent authors [33]. The studies with 6 scores or more were regarded as high quality studies. A consensus NOS score for each item was achieved.
Statistical analysis
Extracted data were combined into a meta-analysis using STATA 12.0 analysis software (Stata Corporation, College Station, TX, USA). Statistical heterogeneity was assessed using the chi-squared based Q-test or the I2 method [34]. Data were combined according to the random-effect model in the presence of high heterogeneity [35], otherwise, the fixed-effect model was performed [36]. Sensitivity analysis was employed to assess the influence of each study on the pooled result. Begg’s funnel plot and Egger’s test [37] were calculated to investigate potential publication bias. All P values were two-sided and less than 0.05 are considered statistically significant.
Abbreviations
FoxP3: forkhead box P3; Tregs: regulatory T cells; CRC: colorectal cancer; OS: overall survival; DFS: disease-free survival; OR: odds ratios; Cl: confidence interval; TNM: Tumor, Lymph Node, Metastasis; IHC: immunohistochemistry; FCM: Flow Cytometry; RT-PCR: real-time reverse transcription polymerase chain reaction; NR: not reported.
Authors' contributions
GM.H. conceived of the study, participated in its design, extracted data, performed the statistical analysis and drafted the manuscript. ZA.L. participated in the data extraction. SM.W. participated in its design and performed the statistical analysis. All authors read and approved the final manuscript.
ACKNOWLEDGMENTS
We thank all the members of the departments who helped in this study.
CONFLICTS OF INTEREST
The authors have declared that no competing interests exist.
REFERENCES
1. Motz GT, Coukos G. The parallel lives of angiogenesis and immunosuppression: cancer and other tales. Nat Rev Immunol. 2011; 11:702-711.
2. Hanahan D, Weinberg RA. Hallmarks of cancer: the next generation. Cell. 2011; 144:646-674.
3. Hori S, Nomura T, Sakaguchi S. Control of regulatory T cell development by the transcription factor Foxp3. Science. 2003; 299:1057-1061.
4. Wolf D, Wolf AM, Rumpold H, Fiegl H, Zeimet AG, Muller-Holzner E, Deibl M, Gastl G, Gunsilius E, Marth C. The expression of the regulatory T cell-specific forkhead box transcription factor FoxP3 is associated with poor prognosis in ovarian cancer. Clin Cancer Res. 2005; 11:8326-8331.
5. Bates GJ, Fox SB, Han C, Leek RD, Garcia JF, Harris AL, Banham AH. Quantification of regulatory T cells enables the identification of high-risk breast cancer patients and those at risk of late relapse. J Clin Oncol. 2006; 24:5373-5380.
6. Curiel TJ, Coukos G, Zou L, Alvarez X, Cheng P, Mottram P, Evdemon-Hogan M, Conejo-Garcia JR, Zhang L, Burow M, Zhu Y, Wei S, Kryczek I, et al. Specific recruitment of regulatory T cells in ovarian carcinoma fosters immune privilege and predicts reduced survival. Nature medicine. 2004; 10:942-949.
7. Fu J, Xu D, Liu Z, Shi M, Zhao P, Fu B, Zhang Z, Yang H, Zhang H, Zhou C, Yao J, Jin L, Wang H, et al. Increased regulatory T cells correlate with CD8 T-cell impairment and poor survival in hepatocellular carcinoma patients. Gastroenterology. 2007; 132:2328-2339.
8. Sasada T, Kimura M, Yoshida Y, Kanai M, Takabayashi A. CD4+CD25+ regulatory T cells in patients with gastrointestinal malignancies: possible involvement of regulatory T cells in disease progression. Cancer. 2003; 98:1089-1099.
9. Yaqub S, Henjum K, Mahic M, Jahnsen FL, Aandahl EM, Bjornbeth BA, Tasken K. Regulatory T cells in colorectal cancer patients suppress anti-tumor immune activity in a COX-2 dependent manner. Cancer immunology, immunotherapy. 2008; 57:813-821.
10. Zhuo C, Li Z, Xu Y, Wang Y, Li Q, Peng J, Zheng H, Wu P, Li B, Cai S. Higher FOXP3-TSDR demethylation rates in adjacent normal tissues in patients with colon cancer were associated with worse survival. Molecular cancer. 2014; 13:153.
11. Salama P, Phillips M, Grieu F, Morris M, Zeps N, Joseph D, Platell C, Iacopetta B. Tumor-infiltrating FOXP3+ T regulatory cells show strong prognostic significance in colorectal cancer. J Clin Oncol. 2009; 27:186-192.
12. Ling A, Edin S, Wikberg ML, Oberg A, Palmqvist R. The intratumoural subsite and relation of CD8(+) and FOXP3(+) T lymphocytes in colorectal cancer provide important prognostic clues. British journal of cancer. 2014; 110:2551-2559.
13. Suzuki H, Chikazawa N, Tasaka T, Wada J, Yamasaki A, Kitaura Y, Sozaki M, Tanaka M, Onishi H, Morisaki T, Katano M. Intratumoral CD8(+) T/FOXP3 (+) cell ratio is a predictive marker for survival in patients with colorectal cancer. Cancer immunology, immunotherapy. 2010; 59:653-661.
14. Reimers MS, Engels CC, Putter H, Morreau H, Liefers GJ, van de Velde CJ, Kuppen PJ. Prognostic value of HLA class I, HLA-E, HLA-G and Tregs in rectal cancer: a retrospective cohort study. BMC Cancer. 2014; 14:486.
15. Chen J, Chen Z. The effect of immune microenvironment on the progression and prognosis of colorectal cancer. Medical oncology. 2014; 31:82.
16. Frey DM, Droeser RA, Viehl CT, Zlobec I, Lugli A, Zingg U, Oertli D, Kettelhack C, Terracciano L, Tornillo L. High frequency of tumor-infiltrating FOXP3(+) regulatory T cells predicts improved survival in mismatch repair-proficient colorectal cancer patients. Int J Cancer. 2010; 126:2635-2643.
17. Suzuki H, Onishi H, Morisaki T, Tanaka M, Katano M. Intratumoral FOXP3+VEGFR2+ regulatory T cells are predictive markers for recurrence and survival in patients with colorectal cancer. Clinical immunology. 2013; 146:26-33.
18. Kim M, Grimmig T, Grimm M, Lazariotou M, Meier E, Rosenwald A, Tsaur I, Blaheta R, Heemann U, Germer CT, Waaga-Gasser AM, Gasser M. Expression of Foxp3 in colorectal cancer but not in Treg cells correlates with disease progression in patients with colorectal cancer. PLoS One. 2013; 8:e53630.
19. Hanke T, Melling N, Simon R, Sauter G, Bokemeyer C, Lebok P, Terracciano LM, Izbicki JR, Marx AH. High intratumoral FOXP3+ T regulatory cell (Tregs) density is an independent good prognosticator in nodal negative colorectal cancer. Int J Clin Exp Pathol. 2015; 8:8227–8235.
20. Xu W, Liu H, Song J, Fu HX, Qiu L, Zhang BF, Li HZ, Bai J, Zheng JN. The appearance of Tregs in cancer nest is a promising independent risk factor in colon cancer. Journal of cancer research and clinical oncology. 2013; 139:1845-1852.
21. Vlad C, Kubelac P, Fetica B, Vlad D, Irimie A, Achimas-Cadariu P. The prognostic value of FOXP3+ T regulatory cells in colorectal cancer. Journal of BUON. 2015; 20:114-119.
22. Sinicrope FA, Rego RL, Ansell SM, Knutson KL, Foster NR, Sargent DJ. Intraepithelial effector (CD3+)/regulatory (FoxP3+) T-cell ratio predicts a clinical outcome of human colon carcinoma. Gastroenterology. 2009; 137:1270-1279.
23. Lee WS, Park S, Lee WY, Yun SH, Chun HK. Clinical impact of tumor-infiltrating lymphocytes for survival in stage II colon cancer. Cancer. 2010; 116:5188-5199.
24. Zeestraten EC, Van Hoesel AQ, Speetjens FM, Menon AG, Putter H, van de Velde CJ, Kuppen PJ. FoxP3- and CD8-positive Infiltrating Immune Cells Together Determine Clinical Outcome in Colorectal Cancer. Cancer microenvironment. 2013; 6:31-39.
25. Nosho K, Baba Y, Tanaka N, Shima K, Hayashi M, Meyerhardt JA, Giovannucci E, Dranoff G, Fuchs CS, Ogino S. Tumour-infiltrating T-cell subsets, molecular changes in colorectal cancer, and prognosis: cohort study and literature review. J Pathol. 2010; 222:350-366.
26. Shinto E, Hase K, Hashiguchi Y, Sekizawa A, Ueno H, Shikina A, Kajiwara Y, Kobayashi H, Ishiguro M, Yamamoto J. CD8+ and FOXP3+ tumor-infiltrating T cells before and after chemoradiotherapy for rectal cancer. Ann Surg Oncol. 2014; 21:S414-421.
27. Yoon HH, Orrock JM, Foster NR, Sargent DJ, Smyrk TC, Sinicrope FA. Prognostic impact of FoxP3+ regulatory T cells in relation to CD8+ T lymphocyte density in human colon carcinomas. PLoS One. 2012; 7:e42274.
28. Tosolini M, Kirilovsky A, Mlecnik B, Fredriksen T, Mauger S, Bindea G, Berger A, Bruneval P, Fridman WH, Pages F, Galon J. Clinical impact of different classes of infiltrating T cytotoxic and helper cells (Th1, th2, treg, th17) in patients with colorectal cancer. Cancer Res. 2011; 71:1263-1271.
29. Huang Y, Liao H, Zhang Y, Yuan R, Wang F, Gao Y, Wang P, Du Z. Prognostic value of tumor-infiltrating FoxP3+ T cells in gastrointestinal cancers: a meta analysis. PLoS One. 2014; 9:e94376.
30. Shang B, Liu Y, Jiang SJ, Liu Y. Prognostic value of tumor-infiltrating FoxP3+ regulatory T cells in cancers: a systematic review and meta-analysis. Scientific reports. 2015; 5:15179.
31. Rech AJ, Vonderheide RH. Clinical use of anti-CD25 antibody daclizumab to enhance immune responses to tumor antigen vaccination by targeting regulatory T cells. Ann N Y Acad Sci. 2009; 1174:99-106.
32. Dannull J, Su Z, Rizzieri D, Yang BK, Coleman D, Yancey D, Zhang A, Dahm P, Chao N, Gilboa E, Vieweg J. Enhancement of vaccine-mediated antitumor immunity in cancer patients after depletion of regulatory T cells. J Clin Invest. 2005; 115:3623-3633.
33. Stang A. Critical evaluation of the Newcastle-Ottawa scale for the assessment of the quality of nonrandomized studies in meta-analyses. European journal of epidemiology. 2010; 25:603-605.
34. Higgins JP, Thompson SG, Deeks JJ, Altman DG. Measuring inconsistency in meta-analyses. Bmj. 2003; 327:557-560.
35. DerSimonian R, Kacker R. Random-effects model for meta-analysis of clinical trials: an update. Contemporary clinical trials. 2007; 28:105-114.
36. Kuritz SJ, Landis JR, Koch GG. A general overview of Mantel-Haenszel methods: applications and recent developments. Annual review of public health. 1988; 9:123-160.
37. Egger M, Davey Smith G, Schneider M, Minder C. Bias in meta-analysis detected by a simple, graphical test. Bmj. 1997; 315:629-634.