
Introduction
Multiple myeloma (MM) is a plasma cell disease arising from the malignant transformation of post-follicular B cells and affects 22000 new individuals in the EU or US each year[1]. This disease is characterized by extensive molecular heterogeneity in multiple myeloma cells (MMCs) and diversity in overall survival of patients, which ranges from several months to more than ten years[2-4]. MM can be classified into hyperdiploid MM characterized by chromosome duplication (48-75 chromosomes) in MMCs or non-hyperdiploid MM. Primary translocations involving the immunoglobulin heavy chain locus and recurrent target genes are identified in about 70% of non-hyperdiploid MM and 15% of hyperdiploid MM[5, 6]. Additional molecular defects target various genes, which deregulate the p53 pathway (monoallelic deletion of the TP53 gene and TP53 mutations), NK-B pathway (mutations or amplifications), RAS pathway (mutations), or MYC pathway (amplification, rare translocations)[7, 8]. These abnormalities may concur to deregulate cell cycle checkpoints and impact on the array of DNA repair pathways[9].
In healthy cells, pleiotropic DNA damage occurs each day due to spontaneous base alterations, exposure to endogenous metabolites or exogenous agents, and errors during DNA replication[10, 11]. Multiple DNA repair proteins function together in order to detect and repair the different types of DNA lesions to avoid cell death from excess DNA damages. There are 6 major DNA repair pathways active in mammalian cells. Base excision repair (BER), nucleotide excision repair (NER) and mismatch repair (MMR) operate on nucleotide lesions occurring on single strands. The BER pathway repairs damaged bases [10] and the MMR pathway targets insertion/deletion loops and mismatches errors during replication[12]. The NER pathway removes bulky lesions, in particular resulting from UV induced DNA damages such as pyrimidine adducts[13]. Two main pathways, homologous recombination (HR) and non-homologous end joining (NHEJ) are involved in DNA double strand breaks (DSBs), which are highly cytotoxic[11]. Finally, proteins involved in the Fanconi Anemia disease (Fanconi anemia [FA] pathway) cooperate with NER and HR pathways to repair interstrand crosslinks (ICLs), which are covalent links between two opposite strands of DNA induced by exposure to chemicals such as bifunctional alkylating agents[14, 15]. The mechanisms of DNA repair have been extensively reviewed recently[11, 16]. They involve briefly DNA lesion recognition, DNA exonuclease , DNA polymerase and DNA ligase activities. DNA repair pathways are highly inter-connected due to the fact that a DNA repair protein can be involved in two or more pathways and that a repair engages several pathways, requiring tight regulatory control in normal cells[11, 16].
A deregulation of these DNA repair pathways could readily promote genetic instability and drug resistance in MMCs by bypassing or accelerating non-accurate DNA repairs to prevent cell death as reviewed recently[9]. Since the MM clone evolves at the genome level as disease progresses, it is highly likely that deregulated DNA repair pathways are implicated in clonal evolution[9, 17, 18]. These pathways are also of particularly relevance for genotoxic drugs used to treat patients with MM, presently doxorubicin, melphalan, cyclophosphamide, and bendamustine[9]. This is again the case for Bortezomib, a proteasome inhibitor and not directly genotoxic, which targets homologous recombination by depleting the pool of free ubiquitin [19]. Consequently, DNA repair pathways in MM are highly relevant to understanding response to the current spectrum of therapeutics agents in clinical use.
In the current study, we investigate the prognostic value of gene expression based scores built to systematically assess genes encompassing the major DNA repair pathways. The data reveals specific patterns of gene expression in MMCs that have prognostic value for both event free and overall survival of newly-diagnosed patients.
Result
Linking expression levels of DNA repair genes and patient overall survival
A consensus list set of 84 genes coding for the main 6 DNA repair pathways was obtained by review of medline and the current literature of DNA repair pathways (Supplementary Table S2)[11, 16, 20]. The 6 DNA repair pathways were non-homologous end-joining (NHEJ), homologous recombination (HR), Fanconi anemia pathway (FA), nucleotide excision repair (NER), mismatch repair (MMR) and base excision repair (BER). Using the R MaxStat function and Benjamini Hochberg multiple testing correction, 17 out of the 84 genes had bad prognostic value and 5 a good prognostic value for both event-free and overall survivals using the patients of HM cohort (Table 1). These 22 prognostic genes include 5 genes coding for NHEJ pathway (3 bad: WHSC1, RIF1 and XRCC5(KU80); 2 good: PNKP and POLL), 6 genes for HR (5 bad: EXO1, BLM, RPA3, RAD51 and MRE11A; 1 good: ATM), 3 bad genes for FA (RMI1, FANCI and FANCA), 8 genes for NER (6 bad: PCNA, RPA3, LIG3, POLD3, ERCC4 and POLD1; 2 good: ERCC1 and ERCC5), 2 bad genes for MMR (EXO1 and MSH2) and 1 bad gene for BER (LIG3) pathways.
Table 1: Identification of DNA repair genes whose expression is associated with patients’ prognostic value using HM cohort. Out of the 84 DNA repair genes, 22 had prognostic value for both event-free survival (EFS) and overall survival (OS) using R MaxStat function. Genes are ranked according to the FDR of log-rank test for overall survival. FDR: false discovery rate; HR: hazard ratio.
Overall Survival |
Event Free Survival |
||||||||
Probe set |
Gene Name |
DNA repair pathway |
Prognostic value |
Maxstat cut-point |
FDR |
HR |
Maxstat cut-point |
FDR |
HR |
218979_at |
RMI1 |
FA |
BAD |
1356 |
1.E-04 |
5 |
1353 |
6.E-04 |
3.0 |
201202_at |
PCNA |
NER |
BAD |
3703 |
1.E-04 |
4.5 |
2446 |
9.E-04 |
2.2 |
222777_s_at |
WHSC1/MMSET |
NHEJ |
BAD |
1506 |
3.E-04 |
3.7 |
918 |
3.E-05 |
2.8 |
204603_at |
EXO1 |
HR/MMR |
BAD |
295 |
8.E-04 |
3.9 |
48 |
4.E-02 |
1.8 |
213007_at |
FANCI |
FA |
BAD |
648 |
9.E-04 |
3.5 |
179 |
1.E-02 |
2.4 |
226503_at |
RIF1 |
NHEJ |
BAD |
1273 |
2.E-03 |
3.2 |
1273 |
2.E-03 |
2.3 |
205733_at |
BLM |
HR |
BAD |
1450 |
4.E-03 |
2.9 |
1495 |
2.E-02 |
1.8 |
209421_at |
MSH2 |
MMR |
BAD |
608 |
3.E-02 |
2.7 |
352 |
3.E-02 |
1.6 |
209507_at |
RPA3 |
HR/NER |
BAD |
3902 |
3.E-02 |
3.2 |
3836 |
5.E-04 |
3.1 |
204123_at |
LIG3 |
NER/BER |
BAD |
502 |
3.E-02 |
2.6 |
435 |
4.E-03 |
2.0 |
212836_at |
POLD3 |
NER |
BAD |
262 |
3.E-02 |
6.3 |
247 |
2.E-02 |
2.1 |
205024_s_at |
RAD51 |
HR |
BAD |
641 |
3.E-02 |
2.8 |
514 |
5.E-02 |
1.7 |
208642_s_at |
XRCC5/ KU80 |
NHEJ |
BAD |
7702 |
4.E-02 |
2.9 |
7626 |
2.E-03 |
2.5 |
235215_at |
ERCC4 |
NER |
BAD |
1103 |
4.E-02 |
2.5 |
873 |
1.E-03 |
2.2 |
203805_s_at |
FANCA |
FA |
BAD |
271 |
4.E-02 |
2.2 |
140 |
1.E-02 |
2.4 |
203422_at |
POLD1 |
NER |
BAD |
762 |
5.E-02 |
2.4 |
714 |
1.E-02 |
2.0 |
205395_s_at |
MRE11A |
HR |
BAD |
544 |
5.E-02 |
2.1 |
542 |
1.E-02 |
1.8 |
203720_s_at |
ERCC1 |
NER |
GOOD |
1885 |
4.E-02 |
0.4 |
3184 |
2.E-02 |
0.4 |
218961_s_at |
PNKP |
NHEJ |
GOOD |
1473 |
4.E-02 |
0.4 |
1346 |
2.E-03 |
0.5 |
221049_s_at |
POLL |
NHEJ |
GOOD |
101 |
5.E-02 |
0.3 |
42 |
5.E-03 |
0.5 |
202414_at |
ERCC5 |
NER |
GOOD |
645 |
5.E-02 |
0.5 |
695 |
5.E-03 |
0.5 |
212672_at |
ATM |
HR |
GOOD |
1570 |
5.E-02 |
0.5 |
1575 |
3.E-02 |
0.6 |
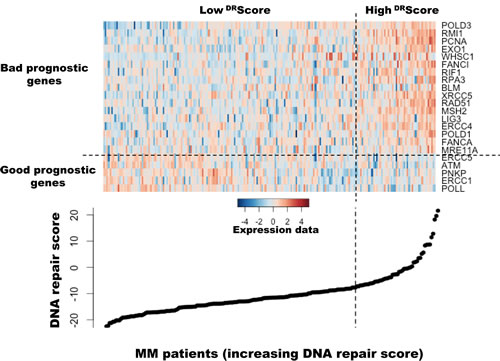
Figure 1: Heatmap of the gene expression signals of the 22 genes used to build DNA repair score in myeloma cells of 206 previously untreated patients. The signals of the 22 genes in MMCs of 206 patients, ordered by increasing DRScore, are displayed from low (deep blue) to high (deep red) expression.
Building a global DNA repair pathway score (DRscore) for predicting patients’ survival
As DNA repair pathways are tightly linked, the prognostic information provided by the 22 prognostic DNA repair genes was summed within a global DNA repair pathway (DRscore) as indicated in the Materials and Methods. The variation of DRscore in malignant plasma cell populations is shown in Figure 1. The Maxstat statistic test cuts the HM-patient cohort within 2 groups: 24.8% of patients with a DRscore > -7.62 with a median OAS of 27.9 months and 75.2% of patients with a DRscore ≤ -7.62 with a median OAS not-reached (P = 6.2E-15, Figure 2A). The DRscore could also predict for EFS (Figure 3A). The high-risk DRscore group had a median EFS of 15.7 months and the low-risk DRscore one a median EFS of 41.1 months (P = 3.3E-8, Figure 3A). DRscore was also prognostic for the UAMS-TT2 cohort of 345 patients. Using the cutoff of -7.62 defined on the HM cohort, 27.8% of UAMS-TT2 cohort patients were identified as high-risk DRscore (P = .001, Figure 2B). The median OAS was not reached in this cohort but at 50 months of follow-up, 85% of patients in the low risk DRscore group are alive compared to only 65% in the high-risk group (P = .001, Figure 2B). Patients of the high-risk group had a median EFS decreased about 2-fold compared to those of the low risk-group (32.3 months vs. 69.6 months, P = .001, Figure 3B).
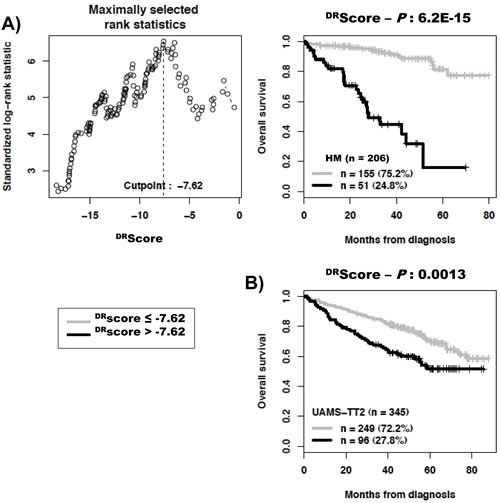
Figure 2: Building a DNA repair score (DRscore) for predicting overall survival. A. The prognostic information provided by the 22 DNA repair genes was summed within a DRscore as defined in the Materials and Methods. Patients of the HM cohort were ranked according to increased DRscore and a maximum difference in overall survival (OS) was obtained with a DRscore = -7.62 splitting patients in a high risk (24.8%) and low risk (75.2%) groups. B. Validation of DRscore using the UAMS-TT2 cohort.
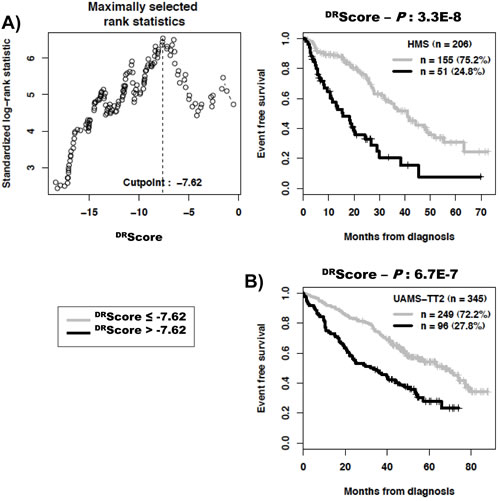
Figure 3: Link between DNA repair pathway score (DRscore) and patients event-free survival (EFS). The prognostic information provided by the 22 DNA repair genes was summed within a DRscore as defined in the Materials and Methods. The link between DRscore and patients EFS has been investigated using DRscore cut-off of -7.62 splitting patients in a high risk (27%) and low risk (73%) groups.
Cox univariate and multivariate analysis of DRscore for overall survival compared with the other prognostic clinical factors
Prognostic value for overall survival of DRscore was compared with usual prognostic factors - ISS, t(4;14), del17p - or 4 published GEP-based risk scores, UAMS-HRS[21], IFM score[22], GPI[23] and RS score[4]. Using univariate Cox analysis on HM cohort, all these factors had prognostic value and the DRscore had the higher hazard ratio (Table 2A). Using multivariate Cox analysis, DRscore, RS score, t(4;14), ISS, 2m and albumin kept prognostic value (Tables 2 B and 2C). Univariate cox analysis on UAMS-TT2 cohort showed that UAMS-HRS had the higher hazard ratio, followed by del17p, t(4;14), DRscore, GPI and IFM score, ISS, 2m and albumin (Table 2A). Using multivariate Cox analysis, DRscore remained significant when tested together with IFM score, RS score, t(4;14), del17p, ISS, 2m and albumin (Table 2C). However, it failed to be significant when tested together with UAMS-HRS, likely due to overfitting since UAMS-HRS was built using UAMS-TT2 cohort.
Table 2: Cox univariate and multivariate analysis of overall survival in HM and UAMS-TT2 patients’ cohorts. A) Cox univariate analysis of overall survival. The prognostic factors were tested as single variable. B) Cox multivariate analysis of overall survival. The DRscore were tested together with each of the prognostic factors. C) Cox multivariate analysis of overall survival using all prognostic factors together. Hazard ratios (HR) and P-values are shown. * A spike expression of MMSET gene was used a surrogate marker for t(4;14) as described[27]. NS, Not Significant at a 5% threshold; GPI, gene expression based proliferation index; ISS, International Staging System; UAMS-HRS, high-risk score from UAMS; IFM, Intergroupe Francophone du Myelome.
A |
Univariate Cox analysis - Overall survival |
B |
Multivariate Cox analysis - Overall survival |
|||||||
HMS |
UAMS - TT2 |
HMS |
UAMS - TT2 |
|||||||
HR |
P |
HR |
P |
HR |
P |
HR |
P |
|||
DRScore |
9 |
4.0E-11 |
1.9 |
1.6E-03 |
DRScore |
10 |
1.3E-10 |
1.1 |
NS |
|
UAMS HRS |
2.4 |
1.4E-02 |
4.7 |
4.8E-13 |
UAMS HRS |
0.75 |
NS |
4.4 |
1.8E-09 |
|
IFM score |
2.5 |
1.9E-02 |
1.8 |
4.0E-03 |
DRScore |
9 |
2.1E-10 |
1.6 |
1.8E-02 |
|
GPI |
2.6 |
1.6E-04 |
1.8 |
2.2E-04 |
IFM score |
1 |
NS |
1.5 |
4.8E-02 |
|
RS score |
4.2 |
3.3E-09 |
1.9 |
1.0E-05 |
DRScore |
8.2 |
6.4E-08 |
1.4 |
NS |
|
t(4;14)* |
3.3 |
4.7E-04 |
2.2 |
3.2E-04 |
GPI |
1.2 |
NS |
1.5 |
1.5E-02 |
|
del17p |
3.4 |
2.0E-02 |
2.5 |
3.7E-04 |
DRScore |
4.9 |
2.4E-04 |
1.2 |
NS |
|
ISS |
2 |
9.7E-04 |
1.6 |
5.5E-05 |
RS score |
1.9 |
2.3E-02 |
1.8 |
1.5E-03 |
|
B2M |
1.1 |
4.2E-05 |
1.1 |
4.9E-08 |
DRScore |
8.2 |
8.4E-10 |
1.7 |
1.1E-02 |
|
Alb |
0.47 |
1.4E-02 |
0.94 |
1.2E-04 |
t(4;14)* |
2.2 |
3.0E-02 |
2 |
2.9E-03 |
|
DRScore |
11 |
1.8E-11 |
1.7 |
9.3E-03 |
||||||
del17p |
2.8 |
NS |
2.1 |
3.2E-03 |
||||||
C |
Multivariate Cox analysis - Overall survival |
DRScore |
8.8 |
1.6E-10 |
1.7 |
1.1E-02 |
||||
HMS |
UAMS - TT2 |
ISS |
1.8 |
3.3E-03 |
1.5 |
3.4E-04 |
||||
HR |
P |
HR |
P |
DRScore |
9.1 |
5.8E-11 |
1.6 |
1.4E-02 |
||
DRScore |
18 |
2.1E-07 |
0.64 |
NS |
B2M |
1.1 |
1.0E-04 |
1.1 |
2.1E-06 |
|
UAMS HRS |
0.55 |
NS |
3.5 |
6.8E-06 |
DRScore |
9.2 |
1.8E-11 |
1.7 |
8.8E-03 |
|
IFM score |
0.34 |
NS |
0.95 |
NS |
Alb |
0.44 |
8.2E-03 |
0.95 |
6.6E-04 |
|
GPI |
0.86 |
NS |
1.3 |
NS |
||||||
RS score |
1.1 |
NS |
1.1 |
NS |
||||||
t(4;14)* |
2.7 |
3.8E-02 |
2.4 |
7.5E-04 |
||||||
del17p |
3.1 |
NS |
2.6 |
2.6E-04 |
||||||
ISS |
2.9 |
2.0E-04 |
1.5 |
1.3E-03 |
||||||
Cox univariate and multivariate analysis of DRscore for event free survival compared with the other prognostic clinical factors
Prognostic value for event free survival of DRscore was compared with the other prognostic factors mentioned above. Using univariate Cox analysis on HM cohort, all these factors were significantly associated with patients’ event free survival. The deletion 17p had the higher hazard ratio followed by DRscore (Table 3A). Using multivariate Cox analysis, DRscore, RS score, t(4;14), del17p, ISS, 2m and albumin, kept prognostic value. Univariate cox analysis on UAMS-TT2 cohort showed that UAMS-HRS had the higher hazard ratio followed by t(4;14) and DRscore. Using multivariate Cox analysis, DRscore remained an independent prognostic factor for EFS when tested together with UAMS-HRS, IFM score, RS score, t(4;14), del17p, ISS, 2m and albumin (Table 3C). GPI score failed to be significant.
Table 3: Cox univariate and multivariate analysis of event free survival (EFS) in HM and UAMS-TT2 patients’ cohorts. A) Cox univariate analysis of EFS. The prognostic factors were tested as single variable. B) Cox multivariate analysis of EFS. The DRscore were tested together with each of the prognostic factors. C) Cox multivariate analysis of EFS using all prognostic factors together. Hazard ratios (HR) and P-values are shown. * A spike expression of MMSET gene was used a surrogate marker for t(4;14) as described[27]. NS, Not Significant at a 5% threshold; GPI, gene expression based proliferation index; ISS, International Staging System; UAMS-HRS, high-risk score from UAMS; IFM, Intergroupe Francophone du Myelome.
A |
Univariate Cox analysis - Event free survival |
B |
Multivariate Cox analysis - Event free survival |
|||||||
HMS |
UAMS - TT2 |
HMS |
UAMS - TT2 |
|||||||
HR |
P |
HR |
P |
HR |
P |
HR |
P |
|||
DRScore |
3.1 |
1.4E-07 |
2.1 |
1.2E-06 |
DRScore |
2.9 |
9.7E-06 |
1.6 |
6.6E-03 |
|
UAMS HRS |
1.9 |
5.3E-03 |
3.5 |
3.8E-11 |
UAMS HRS |
1.2 |
NS |
2.7 |
2.6E-06 |
|
IFM score |
1.9 |
1.6E-02 |
1.9 |
5.2E-05 |
DRScore |
2.9 |
2.7E-06 |
1.9 |
1.3E-04 |
|
GPI |
1.8 |
3.3E-04 |
1.5 |
4.1E-04 |
IFM score |
1.2 |
NS |
1.6 |
5.8E-03 |
|
RS score |
2 |
2.7E-06 |
1.7 |
9.3E-06 |
DRScore |
2.6 |
1.3E-04 |
1.9 |
6.5E-04 |
|
t(4;14)* |
3.1 |
2.9E-05 |
2.4 |
9.2E-07 |
GPI |
1.3 |
NS |
1.2 |
NS |
|
del17p |
3.4 |
2.5E-03 |
2 |
1.3E-03 |
DRScore |
2.1 |
6.9E-03 |
1.7 |
7.2E-03 |
|
ISS |
1.3 |
2.3E-02 |
1.5 |
7.2E-07 |
RS score |
1.5 |
4.3E-02 |
1.4 |
3.5E-02 |
|
B2M |
1 |
6.7E-03 |
1.1 |
6.7E-10 |
DRScore |
2.7 |
1.0E-05 |
2 |
1.4E-05 |
|
Alb |
0.68 |
5.0E-02 |
0.96 |
2.8E-03 |
t(4;14)* |
2.3 |
3.6E-03 |
2.2 |
1.5E-05 |
|
DRScore |
3.3 |
7.6E-08 |
2 |
1.0E-05 |
||||||
del17p |
2.7 |
1.4E-02 |
1.7 |
1.6E-02 |
||||||
C |
Multivariate Cox analysis - Event free survival |
DRScore |
3.4 |
2.7E-08 |
1.9 |
2.9E-05 |
||||
HMS |
UAMS - TT2 |
ISS |
1.3 |
4.8E-02 |
1.5 |
1.5E-05 |
||||
HR |
P |
HR |
P |
DRScore |
3.3 |
4.9E-08 |
1.9 |
6.6E-05 |
||
DRScore |
2.4 |
8.7E-03 |
1.1 |
NS |
B2M |
1 |
4.1E-02 |
1.1 |
1.7E-07 |
|
UAMS HRS |
1 |
NS |
1.8 |
1.4E-02 |
DRScore |
3.1 |
1.1E-07 |
2 |
7.9E-06 |
|
IFM score |
1.1 |
NS |
1.3 |
NS |
Alb |
0.67 |
4.9E-02 |
0.97 |
1.9E-02 |
|
GPI |
1.1 |
NS |
1.3 |
NS |
||||||
RS score |
1.1 |
NS |
0.94 |
NS |
||||||
t(4;14)* |
2.3 |
9.2E-03 |
2.6 |
8.4E-06 |
||||||
del17p |
2.7 |
2.6E-02 |
2.1 |
1.1E-03 |
||||||
ISS |
1.4 |
3.8E-02 |
1.5 |
3.2E-05 |
||||||
Link of DRscore with patients’ clinical and genetic parameters.
The frequencies of patients with high lactate dehydrogenase or C-reactive protein levels were significantly increased in patients with high risk DRscore (P ≤ .05, Table 4). Others clinical data – age, β2m, albumin, hemoglobin, ISS staging, Salmon-Durie staging, light or heavy chain isotype and occurrence of bone lesions - were not significantly different between the 2 DRscore groups. The frequency of patients with t(4;14),1q21, del17p or del13 was significantly increased in the high risk DRscore group (P ≤ .05, Table 5).
Table 4: Clinical characteristics of patients in the 2 groups defined by DRscore. The 206 previously-untreated patients of the HM cohort were treated at the university hospitals of Heidelberg and Montpellier. Patients were separated in 2 groups: low-risk (DRscore ≤ -7.62) and high-risk (DRscore > -7.62) DRscore groups. Data are the percentages of patients within these 2 groups with the indicated clinical or biological parameters. When the percentages were different with a chisquare test (P ≤ .05), data are shown in bold.
Categories |
DRScore groups |
|
DRScore ≤ -7.62 |
DRScore > -7.62 |
|
% of patients in each group |
||
Age >= 65 yr |
17% |
25% |
IgA subtype |
21% |
27% |
Kappa light chain |
66% |
55% |
Lambda light chain |
30% |
43% |
Non-secreting |
2% |
2% |
B2M<= 3.5 mg/ml |
66% |
55% |
B2M> 5.5 mg/ml |
15% |
20% |
LDH>= 240 IU/liter |
20% |
32% |
Albumin < 35 g/liter |
32% |
31% |
Hemoglobin< 10 g/dl |
26% |
37% |
C-reactive protein >= 5 mg/liter |
31% |
51% |
Bone lesions |
||
0: normal bone structure |
22% |
17% |
1: osteopenie / osteoporosis |
32% |
29% |
2: osteolyse [1-3] |
6% |
10% |
3: major structural damage [>3] |
39% |
45% |
|
DRScore ≤ -7.62(n = 155) |
DRScore > -7.62 (n = 51) |
||||
Staging |
I |
II |
III |
I |
II |
III |
Salmon-Durie |
12% |
15% |
73% |
8% |
16% |
76% |
ISS |
51% |
34% |
15% |
39% |
41% |
20% |
Prognostic value of scores integrating genes coding for either NHEJ, HR, FA, NER or MMR DNA repair pathways
The global DNA repair score described above incorporates all prognostic genes coding for the various DNA repair pathways. Despite a reduced number of prognostic genes coding for a specific pathway (Table 1), we looked whether scores built using the same methodology as the global DNA repair score and specific for a pathway could have prognostic value. Using maxstat analysis for overall survival, NHEJ, HR, FANC or NER scores were significantly associated with high-risk myeloma in the 2 independent patients’ cohorts, HM and UAMS-TT2 (Figure 4). MMR score had only prognostic value for the HM cohort and BER score was not considered since it comprises one prognostic gene only.
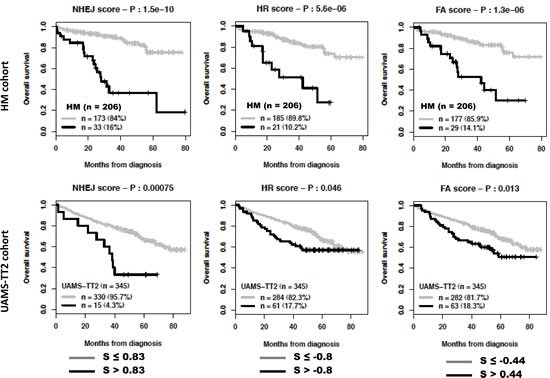
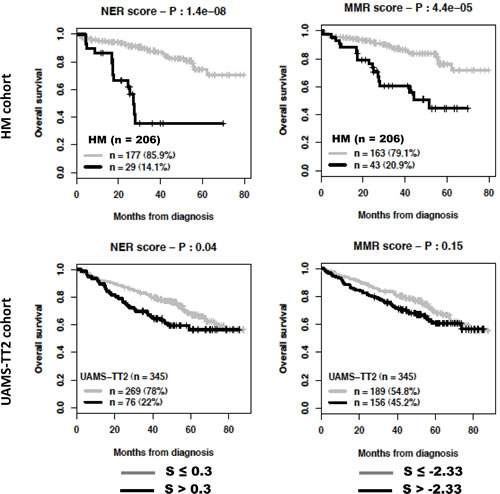
Figure 4: Prognostic value of NHEJ, HR, FA, NER and MMR DNA repair pathways. For a given pathway, a prognostic score was calculated, as described in the Materials and Methods, by integrating the prognostic information provided by the prognostic genes coding for proteins involved in the pathway. NHEJ: non-homologous end joining; HR: homologous recombination; FA: fanconi anemia pathway; NER: nucleotide excision repair; MMR: mismatch repair; S: score..
Table 5: Link of DRscore with patients’ genetic abnormalities Interphase-FISH-analysis was performed on CD138-purified plasma cells of 153 to 169 patients of the HM series, depending on the gene abnormality. Patients were separated in two groups according to DRscore (low-risk and high-risk groups). Data are the percentages of patients within these 2 groups with the biological parameters. When the percentages were different with a chisquare test (P ≤ .05), data are shown in bold.
|
DRscore ≤ -7.62 |
DRscore > -7.62 |
t(11;14)+(n = 27) |
17% |
15% |
t(11;14)-(n = 140) |
83% |
85% |
t(4;14)+(n = 28) |
13% |
28% |
t(4;14)-(n = 137) |
87% |
72% |
1q21+(n = 62) |
33% |
59% |
1q21-(n = 91) |
67% |
41% |
del13+(n = 91) |
45% |
77% |
del13-(n = 78) |
55% |
23% |
del17+(n = 27) |
14% |
24% |
del17-(n = 132) |
85% |
76% |
Discussion
By selecting genes coding for proteins involved in repair of DNA damages, we have built a DNA repair score assembling genes encoding for the various DNA repair pathways. This is particularly relevant since these various pathways are tightly linked and inter-dependent to repair DNA [10, 11]. The DRscore is predictive for both event free and overall survival as evaluated in two independent cohorts of patients with MM. It remained an independent prognostic factor when tested together with known molecular prognostic factors such as previously-published GEP-based risk scores, t(4;14), del17p and with standard clinical prognostic factors, ISS, 2m and albumin in two independent large patients’ cohorts. The UAMS-TT2 cohort is particularly relevant in comparing the prognostic value of these factors, excluding UAMS-HRS, as DRscore was not designed on this cohort, which avoids overfitting. Of note, prognostic scores assembling genes coding for a specific DNA repair pathway can be also built, despite the reduced number of prognostic genes for each pathway.
DNA repair pathways are deregulated in many MM patients and could provide adaptive mechanisms to trigger drug resistance[9]. Novel compounds targeting DNA repair pathways are being clinically evaluated in patients with cancer inducing synthetic lethality[16]. The principle of synthetic lethality is that tumor cells have deregulated cell cycle and/or DNA repair by inactivating some pathways, in particular the p53 pathway, making their survival dependent on remaining pathways. Targeting these remaining pathways will make cells unable to repair DNA damages, complete cell cycle or gene transcription, and bring them to death[16, 34-37]. The current prognostic scores integrating genes coding for NHEJ, HR, FA NER, or MMR pathways could be of interest to identify patients with MM who could benefit from inhibitors targeting key component in these pathways. In particular inhibitors to DNA-PKs (NHEJ), RAD51 (HR), PARP1/2 (HR, altNHEJ, BER), CHK2 (HR, altNHEJ), CHK1 (HR, NER) are currently under clinical investigation in various cancers[16, 34]. A clinical trial investigating the efficacy of PARP1/2 inhibitors in patients with MM resistant to proteasome inhibitors is under development[38]. Indeed, proteasome inhibitors block Fanconi anemia and homologous recombination pathways, rendering MM cells addict on BER initiated by PARP1/2-mediated Poly(ADP-ribosyl)ation of proteins[38]. It is of major interest to look for whether the DRscore in MMCs prior treatment could predict for the response of patients to DNA repair inhibitors. In this case, this DRscore will be of use in stratifying MM patients and exploiting the addiction of tumor cells to a specific DNA repair pathway.
Methods
Patient samples and gene expression data
Multiple Myeloma cells (MMCs) were purified from the 206 patients with newly-diagnosed MM after written informed consent was given at the University hospitals of Heidelberg (Germany) or Montpellier (France) as described[24]. Clinical characteristics of the HM cohort are provided in Supplementary Table S1. The study was approved by the ethics boards of the University Hospitals of Heidelberg and Montpellier. Gene expression profiling (GEP) of purified MMCs was assayed using Affymetrix U133 2.0 plus microarrays as described[25] and data normalized using the MAS5 Affymetrix algorithm with a scaling factor of 500. The .CEL and MAS5 files are deposited in the ArrayExpress public database (http://www.ebi.ac.uk/arrayexpress/) under accession number E-MTAB-362. We also used publicly available MAS5 normalized GEP data (GEO, http://www.ncbi.nlm.nih.gov/geo/, accession number GSE2658) from purified MMCs of a cohort of 345 patients treated with total therapy 2 protocol (UAMS-TT2 cohort) at the University of Arkansas for Medical Sciences (UAMS, Little Rock, USA) [26]. As iFISH data were not available for UAMS-TT2 patients, t(4;14) translocation was evaluated using MMSET spike expression [27] and del17p13 surrogated by the level of TP53 [28].
Statistical analysis
Affymetrix gene expression data were normalized using MAS5 Affymetrix algorithm with a scaling factor of 500. The statistical significance of differences in overall survival between groups of patients was calculated by the log-rank test. Multivariate analysis was performed using the Cox proportional hazards model. Survival curves were plotted using the Kaplan-Meier method. All these analyses have been done with R.2.10.1 (http://www.r-project.org/) and bioconductor version 2.5[29, 30]. Gene annotation and networks were generated through the use of Ingenuity Pathways Analysis (Ingenuity® Systems, Redwood City, CA).
Construction of a DNA Repair Pathway-Focused Score
A consensus list set of 84 genes coding for the main 6 DNA repair pathways has been obtained by review of Medline and the current knowledge of DNA repair pathways [11, 16, 20](Supplementary Table S2). The prognostic value of each of the 84 genes was computed using maximally selected rank test from R package MaxStat (http://cran.r-project.org/web/packages/maxstat/index.html) on HM patient cohort and Benjamini Hochberg multiple testing correction, yielding to 22 genes whose expression values was significantly (P ≤ .05) associated with both event-free (EFS) and overall survival (OS). A DNA repair pathway score (termed DRscore) was built to group the prognostic information of these 22 genes within one parameter using a methodology which was proven as powerful in building various gene expression based risk scores[4, 31-33]. For each of the 22 DNA repair genes, the odd ratio of the Cox analysis on the HM cohort were determined with R MaxStat package, and for each patient, these odd ratios were weighted by +1 if the patient’s gene expression is above the Maxstat cutoff, and -1 if below or equal this cutoff. The DRscore of a given patient was the sum of these weighted odd ratios for the 22 prognostic genes. DRscore ranges from -22.45 to +21.59 and the higher the DRscore is, the worse the prognosis is. Patients from the same cohort were ranked according to increased DRscore and for a given value S, the difference in overall survival of patients with a DRscore ≤ S or > S was computed, making it possible to define the DRscore value with a maximum difference in survival using maximally selected rank test from R package MaxStat.
Acknowledgements
This work was supported by grants from University Hospital of Montpellier (CEP-IRB), from ARC (SL220110603450, Paris France), the Institut National du Cancer (INCA, Paris, France, 2012-109/087437), the European Community (FP7-OVERMYR), the Tumorzentrum Heidelberg/Mannheim, Germany, and the Deutsche Krebshilfe, Bonn, Germany, the Deutsche Forschungsgemeinschaft (Transregio TRR 79), Bonn, Germany.
Author contributions:
KA and CG performed the analysis and wrote the paper. GC, SS, RT, GH, CA, PP, and HD wrote the paper. KB is the senior investigator who designed research and wrote the paper.
References
1. Siegel R, Naishadham D and Jemal A. Cancer statistics, 2012. CA Cancer J Clin. 2012; 62(1):10-29.
2. Fonseca R, Bergsagel PL, Drach J, Shaughnessy J, Gutierrez N, Stewart AK, Morgan G, Van Ness B, Chesi M, Minvielle S, Neri A, Barlogie B, Kuehl WM, Liebisch P, Davies F, Chen-Kiang S, et al. International Myeloma Working Group molecular classification of multiple myeloma: spotlight review. Leukemia. 2009; 23(12):2210-2221.
3. Avet-Loiseau H. Ultra high-risk myeloma. Hematology Am Soc Hematol Educ Program. 2010; 2010:489-493.
4. Reme T, Hose D, Theillet C and Klein B. Modeling risk stratification in human cancer. Bioinformatics. 2013; 29(9):1149-1157.
5. Fonseca R, Debes-Marun CS, Picken EB, Dewald GW, Bryant SC, Winkler JM, Blood E, Oken MM, Santana-Davila R, Gonzalez-Paz N, Kyle RA, Gertz MA, Dispenzieri A, Lacy MQ and Greipp PR. The recurrent IgH translocations are highly associated with nonhyperdiploid variant multiple myeloma. Blood. 2003; 102(7):2562-2567.
6. Chesi M and Bergsagel PL. Many multiple myelomas: making more of the molecular mayhem. Hematology Am Soc Hematol Educ Program. 2011; 2011:344-353.
7. Avet-Loiseau H, Gerson F, Magrangeas F, Minvielle S, Harousseau JL and Bataille R. Rearrangements of the c-myc oncogene are present in 15% of primary human multiple myeloma tumors. Blood. 2001; 98(10):3082-3086.
8. Avet-Loiseau H, Attal M, Campion L, Caillot D, Hulin C, Marit G, Stoppa AM, Voillat L, Wetterwald M, Pegourie B, Voog E, Tiab M, Banos A, Jaubert J, Bouscary D, Macro M, et al. Long-term analysis of the IFM 99 trials for myeloma: cytogenetic abnormalities [t(4;14), del(17p), 1q gains] play a major role in defining long-term survival. J Clin Oncol. 2012; 30(16):1949-1952.
9. Gourzones C, Ferrand FR, Amiel C, Verillaud B, Barat A, Guerin M, Gattolliat CH, Gelin A, Klibi J, Chaaben AB, Schneider V, Guemira F, Guigay J, Lang P, Jimenez-Pailhes AS and Busson P. Consistent high concentration of the viral microRNA BART17 in plasma samples from nasopharyngeal carcinoma patients--evidence of non-exosomal transport. Virol J. 2013; 10:119.
10. Lindahl T. Instability and decay of the primary structure of DNA. Nature. 1993; 362(6422):709-715.
11. Ciccia A and Elledge SJ. The DNA damage response: making it safe to play with knives. Mol Cell. 2010; 40(2):179-204.
12. Jiricny J. The multifaceted mismatch-repair system. Nat Rev Mol Cell Biol. 2006; 7(5):335-346.
13. Friedberg EC. How nucleotide excision repair protects against cancer. Nat Rev Cancer. 2001; 1(1):22-33.
14. Deans AJ and West SC. DNA interstrand crosslink repair and cancer. Nat Rev Cancer. 2011; 11(7):467-480.
15. Constantinou A. Rescue of replication failure by Fanconi anaemia proteins. Chromosoma. 2012; 121(1):21-36.
16. Shaheen M, Allen C, Nickoloff JA and Hromas R. Synthetic lethality: exploiting the addiction of cancer to DNA repair. Blood. 2011; 117(23):6074-6082.
17. Keats JJ, Chesi M, Egan JB, Garbitt VM, Palmer SE, Braggio E, Van Wier S, Blackburn PR, Baker AS, Dispenzieri A, Kumar S, Rajkumar SV, Carpten JD, Barrett M, Fonseca R, Stewart AK, et al. Clonal competition with alternating dominance in multiple myeloma. Blood. 2012; 120(5):1067-1076.
18. Magrangeas F, Avet-Loiseau H, Munshi NC and Minvielle S. Chromothripsis identifies a rare and aggressive entity among newly diagnosed multiple myeloma patients. Blood. 2011; 118(3):675-678.
19. Neri P, Ren L, Gratton K, Stebner E, Johnson J, Klimowicz A, Duggan P, Tassone P, Mansoor A, Stewart DA, Lonial S, Boise LH and Bahlis NJ. Bortezomib-induced “BRCAness” sensitizes multiple myeloma cells to PARP inhibitors. Blood. 2011; 118(24):6368-6379.
20. Lieber MR. The mechanism of double-strand DNA break repair by the nonhomologous DNA end-joining pathway. Annu Rev Biochem. 2010; 79:181-211.
21. Shaughnessy JD, Jr., Zhan F, Burington BE, Huang Y, Colla S, Hanamura I, Stewart JP, Kordsmeier B, Randolph C, Williams DR, Xiao Y, Xu H, Epstein J, Anaissie E, Krishna SG, Cottler-Fox M, et al. A validated gene expression model of high-risk multiple myeloma is defined by deregulated expression of genes mapping to chromosome 1. Blood. 2007; 109(6):2276-2284.
22. Decaux O, Lode L, Magrangeas F, Charbonnel C, Gouraud W, Jezequel P, Attal M, Harousseau JL, Moreau P, Bataille R, Campion L, Avet-Loiseau H and Minvielle S. Prediction of survival in multiple myeloma based on gene expression profiles reveals cell cycle and chromosomal instability signatures in high-risk patients and hyperdiploid signatures in low-risk patients: a study of the Intergroupe Francophone du Myelome. J Clin Oncol. 2008; 26(29):4798-4805.
23. Hose D, Reme T, Hielscher T, Moreaux J, Meissner T, Seckinger A, Benner A, Shaughnessy JD, Barlogie B, Zhou Y, Hillengass J, Bertsch U, Neben K, Mohler T, Rossi JF, Jauch A, et al. Proliferation is a central independent prognostic factor and target for personalized and risk adapted treatment in multiple myeloma. Haematologica. 2011; 96(1):87-95.
24. Goldschmidt H, Sonneveld P, Cremer FW, van der Holt B, Westveer P, Breitkreutz I, Benner A, Glasmacher A, Schmidt-Wolf IG, Martin H, Hoelzer D, Ho AD, Lokhorst HM, Hovon and Gmmg. Joint HOVON-50/GMMG-HD3 randomized trial on the effect of thalidomide as part of a high-dose therapy regimen and as maintenance treatment for newly diagnosed myeloma patients. Ann Hematol. 2003; 82(10):654-659.
25. De Vos J, Thykjaer T, Tarte K, Ensslen M, Raynaud P, Requirand G, Pellet F, Pantesco V, Reme T, Jourdan M, Rossi JF, Orntoft T and Klein B. Comparison of gene expression profiling between malignant and normal plasma cells with oligonucleotide arrays. Oncogene. 2002; 21(44):6848-6857.
26. Barlogie B, Tricot G, Rasmussen E, Anaissie E, van Rhee F, Zangari M, Fassas A, Hollmig K, Pineda-Roman M, Shaughnessy J, Epstein J and Crowley J. Total therapy 2 without thalidomide in comparison with total therapy 1: role of intensified induction and posttransplantation consolidation therapies. Blood. 2006; 107(7):2633-2638.
27. Sprynski AC, Hose D, Caillot L, Reme T, Shaughnessy JD, Jr., Barlogie B, Seckinger A, Moreaux J, Hundemer M, Jourdan M, Meissner T, Jauch A, Mahtouk K, Kassambara A, Bertsch U, Rossi JF, et al. The role of IGF-1 as a major growth factor for myeloma cell lines and the prognostic relevance of the expression of its receptor. Blood. 2009; 113(19):4614-4626.
28. Xiong W, Wu X, Starnes S, Johnson SK, Haessler J, Wang S, Chen L, Barlogie B, Shaughnessy JD, Jr. and Zhan F. An analysis of the clinical and biologic significance of TP53 loss and the identification of potential novel transcriptional targets of TP53 in multiple myeloma. Blood. 2008; 112(10):4235-4246.
29. Gentleman RC, Carey VJ, Bates DM, Bolstad B, Dettling M, Dudoit S, Ellis B, Gautier L, Ge Y, Gentry J, Hornik K, Hothorn T, Huber W, Iacus S, Irizarry R, Leisch F, et al. Bioconductor: open software development for computational biology and bioinformatics. Genome Biol. 2004; 5(10):R80.
30. Team RDC. R: A Language and Environment for Statistical Computing. Vienna, Austria: R Foundation for Statistical Computing; 2008. 2008.
31. Kassambara A, Hose D, Moreaux J, Reme T, Torrent J, Rossi JF, Goldschmidt H and Klein B. Identification of pluripotent and adult stem cell genes unrelated to cell cycle and associated with poor prognosis in multiple myeloma. PLoS ONE. 2012; 7(7):e42161.
32. Kassambara A, Hose D, Moreaux J, Walker BA, Protopopov A, Reme T, Pellestor F, Pantesco V, Jauch A, Morgan G, Goldschmidt H and Klein B. Genes with a spike expression are clustered in chromosome (sub)bands and spike (sub)bands have a powerful prognostic value in patients with multiple myeloma. Haematologica. 2012; 97(4):622-630.
33. Moreaux J, Reme T, Leonard W, Veyrune JL, Requirand G, Goldschmidt H, Hose D and Klein B. Development of gene expression-based score to predict sensitivity of multiple myeloma cells to DNA methylation inhibitors. Mol Cancer Ther. 2012; 11(12):2685-2692.
34. Smith J, Tho LM, Xu N and Gillespie DA. The ATM-Chk2 and ATR-Chk1 pathways in DNA damage signaling and cancer. Adv Cancer Res. 2010; 108:73-112.
35. Hawtin RE, Stockett DE, Wong OK, Lundin C, Helleday T and Fox JA. Homologous recombination repair is essential for repair of vosaroxin-induced DNA double-strand breaks. Oncotarget. 2010; 1(7):606-619.
36. Mancias JD and Kimmelman AC. Targeting autophagy addiction in cancer. Oncotarget. 2011; 2(12):1302-1306.
37. Hall A, Meyle KD, Lange MK, Klima M, Sanderhoff M, Dahl C, Abildgaard C, Thorup K, Moghimi SM, Jensen PB, Bartek J, Guldberg P and Christensen C. Dysfunctional oxidative phosphorylation makes malignant melanoma cells addicted to glycolysis driven by the (V600E)BRAF oncogene. Oncotarget. 2013; 4(4):584-599.
38. Neri P and Bahlis NJ. Genomic instability in multiple myeloma: mechanisms and therapeutic implications. Expert Opin Biol Ther. 2013; 13 Suppl 1:S69-82