
INTRODUCTION
Hypopharyngeal squamous cell carcinoma (HSCC), which originates from the mucosa of the hypopharynx, has one of the poorest prognoses among head and neck cancers [1]. Currently, the standard treatment strategy for HSCC is surgery followed by radiotherapy [1]. Significant advances in radiotherapeutic strategies for HSCC, such as intensity-modulated radiotherapy (IMRT), image-guided radiotherapy (IGRT), and helical tomotherapy (TOMO), have been made in recent years [1, 2]. However, local recurrence and distant metastases after radiotherapy due to tumor radioresistance remain a serious obstacle to successful treatment of HSCC, and the 5-year survival rate remains at approximately 25% to 40% [3]. Although mechanisms of radioresistance have been extensively studied [4, 5], the underlying molecular pathways and targets involved in HSCC radioresistance are not fully understood. Currently, there are few strategies available for overcoming this clinical problem.
In the past decade, advances in genome-wide analysis of gene expression have revealed that the majority of genes in the genome are transcribed into non-coding RNAs (ncRNAs) [6]. Long non-coding RNAs (lncRNAs) are ncRNAs longer than 200 nucleotides [7], and they have important roles in chromatin modification and transcriptional and post-transcriptional processing [8, 9]. Specifically, lncRNAs have been demonstrated to promote the development, invasion, and metastasis of many tumors by a variety of mechanisms [10, 11]. Notably, several studies have shown that lncRNAs are extremely important for controlling cancer radioresistance [12–15], but the roles of lncRNAs in HSCC radioresistance are still unknown.
Accumulating evidence demonstrates that lncRNAs are widely involved in the regulation of proliferation, DNA damage response, apoptosis, and the cell cycle in cancer cells [16–22], all of which are closely associated with the development of radioresistance [23]. Moreover, the roles of several lncRNAs, such as MALAT1 [13, 24], TUG1 [14], NEAT1 [25], and BOKAS [26], in radioresistance have been identified, although their detailed mechanisms remain largely unclear. Radioresistance is the leading cause of recurrence and poor prognosis in HSCC patients. Hence, it is of vital significance to figure out whether or not lncRNAs can become biomarkers for radioresistant HSCC and explore the molecular mechanisms underlying HSCC radioresistance.
It is very unlikely that a single molecule or gene is responsible for radioresistance in HSCC; therefore, to provide useful information for elucidating the molecular mechanisms that lncRNAs and mRNAs are involved in HSCC radioresistance, we used microarray techniques to perform large-scale analyses of lncRNA and mRNA expressions to comprehensively search for mechanisms of HSCC radioresistance. We initially generated a radioresistant HSCC subclone (RS-FaDu) from the parental FaDu cell line via long-term fractionated irradiation. Subsequently, we investigated differences in time-course lncRNA and mRNA expression profiles between RS-FaDu and parent FaDu cells after radiation therapy by microarray and bioinformatics analyses.
RESULTS
Establishment and validation of radioresistant HSCC subclone cell line
Radioresistance was measured by clonogenic survival assay following exposure to a range of radiation doses (0–6 Gy). As shown in Figure 1A, RS-FaDu and FaDu cells showed no difference in clonogenic formation ability when the radiation dose was 0 Gy. However, the RS-FaDu cells had significantly more and larger surviving colonies than did the control FaDu cells when the radiation dose was 4 Gy or 6 Gy. Clonogenic survival curves showed the surviving colony numbers of FaDu cells were significantly lower than those of RS-FaDu cells (**P < 0.01, both) at 4 Gy and 6 Gy (Figure 1B).
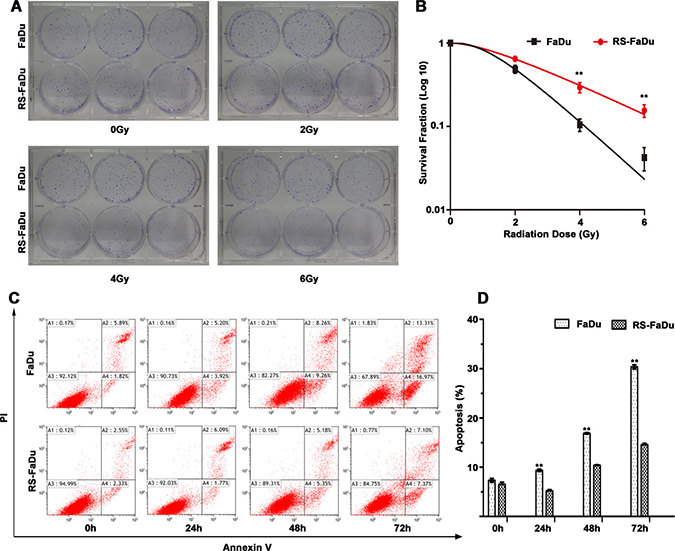
Figure 1: Radioresistance measurement by clonogenic survival assay and apoptosis assay. (A) RS-FaDu and parental FaDu cells irradiated with different radiation doses (0, 2, 4, and 6 Gy) and the crystal violet-stained colonies were photographed at 12 days after irradiation. (B) Colonies containing more than 50 cells for survival colonies and scoring. (C) RS-FaDu and FaDu cells irradiated with 4 Gy. The apoptosis detection by FCM Annexin V/PI staining. The proportions of Annexin V+/PI− and Annexin V+/PI+ cells for early- and late-stage apoptosis. (D) At 0 h after irradiation with 4 Gy, there was no difference between RS-FaDu and FaDu in their fractions of apoptosis cells. At 24 h, 48 h, or 72 h after irradiation, the fraction of apoptosis cells in RS-FaDu cells was lower than that in FaDu cells. All experiments were performed in triplicate wells; points, mean; bars, SD. **P < 0.01.
To further verify the radioresistant phenotype of RS-FaDu, RS-FaDu and FaDu cells were also examined by apoptosis assays. RS-FaDu and FaDu cells were treated with 4 Gy. Their fractions of apoptosis cells did not differ at 0 h, but at 24, 48, or 72 h after irradiation, the fractions of apoptotic RS-FaDu cells were much lower than those of FaDu cells (**P < 0.01, Figure 1C, 1D). These results indicated that RS-FaDu cells were much more radioresistant than their parent FaDu cells. These data indicated that the RS-FaDu subclone cell line was successfully established.
LncRNA and mRNA profiles
Hierarchical clustering is an unsupervised classification method that can separate multiple groups without the use of the group information. In microarray data analysis, cluster analysis grouped samples together based on expression intensity revealed differences between clustering group and true group results for removal of outlier samples. The dendrogram showed the relationships among lncRNA (Figure 2A) and mRNA (Figure 2B) expression patterns between RS-FaDu cells and FaDu cells at 0, 2, and 48 h, respectively, after 4 Gy radiation exposure.
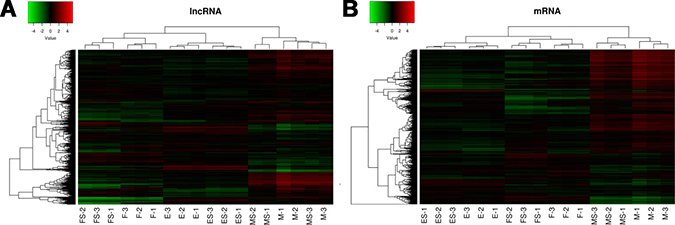
Figure 2: LncRNA (A) and mRNA (B) expression profiling by human lncRNA microarray. The sample tree on the top of the figure shows sample group information, which reflects relationships among samples. In the dendrogram, red indicates high relative expression, and blue indicates low relative expression. M, E, and F refer to 0 hr, 2 hrs, and 48 hrs after exposure to 4 Gy irradiation, respectively. The Arabic numerals presented the experiment repeats.
A scatter plot is a visualization method to show the differentially expressed lncRNAs (Figure 3, A1–C1) and mRNAs (Figure 3, D1–F1). The values plotted on the X and Y axes were the averaged normalized signal values of groups of samples (log2 scaled). The X-axis represents the control group (FaDu), while the Y-axis represents the case group (RS-FaDu). All lncRNAs/mRNAs that were not differentially expressed were around the line Y = X and labelled black. Points that were above and apart from Y = X were upregulated lncRNAs/mRNAs and labelled red, and points that were below and apart from Y = X were downregulated lncRNAs/mRNAs and labelled green, respectively. A volcano plot is another visualization method to show differences in lncRNA (Figure 3, A2–C2) and mRNA (Figure 3, D2–F2) expression between the case group (RS-FaDu) and the control group (FaDu). The X-axis in the volcano plot represents FC (after log2 transformation) and the Y-axis represents P-value (after log transformation). The lncRNAs/mRNAs on the top left were downregulated lncRNAs/mRNAs (FC ≥ 2.0, P value < 0.05). The lncRNAs/mRNAs on the top right were upregulated lncRNAs/mRNAs (FC ≥ 2.0, P value < 0.05). Upregulated lncRNAs/mRNAs and downregulated lncRNAs/mRNAs were labelled red and green, respectively. After the RS-FaDu and FaDu cells were treated with 4 Gy of irradiation, their lncRNA expression levels differed significantly in 575, 361, and 1714 lncRNAs (data not shown) at 0, 2, and 48 h, respectively. Of those, 302 were upregulated and 273 were downregulated at 0 h; 113 were upregulated and 248 were downregulated at 2 h; and 759 were upregulated and 955 were downregulated at 48 h, respectively. In addition, we identified 1249, 781, and 2521 (data not shown) mRNAs that were significantly differentially expressed at 0, 2, and 48 h, respectively. Of those, 387 were upregulated and 862 were downregulated at 0 h; 227 were upregulated and 554 were downregulated at 2 h; and 1089 were upregulated and 1432 were downregulated at 48 h. Volcano plot filtering was also used to identify the 10 most upregulated and downregulated lncRNAs (Table 1) and mRNAs (Table 2) in RS-FaDu cells at 0, 2, and 48 h after 4 Gy radiation, respectively.
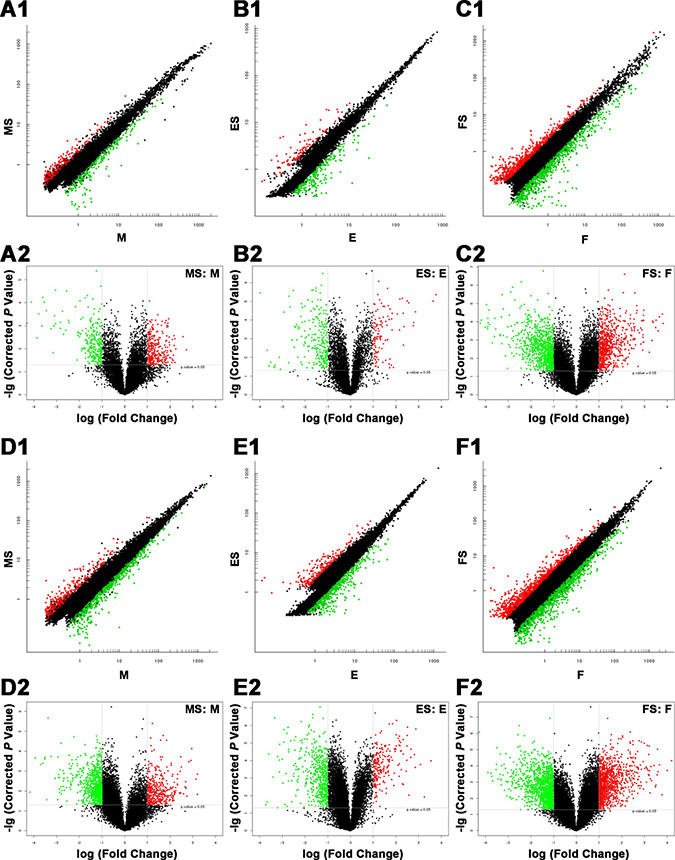
Figure 3: Differences in lncRNA and mRNA expression profiles between RS-FaDu cells and parental FaDu cells. (A1–F1) Scatter plots. Scatter plot showed the differentially expressed lncRNAs (A1–C1) and mRNAs (D1–F1). The values on the X and Y axes from the averaged normalized signal values of groups of samples (log2 scaled). X-axis for control group (FaDu), and Y-axis for case group (RS-FaDu). All the lncRNAs/mRNAs without differential expression around the line Y = X in black. Points above Y = X and apart from Y = X are upregulated lncRNAs/mRNAs in red, and points below Y = X and apart from Y = X are downregulated lncRNAs/mRNAs in green, respectively. The threshold for differentially expressed genes was set at FC ≥ 2.0. (A2–F2) Volcano plots for the differences in lncRNA (A2–C2) and mRNA (D2–F2) expression between the case group (RS-FaDu) and control group (FaDu). The X-axis in the volcano plot represents FC (after log2 transformation) and the Y-axis in the plot represents P-value (after log transformation). The lncRNAs/mRNAs on the top left show downregulated lncRNAs/mRNAs (FC ≥ 2.0, P < 0.05). The lncRNAs/mRNAs on the top right show upregulated lncRNAs/mRNAs (FC ≥ 2.0, P < 0.05). Upregulated lncRNAs/mRNAs and downregulated lncRNAs/mRNAs are shown in red and green, respectively. MS vs. M, 0 h; ES vs. E, 2 h; FS vs. F, 48 h.
Table 1: Ten most upregulated and downregulated lncRNAs in RS-FaDu cells at 0, 2, and 48 h after 4 Gy radiation
Probe name |
FC (abs) |
Regulation |
lncRNA ID |
Chr |
Strand |
Gene |
Class |
Time |
|---|---|---|---|---|---|---|---|---|
p7538 |
6.58 |
up |
ENST00000587434.1 |
17 |
+ |
ENSG00000267601.1 |
Antisense |
0 h |
p28462 |
5.94 |
up |
ASO3704 |
ASO3704 |
Intergenic |
0 h |
||
p8064 |
4.75 |
up |
ENST00000563172.1 |
18 |
+ |
ENSG00000261780.2 |
Intergenic |
0 h |
p19771 |
4.63 |
up |
TCONS_00023442 |
15 |
+ |
XLOC_011287 |
Intergenic |
0 h |
p37817_v4 |
4.62 |
up |
ENST00000607175.1 |
6 |
− |
ENSG00000272468.1 |
0 h |
|
p35075_v4 |
4.54 |
up |
ENST00000594101.1 |
3 |
+ |
ENSG00000242086.3 |
Intergenic |
0 h |
p35072_v4 |
4.51 |
up |
ENST00000597871.1 |
3 |
+ |
ENSG00000242086.3 |
Intergenic |
0 h |
p11909 |
4.41 |
up |
ENST00000519700.1 |
3 |
+ |
ENSG00000242770.2 |
Intergenic |
0 h |
p6707 |
4.38 |
up |
ENST00000578710.1 |
17 |
− |
ENSG00000264673.1 |
Intergenic |
0 h |
p35069_v4 |
4.30 |
up |
ENST00000438608.1 |
3 |
+ |
ENSG00000242086.3 |
Intergenic |
0 h |
p33918 |
19.81 |
down |
hox-HOXD10-35 |
2 |
+ |
hox-HOXD10-35 |
Intronic |
0 h |
p33919 |
17.23 |
down |
hox-HOXD10-36 |
2 |
+ |
hox-HOXD10-36 |
Intronic |
0 h |
p28077 |
14.53 |
down |
nc-HOXD10-9 |
2 |
+ |
nc-HOXD10-9 |
Intronic |
0 h |
p5033 |
13.80 |
down |
ENST00000556653.1 |
14 |
+ |
ENSG00000258914.1 |
Intergenic |
0 h |
p28072 |
12.49 |
down |
nc-HOXD10-13 |
2 |
+ |
nc-HOXD10-13 |
Intronic |
0 h |
p10912 |
12.20 |
down |
ENST00000430181.1 |
21 |
+ |
ENSG00000235890.1 |
Intronic |
0 h |
p28071 |
11.64 |
down |
nc-HOXD10-12 |
2 |
+ |
nc-HOXD10-12 |
Intronic |
0 h |
p6908 |
10.93 |
down |
ENST00000433510.1 |
17 |
− |
ENSG00000233283.2 |
Intergenic |
0 h |
p8814 |
9.47 |
down |
ENST00000601506.1 |
19 |
+ |
ENSG00000269495.1 |
Antisense |
0 h |
p33495 |
8.82 |
down |
ENST00000589927.1 |
19 |
+ |
ENSG00000186526.7 |
Antisense |
0 h |
p29588 |
13.61 |
up |
TCONS_00018436 |
10 |
− |
XLOC_008730 |
Intergenic |
2 h |
p29587 |
12.47 |
up |
TCONS_00017927 |
10 |
− |
XLOC_008730 |
Intergenic |
2 h |
p22664 |
7.26 |
up |
TCONS_00010875 |
5 |
− |
XLOC_004700 |
Intergenic |
2 h |
p5789 |
6.87 |
up |
ENST00000567091.1 |
16 |
− |
ENSG00000260394.2 |
Divergent |
2 h |
p3381 |
6.81 |
up |
ENST00000547963.1 |
12 |
− |
ENSG00000249550.2 |
Intergenic |
2 h |
p3379 |
5.93 |
up |
ENST00000550905.1 |
12 |
− |
ENSG00000249550.2 |
Intergenic |
2 h |
p5993 |
5.64 |
up |
ENST00000567668.1 |
16 |
− |
ENSG00000260609.1 |
Intergenic |
2 h |
p19771 |
5.11 |
up |
TCONS_00023442 |
15 |
+ |
XLOC_011287 |
Intergenic |
2 h |
p737 |
5.03 |
up |
ENST00000453572.1 |
1 |
− |
ENSG00000232184.1 |
Intronic |
2 h |
p22663 |
5.01 |
up |
TCONS_00010233 |
5 |
− |
XLOC_004700 |
Intergenic |
2 h |
p8814 |
23.31 |
down |
ENST00000601506.1 |
19 |
+ |
ENSG00000269495.1 |
Antisense |
2 h |
p8817 |
15.69 |
down |
ENST00000596286.1 |
19 |
+ |
ENSG00000268739.1 |
Antisense |
2 h |
p28076 |
12.71 |
down |
nc-HOXD10-8 |
2 |
+ |
nc-HOXD10-8 |
Antisense |
2 h |
p33919 |
12.04 |
down |
hox-HOXD10-36 |
2 |
+ |
hox-HOXD10-36 |
Intronic |
2 h |
p33918 |
11.42 |
down |
hox-HOXD10-35 |
2 |
+ |
hox-HOXD10-35 |
Intronic |
2 h |
p28072 |
10.30 |
down |
nc-HOXD10-13 |
2 |
+ |
nc-HOXD10-13 |
Intronic |
2 h |
p33495 |
10.15 |
down |
ENST00000589927.1 |
19 |
+ |
ENSG00000186526.7 |
Antisense |
2 h |
p28071 |
10.01 |
down |
nc-HOXD10-12 |
2 |
+ |
nc-HOXD10-12 |
Intronic |
2 h |
p8609 |
8.80 |
down |
ENST00000595892.1 |
19 |
+ |
ENSG00000269640.1 |
Divergent |
2 h |
p28077 |
8.48 |
down |
nc-HOXD10-9 |
2 |
+ |
nc-HOXD10-9 |
Intronic |
2 h |
p40301_v4 |
21.79 |
up |
XR_427456.1 |
3 |
+ |
48 h |
||
p3438 |
14.16 |
up |
ENST00000545853.1 |
12 |
− |
ENSG00000256732.1 |
Intergenic |
48 h |
p18725 |
13.84 |
up |
TCONS_00020973 |
12 |
− |
XLOC_010243 |
Intergenic |
48 h |
p33351 |
12.63 |
up |
ENST00000420462.1 |
1 |
− |
ENSG00000242663.1 |
Antisense |
48 h |
p11893 |
12.18 |
up |
ENST00000462011.1 |
3 |
+ |
ENSG00000244464.1 |
Intergenic |
48 h |
p37817_v4 |
11.39 |
up |
ENST00000607175.1 |
6 |
− |
ENSG00000272468.1 |
48 h |
|
p26490 |
11.25 |
up |
uc004aej.3 |
9 |
− |
BC065763 |
Intergenic |
48 h |
p26072 |
10.39 |
up |
uc002oet.3 |
19 |
+ |
BC024306 |
Intergenic |
48 h |
p29587 |
10.28 |
up |
TCONS_00017927 |
10 |
− |
XLOC_008730 |
Intergenic |
48 h |
p14418 |
10.03 |
up |
ENST00000584911.1 |
6 |
− |
ENSG00000223414.2 |
Intergenic |
48 h |
p28077 |
88.86 |
down |
nc-HOXD10-9 |
2 |
+ |
nc-HOXD10-9 |
Intronic |
48 h |
p33919 |
69.03 |
down |
hox-HOXD10-36 |
2 |
+ |
hox-HOXD10-36 |
Intronic |
48 h |
p8814 |
52.88 |
down |
ENST00000601506.1 |
19 |
+ |
ENSG00000269495.1 |
Antisense |
48 h |
p28072 |
49.57 |
down |
nc-HOXD10-13 |
2 |
+ |
nc-HOXD10-13 |
Intronic |
48 h |
p28076 |
45.45 |
down |
nc-HOXD10-8 |
2 |
+ |
nc-HOXD10-8 |
Antisense |
48 h |
p28071 |
41.28 |
down |
nc-HOXD10-12 |
2 |
+ |
nc-HOXD10-12 |
Intronic |
48 h |
p33495 |
38.99 |
down |
ENST00000589927.1 |
19 |
+ |
ENSG00000186526.7 |
Antisense |
48 h |
p33920 |
33.10 |
down |
hox-HOXD11-34 |
2 |
+ |
hox-HOXD11-34 |
Intronic |
48 h |
p25262 |
26.48 |
down |
XR_108533.1 |
3 |
− |
LOC100505902 |
Intergenic |
48 h |
p33918 |
23.62 |
down |
hox-HOXD10-35 |
2 |
+ |
hox-HOXD10-35 |
Intronic |
48 h |
Table 2: Ten most upregulated and downregulated mRNAs in RS-FaDu cells at 0, 2 and 48 h after 4 Gy radiation
Probe name |
FC (abs) |
Regulation |
Genbank accession |
Gene symbol |
Time |
|---|---|---|---|---|---|
A_21_P0005630 |
23.64873 |
up |
NR_121672 |
LINC00824 |
0 h |
A_33_P3258346 |
9.20869 |
up |
NM_017523 |
XAF1 |
0 h |
A_33_P3384287 |
9.20060 |
up |
NM_002579 |
PALM |
0 h |
A_33_P3238533 |
8.80111 |
up |
NM_001105528 |
CCDC178 |
0 h |
A_23_P87013 |
7.73073 |
up |
NM_001001522 |
TAGLN |
0 h |
A_33_P3381948 |
7.55051 |
up |
NM_001080436 |
WTIP |
0 h |
A_23_P1029 |
7.11102 |
up |
NM_017459 |
MFAP2 |
0 h |
A_33_P3640690 |
6.67747 |
up |
NM_001128128 |
ZEB1 |
0 h |
A_24_P557479 |
6.51224 |
up |
NM_017523 |
XAF1 |
0 h |
A_33_P3237552 |
6.43079 |
up |
NM_032843 |
FIBCD1 |
0 h |
A_33_P3290780 |
52.36956 |
down |
NM_001185156 |
IL24 |
0 h |
A_33_P3260654 |
26.23980 |
down |
EU030678 |
0 h |
|
A_24_P684183 |
18.09698 |
down |
NM_025257 |
SLC44A4 |
0 h |
A_23_P304897 |
15.30950 |
down |
NM_000623 |
BDKRB2 |
0 h |
A_23_P128744 |
13.02192 |
down |
NM_000710 |
BDKRB1 |
0 h |
A_23_P122937 |
12.17637 |
down |
NM_014800 |
ELMO1 |
0 h |
A_21_P0009192 |
11.46747 |
down |
0 h |
||
A_23_P65189 |
11.36208 |
down |
NM_000209 |
PDX1 |
0 h |
A_23_P39315 |
10.78665 |
down |
NM_021187 |
CYP4F11 |
0 h |
A_23_P404494 |
10.34955 |
down |
NM_002185 |
IL7R |
0 h |
A_21_P0005630 |
73.61931 |
up |
NR_121672 |
LINC00824 |
2 h |
A_33_P3238533 |
61.95869 |
up |
NM_001105528 |
CCDC178 |
2 h |
A_23_P69030 |
11.65424 |
up |
NM_001850 |
COL8A1 |
2 h |
A_33_P3245439 |
9.52713 |
up |
NM_001250 |
CD40 |
2 h |
A_23_P209055 |
8.46069 |
up |
NM_001771 |
CD22 |
2 h |
A_33_P3293675 |
7.34682 |
up |
NM_006598 |
SLC12A7 |
2 h |
A_24_P917886 |
7.22717 |
up |
XM_006709947 |
MUC5AC |
2 h |
A_33_P3382177 |
7.02720 |
up |
NM_003255 |
TIMP2 |
2 h |
A_32_P530933 |
6.34961 |
up |
NM_015617 |
PYGO1 |
2 h |
A_23_P159721 |
6.29696 |
up |
NM_004224 |
GPR50 |
2 h |
A_33_P3393971 |
27.56643 |
down |
NM_000299 |
PKP1 |
2 h |
A_23_P23296 |
24.91828 |
down |
NM_000299 |
PKP1 |
2 h |
A_23_P143029 |
21.06592 |
down |
NM_021192 |
HOXD11 |
2 h |
A_24_P245379 |
13.24701 |
down |
NM_002575 |
SERPINB2 |
2 h |
A_33_P3220911 |
12.74436 |
down |
NM_004335 |
BST2 |
2 h |
A_33_P3226810 |
12.12693 |
down |
NM_003810 |
TNFSF10 |
2 h |
A_23_P404494 |
10.63455 |
down |
NM_002185 |
IL7R |
2 h |
A_24_P236935 |
10.10874 |
down |
NM_001012964 |
KLK6 |
2 h |
A_21_P0011633 |
9.24221 |
down |
NM_000526 |
KRT14 |
2 h |
A_23_P39315 |
9.24213 |
down |
NM_021187 |
CYP4F11 |
2 h |
A_33_P3238533 |
132.03939 |
up |
NM_001105528 |
CCDC178 |
48 h |
A_21_P0005630 |
41.69042 |
up |
NR_121672 |
LINC00824 |
48 h |
A_23_P161190 |
30.52496 |
up |
NM_003380 |
VIM |
48 h |
A_23_P70468 |
29.94054 |
up |
NM_012367 |
OR2B6 |
48 h |
A_33_P3340014 |
18.30612 |
up |
NM_016157 |
TRO |
48 h |
A_33_P3514487 |
16.05847 |
up |
NM_198481 |
VSTM1 |
48 h |
A_24_P211849 |
13.71514 |
up |
NM_001166220 |
TBX20 |
48 h |
A_23_P421379 |
12.63051 |
up |
NM_000612 |
IGF2 |
48 h |
A_23_P69030 |
12.08606 |
up |
NM_001850 |
COL8A1 |
48 h |
A_23_P41804 |
11.93085 |
up |
NM_033120 |
NKD2 |
48 h |
A_23_P39315 |
39.50620 |
down |
NM_021187 |
CYP4F11 |
48 h |
A_23_P143029 |
38.05859 |
down |
NM_021192 |
HOXD11 |
48 h |
A_23_P50710 |
31.23669 |
down |
NM_001082 |
CYP4F2 |
48 h |
A_33_P3393971 |
26.30644 |
down |
NM_000299 |
PKP1 |
48 h |
A_23_P23296 |
24.31587 |
down |
NM_000299 |
PKP1 |
48 h |
A_24_P42693 |
23.02732 |
down |
NM_021187 |
CYP4F11 |
48 h |
A_23_P108280 |
20.67472 |
down |
NM_023944 |
CYP4F12 |
48 h |
A_24_P684183 |
19.34901 |
down |
NM_025257 |
SLC44A4 |
48 h |
A_23_P138541 |
14.88679 |
down |
NM_003739 |
AKR1C3 |
48 h |
A_23_P300781 |
13.48931 |
down |
NM_013316 |
CNOT4 |
48 h |
Venn diagrams of the numbers and percentages of differentially expressed genes are shown in Figure 4. The results showed that there were 20 (2.0%) common differentially upregulated lncRNAs (Figure 4A) and 65 (5.4%) common differentially downregulated lncRNAs (Figure 4B) for the three groups (Supplementary Table 1). In addition, the numbers of common upregulated (Figure 4C) and downregulated (Figure 4D) differentially expressed mRNAs were 59 (4.3%) and 153 (7.0%), respectively (Supplementary Table 2).
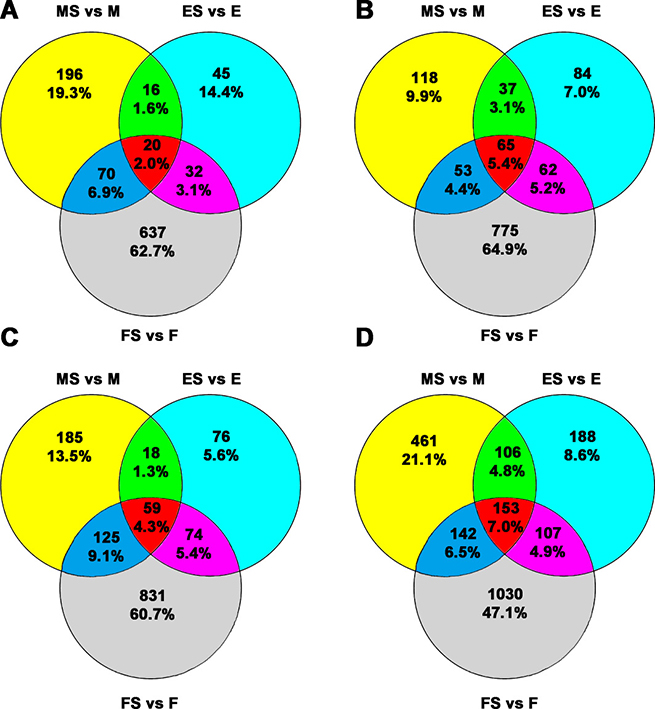
Figure 4: Venn diagram for the common and exclusively expressed lncRNAs and mRNAs from each group. FaDu and RS-FaDu cells at 0, 2, and 48 h after irradiation with 4 Gy. Different lncRNAs and mRNAs between FaDu and RS-FaDu as determined by microarray analysis for overlapping signature. (A) The overlapping results of upregulated differentially expressed lncRNAs. (B) The overlapping results of downregulated differentially expressed lncRNAs. (C) The overlapping results of upregulated differentially expressed mRNAs. (D) The overlapping results of downregulated differentially expressed mRNAs. MS vs. M, 0 h; ES vs. E, 2 h; FS vs. F, 48 h.
Validation of differential lncRNA expression by qRT-PCR
The qRT-PCR was used to confirm the reliability and validity of microarray data. We selected four lncRNAs (ENST00000470135, TCONS_00010875, TCONS_00018436, and hox-HOXD10-35) for validation since these lncRNAs had consistent up- or downregulations at the three time points and their FC values were prominent at some time points. Additionally, four mRNAs (CKMT1A, GPNMB, FBLN5, and GDA) were validated as well due likely to their potential roles in irradiation response or radioresistance. The relative expression levels of the target RNAs were given as ratios of β-actin transcript levels in the same RNA samples. As shown in Figure 5, the expression levels of these eight genes were consistent with the microarray results, indicating the reliability of the microarray data and correlation of these genes with radioresistance.
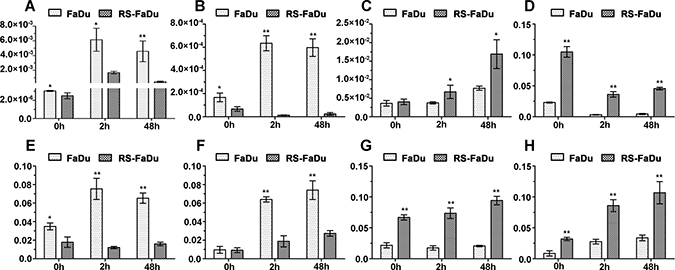
Figure 5: Validation of differential lncRNA expressions by qRT-PCR. (A) ENST00000470135; (B) hox-HOXD10-35; (C) TCONS_00010875; (D) TCONS_00018436; (E) CKMT1A; (F) GPNMB; (G) FBLN5; (H) GDA. After normalization to ACTB, data were presented as mean ± SD. n = 3, *P < 0.05, **P < 0.01.
Potential roles of TCONS_00018436 in regulation of radioresistance of HSCC
We then assessed the expression of the four validated lncRNAs in primary tumor tissues of HSCC patients versus their recurrent ones after postoperative radiotherapy, using qRT-PCR. The expression of the three lncRNAs showed no remarkable difference between two groups of samples (Figure 6A–6C), while the significant upregulation of TCONS_00018436 in relapsed tumor samples was found (Figure 6D, *P < 0.05). Further, after we stably knocked down TCONS_00018436 in FaDu-RS cells using lentiviral transfection, both transfected FaDu-RS cells (FaDu-RS-sh) and FaDu-RS cells were treated with 4 Gy, 6 Gy and 8 Gy irradiation, respectively. The apoptotic cells at 48 h after irradiation were determined by Annexin V-FITC/PI and flow cytometry. As shown in Figure 6E, depletion of TCONS_00018436 significantly sensitized RS-FaDu cells to the indicated doses of radiation (*P < 0.05), indicating that upregulated TCONS_00018436 might control radioresistance of HSCC cells during exposure to radiation. However, the underlying mechanism remains to be further investigated.
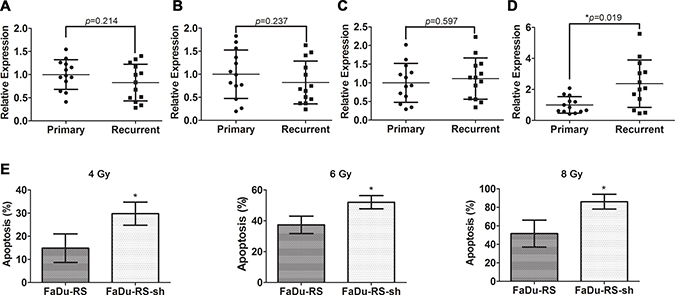
Figure 6: Potential roles of TCONS_00018436 in radioresistance of HSCC cells. The relative expression of ENST00000470135 (A), hox-HOXD10-35 (B), TCONS_00010875 (C) and TCONS_00018436 (D) in primary vs. recurrent HSCC tissue samples were measured by qRT-PCR. Their expression in each sample was normalized to the mean expression of their respective primary samples. Data were presented as mean ± SD. n = 13, *P < 0.05. (E) FaDu-RS cells and those stably transfected with shRNA of TCONS_00018436 were both treated with 4 Gy, 6 Gy, and 8 Gy irradiation, respectively. The fractions of apoptotic cells were determined by using Annexin V/PI dual staining after 48 h. Data were presented as mean ± SD. n = 3, *P < 0.05.
Bioinformatics analyses
In order to identify potential protein regulators involved in radioresistance of HSCC, we performed pathway enrichment analysis by functionally annotating and differentially expressed mRNAs in FaDu vs. FaDu-RS cells at 0, 2, and 48 h after irradiation. The detailed information on significantly enriched pathway terms and dysregulated mRNAs at the three time points involved in them was presented in Supplementary Tables 3–5, respectively. The most significant 30 terms sorted by corrected P-value were separately listed in three histograms, according to the time points after irradiation shown in Supplementary Figure 1. This analysis approach may help identify altered expression of mRNAs involved in pathways associated with radioresistance, whose dysregulation might have an impact on sensitivity of HSCC to radiation.
An increasing number of lncRNAs have been shown to regulate expression of target genes in cis or in trans. Thus, we found significant correlations between dysregulated lncRNAs and mRNAs at 0, 2, and 48 h after irradiation, respectively. After lncRNA and mRNA correlation, cis-prediction and trans-prediction were both applied to the data. The final lncRNA prediction results are the combination of results from these two prediction parts at 0, 2, and 48 h as shown in Tables 3–5, respectively. These pathway enrichment analysis may provide some mRNA candidates that are potentially associated with radioresistance. Furthermore, we might further identify the lncRNAs in regulating the expressions of nearby or distant genes which encode these mRNAs based on the prediction results.
Table 3: lncRNA target prediction of RS-FaDu vs. FaDu at 0 h
lncRNA |
mRNA |
Correlation |
P-value |
Direction (lncRNA-mRNA) |
cisregulation |
transregulation |
|---|---|---|---|---|---|---|
p3758 |
A_33_P3421178 |
0.999026552 |
0.000001421 |
down-down |
Sense |
|
p13056 |
A_21_P0012973 |
0.993822774 |
0.000057119 |
up-up |
Sense |
|
p25219 |
A_33_P3368495 |
0.998540055 |
0.000003196 |
down-down |
miRNA sequestration |
|
p7538 |
A_33_P3382177 |
0.999529708 |
0.000000332 |
up-up |
Antisense |
|
p35072_v4 |
A_19_P00315941 |
0.997663892 |
0.000008180 |
up-up |
Sense |
|
p12195 |
A_19_P00316857 |
0.994153893 |
0.000051166 |
up-up |
Sense |
|
p26166 |
A_24_P557479 |
−0.997108515 |
0.000012529 |
down-up |
miRNA sequestration |
|
p29619 |
A_21_P0007233 |
0.992506995 |
0.000084007 |
down-down |
Sense |
|
p38695_v4 |
A_23_P148919 |
−0.99696864 |
0.000013770 |
up-down |
miRNA sequestration |
|
p192 |
A_23_P148919 |
0.994529457 |
0.000044808 |
down-down |
Antisense |
|
p1665 |
A_33_P3278211 |
0.994573678 |
0.000044088 |
down-down |
Sense |
|
p30074 |
A_33_P3289416 |
0.990995817 |
0.000121248 |
down-down |
miRNA sequestration |
|
p10587 |
A_24_P115199 |
−0.99188824 |
0.000098434 |
up-down |
miRNA sequestration |
|
p8323 |
A_24_P115199 |
−0.997557313 |
0.000008943 |
up-down |
miRNA sequestration |
|
p687 |
A_21_P0001239 |
0.991689858 |
0.000103301 |
down-down |
Sense |
|
p686 |
A_21_P0001239 |
0.999058836 |
0.000001328 |
down-down |
Sense |
|
p34021_v4 |
A_21_P0001239 |
0.998331716 |
0.000004172 |
down-down |
Sense |
|
p7388 |
A_33_P3341836 |
0.997644418 |
0.000008317 |
up-up |
miRNA sequestration |
|
p687 |
A_32_P212373 |
0.991025177 |
0.000120460 |
down-down |
Sense |
|
p686 |
A_32_P212373 |
0.998954092 |
0.000001640 |
down-down |
Sense |
|
p34021_v4 |
A_32_P212373 |
0.998577934 |
0.000003032 |
down-down |
Sense |
|
p686 |
A_21_P0001238 |
0.994752897 |
0.000041226 |
down-down |
Sense |
|
p34021_v4 |
A_21_P0001238 |
0.992305807 |
0.000088573 |
down-down |
Sense |
|
p38695_v4 |
A_33_P3414487 |
−0.99790579 |
0.000006574 |
up-down |
miRNA sequestration |
|
p10433 |
A_23_P210425 |
0.993170163 |
0.000069811 |
up-up |
Antisense |
|
p4963 |
A_23_P304897 |
0.994892042 |
0.000039070 |
down-down |
Intronic |
|
p6222 |
A_24_P80135 |
0.997657113 |
0.000008227 |
down-down |
miRNA sequestration |
|
p15211 |
A_23_P320878 |
0.993544033 |
0.000062385 |
down-down |
miRNA sequestration |
Table 4: LncRNA target prediction of RS-FaDu vs. FaDu at 2 h
lncRNA |
mRNA |
Correlation |
P-value |
Direction (lncRNA-mRNA) |
cisregulation |
transregulation |
|---|---|---|---|---|---|---|
p20305 |
A_33_P3266898 |
−0.996352571 |
0.000019931 |
up-down |
miRNA sequestration |
|
p30194 |
A_33_P3266898 |
−0.996726605 |
0.000016055 |
up-down |
miRNA sequestration |
|
p33576 |
A_32_P131031 |
0.992702048 |
0.000079696 |
down-down |
Intergenic (10 k) |
|
p36121_v4 |
A_21_P0004245 |
0.990861638 |
0.000124883 |
down-down |
Sense |
|
p8814 |
A_24_P236935 |
0.995770285 |
0.000026798 |
down-down |
Antisense |
|
p687 |
A_24_P915692 |
0.990515655 |
0.000134503 |
down-down |
miRNA sequestration |
|
p24838 |
A_33_P3278211 |
0.998051663 |
0.000005690 |
down-down |
Sense |
|
p1665 |
A_33_P3278211 |
0.998814061 |
0.000002109 |
down-down |
Sense |
|
p37870_v4 |
A_33_P3289416 |
−0.990915820 |
0.000123409 |
up-down |
miRNA sequestration |
|
p25347 |
A_24_P940149 |
−0.996508538 |
0.000018264 |
up-down |
miRNA sequestration |
|
p25347 |
A_32_P152437 |
0.996042331 |
0.000023464 |
up-up |
miRNA sequestration |
|
p30340 |
A_24_P602871 |
0.995141025 |
0.000035357 |
down-down |
miRNA sequestration |
|
p25605 |
A_23_P329112 |
0.996929698 |
0.000014126 |
up-down |
miRNA sequestration |
|
p25347 |
A_23_P329112 |
0.994658656 |
0.000042719 |
up-down |
miRNA sequestration |
|
p11034 |
A_24_P66027 |
0.991916997 |
0.000097738 |
down-down |
Antisense |
|
p28133 |
A_24_P115199 |
0.997640377 |
0.000008345 |
down-down |
miRNA sequestration |
|
p30155 |
A_24_P115199 |
0.990576762 |
0.000132778 |
down-down |
miRNA sequestration |
|
p33798 |
A_23_P60339 |
−0.994723656 |
0.000041686 |
up-down |
miRNA sequestration |
|
p687 |
A_32_P212373 |
0.992913328 |
0.000075153 |
down-down |
Sense |
|
p686 |
A_32_P212373 |
0.994692846 |
0.000042174 |
down-down |
Sense |
|
p34021_v4 |
A_32_P212373 |
0.991057378 |
0.000119598 |
down-down |
Sense |
|
p20305 |
A_23_P208389 |
0.996581866 |
0.000017505 |
up-up |
miRNA sequestration |
|
p34907_v4 |
A_33_P3333554 |
0.990605549 |
0.000131969 |
down-down |
miRNA sequestration |
|
p10433 |
A_23_P210425 |
0.998311004 |
0.000004277 |
up-up |
Antisense |
|
p30335 |
A_23_P157022 |
0.991277419 |
0.000113793 |
down-down |
miRNA sequestration |
|
p15938 |
A_21_P0005906 |
0.995291866 |
0.000033198 |
down-down |
Intergenic (10 k) |
|
p34907_v4 |
A_33_P3378430 |
0.991616881 |
0.000105120 |
down-down |
miRNA sequestration |
|
p20305 |
A_32_P31618 |
−0.992612720 |
0.000081656 |
up-down |
miRNA sequestration |
|
p15519 |
A_33_P3233273 |
0.990760089 |
0.000127670 |
down-down |
Intergenic (10 k) |
Table 5: LncRNA target prediction of RS-FaDu vs. FaDu at 48 h
lncRNA |
mRNA |
Correlation |
P-value |
Direction (lncRNA-mRNA) |
cisregulation |
transregulation |
|---|---|---|---|---|---|---|
p24892 |
A_33_P3250133 |
0.993774158 |
0.000058021 |
up-up |
miRNA sequestration |
|
p36462_v4 |
A_24_P111242 |
−0.997243502 |
0.000011387 |
down-up |
miRNA sequestration |
|
p2627 |
A_21_P0014268 |
0.996216336 |
0.000021447 |
up-up |
Sense |
|
p25293 |
A_23_P38813 |
−0.997569809 |
0.000008852 |
up-down |
miRNA sequestration |
|
p24618 |
A_23_P38813 |
0.996136217 |
0.000022364 |
down-down |
miRNA sequestration |
|
p37916_v4 |
A_23_P38813 |
−0.991608950 |
0.000105319 |
up-down |
miRNA sequestration |
|
p44617_v4 |
A_23_P38813 |
−0.993806999 |
0.000057411 |
up-down |
miRNA sequestration |
|
p25051 |
A_23_P38813 |
−0.995045168 |
0.000036765 |
up-down |
miRNA sequestration |
|
p28498 |
A_23_P38813 |
−0.994453852 |
0.000046054 |
up-down |
miRNA sequestration |
|
p122 |
A_23_P38813 |
−0.994491445 |
0.000045433 |
up-down |
miRNA sequestration |
|
p3143 |
A_23_P38813 |
0.997519222 |
0.000009224 |
down-down |
miRNA sequestration |
|
p11437 |
A_23_P38813 |
−0.995453161 |
0.000030964 |
up-down |
miRNA sequestration |
|
p37026_v4 |
A_23_P38813 |
−0.994529667 |
0.000044805 |
up-down |
miRNA sequestration |
|
p23798 |
A_23_P38813 |
0.992085159 |
0.000093719 |
down-down |
miRNA sequestration |
|
p29606 |
A_23_P38813 |
−0.998223527 |
0.000004731 |
up-down |
miRNA sequestration |
|
p28658 |
A_23_P38813 |
−0.993772836 |
0.000058046 |
up-down |
miRNA sequestration |
|
p24771 |
A_21_P0014060 |
0.995431495 |
0.000031259 |
up-up |
Sense |
|
p34907_v4 |
A_24_P319364 |
−0.996770625 |
0.000015626 |
down-up |
miRNA sequestration |
|
p29827 |
A_33_P3336622 |
0.994560238 |
0.000044306 |
up-up |
miRNA sequestration |
|
p29606 |
A_33_P3336622 |
0.993785701 |
0.000057806 |
up-up |
miRNA sequestration |
|
p26063 |
A_33_P3390723 |
0.990423713 |
0.000137119 |
up-up |
miRNA sequestration |
|
p24892 |
A_23_P45799 |
−0.997314248 |
0.000010810 |
up-down |
miRNA sequestration |
|
p34907_v4 |
A_24_P129232 |
−0.992791851 |
0.000077749 |
down-up |
miRNA sequestration |
|
p18271 |
A_24_P684183 |
−0.990582868 |
0.000132606 |
up-down |
miRNA sequestration |
|
p44617_v4 |
A_24_P684183 |
−0.990879668 |
0.000124391 |
up-down |
miRNA sequestration |
|
p18272 |
A_24_P684183 |
−0.993001983 |
0.000073287 |
up-down |
miRNA sequestration |
|
p8313 |
A_23_P165186 |
0.990188970 |
0.000143912 |
up-up |
Bidirectional |
|
p7538 |
A_33_P3382177 |
0.990676885 |
0.000129976 |
up-up |
Antisense |
|
p41822_v4 |
A_32_P126698 |
0.993882119 |
0.000056028 |
up-up |
miRNA sequestration |
|
p25293 |
A_23_P149099 |
−0.991073247 |
0.000119175 |
up-down |
miRNA sequestration |
|
p18271 |
A_23_P149099 |
−0.991096396 |
0.000118558 |
up-down |
miRNA sequestration |
|
p823 |
A_23_P149099 |
−0.992591892 |
0.000082117 |
up-down |
miRNA sequestration |
|
p23798 |
A_23_P149099 |
0.993960353 |
0.000054606 |
down-down |
miRNA sequestration |
|
p25999 |
A_23_P149099 |
−0.991209023 |
0.000115582 |
up-down |
miRNA sequestration |
|
p25051 |
A_24_P382630 |
−0.998198512 |
0.000004865 |
up-down |
miRNA sequestration |
|
p28498 |
A_24_P382630 |
−0.991372680 |
0.000111325 |
up-down |
miRNA sequestration |
|
p16320 |
A_23_P62679 |
−0.995317469 |
0.000032838 |
up-down |
miRNA sequestration |
|
p13683 |
A_33_P3233841 |
0.993630385 |
0.000060729 |
up-up |
Antisense |
|
p21313 |
A_19_P00317856 |
0.993327189 |
0.000066641 |
up-up |
Sense |
miRNA sequestration |
p36492_v4 |
A_33_P3221748 |
0.995546108 |
0.000029712 |
up-up |
Sense |
|
p19344 |
A_24_P250535 |
0.991880869 |
0.000098613 |
up-up |
miRNA sequestration |
|
p8693 |
A_24_P250535 |
0.991653359 |
0.000104209 |
up-up |
miRNA sequestration |
|
p14566 |
A_19_P00319254 |
0.991633933 |
0.000104694 |
down-down |
Sense |
|
p22664 |
A_23_P41804 |
0.995620949 |
0.000028722 |
up-up |
Intergenic (10 k) |
|
p22663 |
A_23_P41804 |
0.997949994 |
0.000006299 |
up-up |
Intergenic (10 k) |
|
p37916_v4 |
A_33_P3215277 |
0.992325400 |
0.000088123 |
up-up |
miRNA sequestration |
|
p28498 |
A_33_P3215277 |
0.993349818 |
0.000066190 |
up-up |
miRNA sequestration |
|
p20125 |
A_33_P3256490 |
0.993114016 |
0.000070962 |
up-up |
miRNA sequestration |
|
p2107 |
A_33_P3256490 |
0.996526411 |
0.000018078 |
up-up |
miRNA sequestration |
|
p33596 |
A_23_P347468 |
0.990934613 |
0.000122899 |
down-down |
miRNA sequestration |
|
p4313 |
A_33_P3239084 |
0.991022154 |
0.000120541 |
down-down |
miRNA sequestration |
|
p26099 |
A_23_P381368 |
0.992698802 |
0.000079767 |
down-down |
Intergenic (10 k) |
|
p28109 |
A_23_P381368 |
0.998436798 |
0.000003663 |
down-down |
miRNA sequestration |
|
p5755 |
A_24_P56894 |
0.990801171 |
0.000126538 |
up-up |
miRNA sequestration |
|
p16320 |
A_24_P56894 |
0.991795931 |
0.000100684 |
up-up |
miRNA sequestration |
|
p2195 |
A_23_P134935 |
0.995584780 |
0.000029198 |
up-up |
miRNA sequestration |
|
p18273 |
A_23_P76749 |
0.991517681 |
0.000107619 |
up-up |
miRNA sequestration |
|
p18273 |
A_23_P336929 |
0.990945545 |
0.000122604 |
up-up |
miRNA sequestration |
|
p3234 |
A_24_P380022 |
−0.990116941 |
0.000146030 |
up-down |
miRNA sequestration |
|
p16320 |
A_33_P3319593 |
−0.991594493 |
0.000105682 |
up-down |
miRNA sequestration |
|
p37870_v4 |
A_33_P3319593 |
−0.993768247 |
0.000058131 |
up-down |
miRNA sequestration |
|
p36411_v4 |
A_24_P941217 |
−0.992930705 |
0.000074786 |
down-up |
miRNA sequestration |
|
p25274 |
A_24_P941217 |
0.993605918 |
0.000061196 |
up-up |
miRNA sequestration |
|
p30340 |
A_23_P209320 |
−0.991624411 |
0.000104932 |
down-up |
miRNA sequestration |
|
p34907_v4 |
A_33_P3424297 |
0.991763098 |
0.000101490 |
down-down |
miRNA sequestration |
|
p30340 |
A_33_P3424297 |
0.990792516 |
0.000126776 |
down-down |
miRNA sequestration |
|
p8323 |
A_33_P3418394 |
0.996071022 |
0.000023125 |
up-up |
miRNA sequestration |
|
p11437 |
A_33_P3418394 |
0.992377207 |
0.000086939 |
up-up |
miRNA sequestration |
|
p1517 |
A_21_P0014248 |
0.993602194 |
0.000061267 |
up-up |
Sense |
|
p14566 |
A_19_P00322225 |
0.991838124 |
0.000099652 |
down-down |
Sense |
|
p26790 |
A_24_P940149 |
0.993717158 |
0.000059087 |
down-down |
Antisense |
|
p17915 |
A_23_P416305 |
−0.993783331 |
0.000057850 |
down-up |
miRNA sequestration |
|
p750 |
A_21_P0010797 |
0.996064600 |
0.000023201 |
up-up |
Sense |
|
p29253 |
A_32_P173058 |
0.992308714 |
0.000088506 |
up-up |
miRNA sequestration |
|
p36497_v4 |
A_19_P00319372 |
0.993618413 |
0.000060957 |
up-up |
Intronic |
|
p36069_v4 |
A_19_P00319372 |
0.994980191 |
0.000037734 |
up-up |
Sense |
|
p3143 |
A_23_P383031 |
0.994487956 |
0.000045490 |
down-down |
miRNA sequestration |
|
p18271 |
A_24_P409042 |
−0.993703568 |
0.000059343 |
up-down |
miRNA sequestration |
|
p24618 |
A_24_P409042 |
0.997488035 |
0.000009457 |
down-down |
miRNA sequestration |
|
p18273 |
A_24_P409042 |
−0.991108770 |
0.000118230 |
up-down |
miRNA sequestration |
|
p25051 |
A_24_P409042 |
−0.994189287 |
0.000050548 |
up-down |
miRNA sequestration |
|
p18272 |
A_24_P409042 |
−0.994084150 |
0.000052392 |
up-down |
miRNA sequestration |
|
p7539 |
A_24_P409042 |
−0.991072129 |
0.000119205 |
up-down |
miRNA sequestration |
|
p18273 |
A_23_P397856 |
−0.993936073 |
0.000055045 |
up-down |
miRNA sequestration |
|
p6823 |
A_24_P254346 |
−0.995095345 |
0.000036024 |
up-down |
miRNA sequestration |
|
p41766_v4 |
A_23_P97021 |
−0.991498540 |
0.000108105 |
up-down |
miRNA sequestration |
|
p29786 |
A_23_P97021 |
−0.995760159 |
0.000026926 |
up-down |
miRNA sequestration |
|
p9299 |
A_23_P97021 |
−0.990583844 |
0.000132579 |
up-down |
miRNA sequestration |
|
p28283 |
A_23_P97021 |
−0.991229915 |
0.000115034 |
up-down |
miRNA sequestration |
|
p18271 |
A_24_P373286 |
0.992099626 |
0.000093377 |
up-up |
miRNA sequestration |
|
p24976 |
A_23_P86182 |
0.994761294 |
0.000041094 |
down-down |
miRNA sequestration |
|
p16298 |
A_32_P90080 |
0.997392142 |
0.000010193 |
down-down |
miRNA sequestration |
|
p7391 |
A_23_P371885 |
0.995164968 |
0.000035010 |
up-up |
miRNA sequestration |
|
p16320 |
A_21_P0013080 |
−0.991724549 |
0.000102441 |
up-down |
miRNA sequestration |
|
p37870_v4 |
A_21_P0013080 |
−0.990354772 |
0.000139097 |
up-down |
miRNA sequestration |
|
p4547 |
A_23_P329112 |
−0.990672972 |
0.000130084 |
down-up |
miRNA sequestration |
|
p11094 |
A_23_P26704 |
−0.990068457 |
0.000147464 |
up-down |
miRNA sequestration |
|
p8313 |
A_23_P26704 |
−0.992380572 |
0.000086862 |
up-down |
miRNA sequestration |
|
p29606 |
A_23_P26704 |
−0.996163250 |
0.000022053 |
up-down |
miRNA sequestration |
|
p15693 |
A_23_P304682 |
−0.990624661 |
0.000131433 |
up-down |
miRNA sequestration |
|
p12560 |
A_23_P304682 |
−0.990915532 |
0.000123416 |
up-down |
miRNA sequestration |
|
p40979_v4 |
A_33_P3391005 |
−0.996196971 |
0.000021667 |
down-up |
miRNA sequestration |
|
p38890_v4 |
A_32_P831181 |
−0.996877479 |
0.000014610 |
up-down |
miRNA sequestration |
|
p3356 |
A_21_P0014571 |
0.991097745 |
0.000118522 |
up-up |
Sense |
|
p12621 |
A_19_P00317034 |
0.993856369 |
0.000056500 |
down-down |
Sense |
|
p5975 |
A_23_P63660 |
−0.991237992 |
0.000114823 |
up-down |
miRNA sequestration |
|
p9442 |
A_23_P63660 |
−0.993997587 |
0.000053935 |
up-down |
miRNA sequestration |
|
p122 |
A_21_P0001724 |
0.990393941 |
0.000137971 |
up-up |
Sense |
|
p24892 |
A_23_P211748 |
0.992553680 |
0.000082965 |
up-up |
miRNA sequestration |
|
p1517 |
A_23_P161190 |
0.990268562 |
0.000141591 |
up-up |
Intergenic (10 k) |
|
p29965 |
A_23_P208389 |
−0.999649344 |
0.000000184 |
down-up |
miRNA sequestration |
|
p20045 |
A_23_P208389 |
−0.993224778 |
0.000068700 |
down-up |
miRNA sequestration |
|
p33596 |
A_23_P146209 |
0.994585549 |
0.000043895 |
down-down |
miRNA sequestration |
|
p34907_v4 |
A_33_P3333554 |
0.992145626 |
0.000092295 |
down-down |
miRNA sequestration |
|
p38352_v4 |
A_23_P155666 |
0.997567735 |
0.000008867 |
down-down |
miRNA sequestration |
|
p36486_v4 |
A_23_P64792 |
−0.992286627 |
0.000089015 |
down-up |
miRNA sequestration |
|
p23949 |
A_23_P64792 |
0.992666927 |
0.000080464 |
up-up |
miRNA sequestration |
|
p25165 |
A_23_P50897 |
0.990700732 |
0.000129312 |
down-down |
Antisense |
|
p10750 |
A_33_P3303305 |
0.991255110 |
0.000114375 |
down-down |
Intronic |
|
p33919 |
A_23_P337201 |
0.997063796 |
0.000012919 |
down-down |
miRNA sequestration |
|
p1358 |
A_21_P0010738 |
0.996673835 |
0.000016577 |
down-down |
Sense |
|
p6352 |
A_23_P163306 |
0.993659613 |
0.000060173 |
down-down |
miRNA sequestration |
|
p18271 |
A_24_P109652 |
0.992664902 |
0.000080508 |
up-up |
miRNA sequestration |
|
p2107 |
A_21_P0006705 |
0.998881367 |
0.000001876 |
up-up |
Sense |
|
p4653 |
A_23_P304897 |
0.995441532 |
0.000031122 |
down-down |
Intronic |
|
p4963 |
A_23_P304897 |
0.999067618 |
0.000001304 |
down-down |
Intronic |
|
p39057_v4 |
A_33_P3259542 |
0.993876252 |
0.000056136 |
up-up |
miRNA sequestration |
|
p26034 |
A_33_P3259542 |
0.990129120 |
0.000145671 |
up-up |
miRNA sequestration |
|
p6898 |
A_21_P0014351 |
0.993996895 |
0.000053948 |
down-down |
Sense |
|
p34009_v4 |
A_23_P104188 |
0.992257395 |
0.000089690 |
down-down |
Intergenic (10 k) |
|
p34993_v4 |
A_23_P117582 |
0.992864673 |
0.000076188 |
up-up |
miRNA sequestration |
|
p25051 |
A_23_P117582 |
0.990949567 |
0.000122495 |
up-up |
miRNA sequestration |
DISCUSSION
To investigate the role of lncRNAs in the radioresistance of HSCC, we first observed the expression profiles of lncRNA in our established radioresistant HSCC cell model, i.e. RS-FaDu. The expression levels of lncRNA in the RS-FaDu and the parental FaDu cells were determined by microarray analysis immediately, at 2 h or 48 h after exposure to 4 Gy irradiation. This approach enabled us to observe the time-course differential expression patterns of lncRNA and mRNA in RS-FaDu vs. parental FaDu cells at the early and late stages of their irradiation response. Extracellular stimulation can bring about a rapid change on transcription of related genes. However, it is hard to determine the exact time points of each stage. Borràs-Fresneda, et al. found that a greatly differential transcriptional response in the radioresistant cell line was induced at 4 h after irradiation compared with the radiosensitive one [27]. To make transcriptomic analyses of the radiation response in head and neck squamous cell carcinoma subclones with different radiosensitivity, Michna, et al. even detected gene expression at 0.25, 2, 7, 12, 24, 48, 72 and 96 h after irradiation by microarray [28]. According to their experience, we selected these time points to roughly observe the early and late transcriptional response of FaDu and FaDu-RS cells to irradiation in the current study. Additionally, Li et al also carried out research on the relationship between lncRNA and radioresistance in nasopharyngeal carcinoma through genome-wide analyses [29]. However, the authors did not look at response time, which might effectively narrow our search for target lncRNAs and mRNAs.
Furthermore, we identified lncRNAs and mRNAs that were up- or downregulated at above three time points, and they were considered more likely to be involved in HSCC radioresistance. Subsequent validation experiments not only confirmed the reliability of the microarray data but also provided four lncRNA or mRNA candidates for our future mechanism study. Among these, TCONS_00018436 was considered more promising, due to that its potential role was preliminarily verified by its upregulated expression in relapsed tumor samples posterior to radiotherapy and loss-of-function assays.
Considering that altered response processes might occur at different stages after irradiation, we functionally annotated dysregulated mRNAs and performed bioinformatics analyses according to the respective response times. Among the most significantly enriched pathway terms, several attracted our attention because of their close relationship with radioresistance, such as the p53 signaling pathway at 0 h and at 2 h [30, 31], and the Wnt signaling pathway at 48 h [32]. These results offer us preferential pathways in which to study the mechanisms underlying HSCC radioresistance. From these results, some candidate mRNAs could be identified based on their altered expression profiles of mRNAs as well.
LncRNAs are well known to affect the expression of target genes in cis or in trans through binding promoter regions of specific sequences, recruiting relevant transcription factors, and sequestering the interaction of miRNAs with target mRNAs, etc [33–36]. Thus, we identified dysregulated lncRNAs and their predicted mRNA targets on the basis of complementary base sequences and expression changes from our microarray data. According to dysregulation and association of mRNAs with radioresistance-related pathways in the pathway enrichment analysis, their matched lncRNAs could be found in our prediction results. We thought that it was likely a feasible way to search for lncRNA candidates for the further study.
Emerging evidence indicates that lncRNAs might function as competing endogenous RNAs by sponging miRNAs in a variety of cancers [37–40]. Notably, the lncRNAs NEAT1 [25] and MALAT1 [13, 24] have been shown to modulate radioresistance via sequestration of related miRNAs in nasopharyngeal carcinoma as well as high-risk human papillomavirus-positive cervical cancer. The regulatory roles of miRNAs are well established in the radioresistance of cancers [41–45], suggesting that we should explore the molecular mechanisms of lncRNAs in HSCC radioresistance from the perspective of lncRNA-miRNA-mRNA axes. Using sequence pairing, a number of dysregulated lncRNAs from our microarray data and matched potential miRNA targets were identified (data not shown) in preparation for verifying our hypothesis.
In addition to the exploration of mechanisms underlying HSCC radioresistance, the identification of biomarkers for predicting radioresistant HSCC is of great clinical significance. Recently, a growing number of circulating or tissue-derived lncRNAs have been shown to be correlated with clinicopathological characteristics in patients with cancer [46–48], making them promising candidate biomarkers of malignancy. Given the close relationship between lncRNAs and radioresistant HSCC cells discussed above, lncRNAs have the potential to become novel biomarkers for the evaluation of HSCC radioresistance. We further plan to measure the expression levels of candidate lncRNAs in tumor tissues as well as blood samples from HSCC patients and explore the correlation between expression levels and different responses of HSCC patients to routine radiation therapy.
In this study, we for the first time have comprehensively demonstrated the time-course expression profiles of human lncRNAs/mRNAs in radioresistant RS-FaDu cells derived from FaDu cells. Through validation experiments and subsequent preliminary investigation, TCONS_00018436 emerged as a promising candidate for studying the molecular mechanism underlying radioresistance of HSCC. Moreover, a large number of lncRNAs or mRNAs still awaits for being discovered through the bioinformatics analyses. In conclusion, our data laid the foundation for further investigating the roles of these lncRNAs and mRNAs in the occurrence and development of HSCC radioresistance. In addition, novel therapeutic targets and diagnostic biomarkers are likely to be identified in the future on the basis of our data.
MATERIALS AND METHODS
Establishment of a radioresistant cell line
The HSCC FaDu cell line was purchased from the Type Culture Collection of the Chinese Academy of Sciences (Beijing, China). The cells were cultured in MEM (Gibico, Grand Island, NY, USA) with 10% fetal bovine serum (FBS), 2 mM glutamine, 100 units/ml penicillin, and 100 μg/ml streptomycin and incubated at 37°C with humidified 5% CO2.
RS-FaDu cells were created by repeatedly exposing the parental FaDu cells to irradiation [15]. Briefly, FaDu cells were grown in 75-mm2 cell culture plates. After the cells reached 70–80% confluence, they were irradiated with X-rays at room temperature. The X-ray generator (MBR-1505R; Hitachi Medical Co., Tokyo, Japan) was operated at 210 kV and 10 mA, with 0.5 mm Al external filtration. The dose rate was 1.8 Gy/min. The cells were exposed to doses of 2, 4, 6, 8, and 10 Gy and were irradiated with each dose twice (total dose of 60 Gy). An interval of 2 to 4 weeks between each dose allowed the surviving cells to regenerate. The process of irradiation and culture lasted for about 10 months. The HSCC cell clones that recovered after exposure to ionizing radiation were collected for further experiments.
Patient specimens
Primary and recurrent tumor samples were obtained from 13 patients who received radiotherapy followed by surgery in Qilu hospital from March 2013 to October 2015, and then salvage surgery due to local recurrence. After surgery, samples were cleaned with phosphate-buffered saline (PBS) and immediately put into liquid nitrogen at once. At least 24 h later, samples were transferred to −80°C for long-term storage. Characteristics of patients were summarized in Table 6. Prior to this study, written informed contents were signed, and this study was conducted under the approval of the institutional review board of the Ethics Boards of Qilu Hospital.
Table 6: Clinical characteristics of patients
Characteristics |
No. Patients |
|---|---|
Sex |
|
Female |
0 |
Male |
13 |
Age (years old) |
(Median 57, Range 49–67) |
Drinking |
|
Regularly |
9 |
Occasionally |
4 |
Seldom |
0 |
Smoking |
|
Regularly |
10 |
Occasionally |
0 |
Seldom |
3 |
*Histological Differentiation |
|
Well-Moderate |
2 |
Poor |
11 |
*Clinical Stage |
|
I + II |
1 |
III + IV |
12 |
*Treatment |
|
S + X |
13 |
*at the first visit.
S: Surgery; X: radiation.
Clonogenic assay
Both parental FaDu and radioresistant RS-FaDu cells were plated in six-well culture plates and irradiated with a single dose of 0, 2, 4, or 6 Gy, respectively. Plated cell numbers were as follows: 300 cells for 0 Gy, 600 cells for 2 Gy, 900 cells for 4 Gy, and 1200 cells for 6 Gy. Following irradiation, the cells were cultured in a 5% CO2 atmosphere at 37°C, and the medium was changed every 3 days. After 12 days, colonies were fixed with ethanol for 15 min and stained with 0.1% crystal violet for 15 min. Colonies with > 50 cells were scored with a ColCount colony counter (Oxford Optronix, Oxford, United Kingdom). All experiments were performed in triplicate. The survival fraction (SF) was estimated by the following formula: SF = [number of colonies formed/number of cells seeded × plating efficiency of the control group], where plating efficiency was calculated as the ratio between colonies observed and number of cells plated. Dose-response clonogenic survival curves were plotted on a log-linear scale using Graphpad Prism 5 software.
Apoptosis assay
Apoptotic cells were identified by using the Annexin V-FITC and propidium iodide (PI) apoptosis detection kit (BestBio, Shanghai, China) according to the manufacturer’s instructions. Briefly, RS-FaDu and FaDu cells were seeded at a density of 4 × 10⁵ cells in six-well plates and were incubated for 12 h before being treated with 4 Gy of radiation. The cells were then harvested at four different time points after X-ray exposure (0, 24, 48, and 72 h, respectively). After being washed twice with PBS, the cells were resuspended in 400 μL 1 × binding buffer and stained with 5 μL Annexin V-FITC for 15 min and 10 μL PI for 5 min at 4°C in the dark. Apoptosis was analyzed by a Gallios flow cytometer (Beckman Coulter, Brea, CA, USA). The percentage of total apoptosis was calculated as the sum of the early apoptosis (Annexin V+/PI−) and the late apoptosis (Annexin V+/PI+). The experiments were repeated three times and data were analyzed by Kaluza software (version 1.2; Beckman Coulter).
RNA extraction and microarray analysis
RS-FaDu and FaDu cells were seeded at a density of 4 × 10⁵ cells in three six-well plates each. They were treated with 4 Gy of radiation and then cultured under the indicated experimental conditions. Cells were harvested at three different time points after X-ray exposure (0, 2, and 48 h, respectively). Total RNA from each sample was extracted using TRIzol reagent (Invitrogen, Carlsbad, CA, USA) following the manufacturer’s instructions. RNA concentration was quantified by the NanoDrop ND-1000 (NanoDrop Technologies/Thermo Scientific, Wilmington, DE, USA), and RNA integrity was assessed by standard denaturing agarose gel electrophoresis. The sample preparation and microarray hybridization were performed based on the manufacturer’s standard protocols with minor modifications. Briefly, total RNA was purified after removal of rRNA and tRNA (mRNA-ONLY™ Eukaryotic mRNA Isolation Kit, Epicentre, Madison, WI, USA). Then, each sample was amplified and transcribed into fluorescent cRNA, along the entire length of the transcript without 3’ bias, utilizing a random priming method. The labeled cRNAs were hybridized onto the Agilent Human LncRNA v4.0 (4 × 180 K, Arraystar; Agilent Technologies, Santa Clara, CA, USA). The slides were then washed, and the tiff-format original array images were acquired by the Agilent G2505C Scanner (Agilent Technologies).
Microarray data analysis
The tiff-format original array images were pre-processed via Agilent Feature Extraction software (version 11.0.1.1) and then quantile normalization and differential expression analysis were conducted using the GeneSpring GX software package (version 11.5.1; Agilent Technologies). Cluster analysis and graphical illustration were performed using Cluster 3.0 software. Time-course differentially expressed lncRNAs and mRNAs with statistical significance between the two groups were identified through scatter plot filtering and volcano plot filtering. To filter out outlier samples, we performed hierarchical clustering to show any differences in expression intensity between the clustering group and true group results. The differentially expressed mRNAs were submitted to six pathway databases (KEGG PATHWAY, PID Curated, PID BioCarta, PID Reactome, BioCyc, Reactome, and Panther) for pathway enrichment analysis. After lncRNA and mRNA correlation, lncRNA target prediction included cis-prediction and trans-prediction. To determine cis-prediction, we searched for mRNAs that were in the region of 10 kb around the lncRNA. Trans-prediction was based on sequence alignment, which aligns lncRNA to the 3′UTR of mRNA. Then lncRNA-mRNA pairs that share similar sequences were identified from the trans-prediction results. In the lncRNA target prediction analysis, mRNA targets were predicted from cis-prediction and trans-prediction.
Validation of lncRNA and mRNA expression by quantitative real-time polymerase chain reaction
Quantitative real-time polymerase chain reaction (qRT-PCR) was used to validate the microarray data. Briefly, total RNA was reverse-transcribed to cDNA using SuperScript™ III Reverse Transcriptase (Invitrogen) following the manufacturer’s protocol. qRT-PCR was performed using the SYBR Green chemistry in the GeneAmp PCR System 9700 (ABI Applied Biosystems, Foster City, CA, USA). The forward and reverse primers for validation are listed in Table 7. PCR was performed in a 10-μL reaction volume and consisted of an initial denaturation step at 95°C for 10 min followed by amplification with 40 cycles at 95°C for 10 sec and 60°C for 60 sec. The threshold cycle (CT) was defined as the cycle number at which the fluorescence passed a predetermined threshold. Both target and reference (β-actin) genes were amplified in separate wells in triplicate. Gene expression was calculated using the comparative threshold cycle (2−ΔCT) method.
Table 7: Primers used for qRT-PCR
mRNAs/lncRNAs |
Forward primers (5′–3′) |
Reverse primers (5′–3′) |
bp |
|---|---|---|---|
ENST00000470135 |
TTGCCAGCAATTCATCAGAG |
GGGATATGCCAACCTTGAGA |
151 |
TCONS_00010875 |
TCGTTCACACACCCACTCAT |
CGAGTGGGCAAGTTAGTGTG |
153 |
TCONS_00018436 |
CCACCTCAGGATGGAAATGT |
TCCCCAACCAAAGTCTTGTC |
160 |
hox-HOXD10-35 |
GCTCCTTCACCACCAACATT |
AAATATCCAGGGACGGGAAC |
154 |
CKMT1A |
ACCTGACCCCAGCAGTCTAT |
AACACGTTCCACCTCTCGTC |
374 |
GPNMB |
AAGATTGCCACTTGATGCCG |
TCCCTCATGTAAGCAGAAGGTC |
75 |
FBLN5 |
CTCACTGTTACCATTCTGGCTC |
GACTGGCGATCCAGGTCAAAG |
89 |
GDA |
GCTGGAAGTAGCATAGACCTGC |
TCTTCTGCAAAGTCGATGTTCTG |
95 |
ACTB |
GTGGCCGAGGACTTTGATTG |
CCTGTAACAACGCATCTCATATT |
73 |
Lentiviral transfection assay
Lentivirus containing short hairpin RNA (shRNA) of TCONS_00018436 or empty vectors used as control were purchased from GeneChem (Shanghai, China). And the lentiviral transfection assays were performed following manufacture’s instructions. Stably transfected cells were screened by Puromycin (3 mg/mL) purchased from Sigma.
Statistical analysis
Data were presented as mean ± standard deviation (SD) and statistical differences between two experimental groups were determined by using paired t-test or Student’s t-test on SPSS 17.0 software (SPSS Inc., Chicago, IL, USA). Statistical differences in the microarray results were analyzed by fold change (FC) and P-value, and the FC and P-value were calculated based on normalized data. FC was calculated by computing the ratio of mean intensity of the case group to that of the control group, while P-value was calculated using Student’s t-test. The thresholds for differentially expressed genes were set at FC ≥ 2.0 and P-value < 0.05. For the lncRNA and mRNA correlation analysis, the Pearson correlation coefficient was calculated to show the correlation between lncRNA and mRNA expression and P-value was calculated to show the significance of the Pearson correlation coefficient. Correlation > 0.99 or correlation < −0.99, and P-value < 0.05 were adopted to filter out random relationship. In all analyses, a two-sided P-value < 0.05 was considered statistically significant.
Abbreviations
HSCC, hypopharyngeal squamous cell carcinoma; CRT, concomitant chemoradiotherapy; IMRT, intensity-modulated radiotherapy; IGRT, image-guided radiotherapy; TOMO, helical tomotherapy; lncRNA, long noncoding RNA; qRT-PCR, quantitative real-time polymerase chain reaction; GO, gene ontology.
ACKNOWLEDGMENTS AND FUNDING
This work was supported by the Taishan Scholars Program (No. tshw20130950), Shandong Province, and the Department of Science & Technology of Shandong Province (No. ZR2013HM107, ZR2014HM005, 2015GSF118014 and 2015GSF118030), the Science Foundation of Qilu Hospital of Shandong University, the Fundamental Research Funds of Shandong University (No.2014QLKY05), and the Zhenjiang Social Development Science & Technology Funds (SH2014045).
CONFLICTS OF INTEREST
None.
REFERENCES
1. Zhou J, Li Y, Wei D, Qian Y, Li W, Liu D, Li G, Pan X, Lei D. Overall survival with and without laryngeal function preservation in 580 patients with hypopharyngeal squamous cell carcinoma. Oncol Rep. 2015; 34:3196–202.
2. Wiezorek T, Brachwitz T, Georg D, Blank E, Fotina I, Habl G, Kretschmer M, Lutters G, Salz H, Schubert K, Wagner D, Wendt TG. Rotational IMRT techniques compared to fixed gantry IMRT and tomotherapy: multi-institutional planning study for head-and-neck cases. Radiat Oncol. 2011; 6:20.
3. Wycliffe ND, Grover RS, Kim PD, Simental A Jr. Hypopharyngeal cancer. Top Magn Reson Imaging. 2007; 18:243–58.
4. Guo Y, Zhu XD, Qu S, Li L, Su F, Li Y, Huang ST, Li DR. Identification of genes involved in radioresistance of nasopharyngeal carcinoma by integrating gene ontology and protein-protein interaction networks. Int J Oncol. 2012; 40:85–92.
5. Perri F, Pacelli R, Della Vittoria Scarpati G, Cella L, Giuliano M, Caponigro F, Pepe S. Radioresistance in head and neck squamous cell carcinoma: biological bases and therapeutic implications. Head Neck. 2015; 37:763–70.
6. Kapranov P, Willingham AT, Gingeras TR. Genome-wide transcription and the implications for genomic organization. Nat Rev Genet. 2007; 8:413–23.
7. Ernst C, Morton CC. Identification and function of long non-coding RNA. Front Cell Neurosci. 2013; 7:168.
8. Bolton EM, Tuzova AV, Walsh AL, Lynch T, Perry AS. Noncoding RNAs in prostate cancer: the long and the short of it. Clin Cancer Res. 2014; 20:35–43.
9. Jia W, Chen W, Kang J. The functions of microRNAs and long non-coding RNAs in embryonic and induced pluripotent stem cells. Genomics Proteomics Bioinformatics. 2013; 11:275–83.
10. Gupta RA, Shah N, Wang KC, Kim J, Horlings HM, Wong DJ, Tsai MC, Hung T, Argani P, Rinn JL, Wang Y, Brzoska P, Kong B, et al. Long non-coding RNA HOTAIR reprograms chromatin state to promote cancer metastasis. Nature. 2010; 464:1071–76.
11. Cheetham SW, Gruhl F, Mattick JS, Dinger ME. Long noncoding RNAs and the genetics of cancer. Br J Cancer. 2013; 108:2419–25.
12. Wang Q, Fan H, Liu Y, Yin Z, Cai H, Liu J, Wang Z, Shao M, Sun X, Diao J, Liu Y, Tong L, Fan Q. Curcumin enhances the radiosensitivity in nasopharyngeal carcinoma cells involving the reversal of differentially expressed long non-coding RNAs. Int J Oncol. 2014; 44:858–64.
13. Lu H, He Y, Lin L, Qi Z, Ma L, Li L, Su Y. Long non-coding RNA MALAT1 modulates radiosensitivity of HR-HPV+ cervical cancer via sponging miR-145. Tumour Biol. 2016; 37:1683–91.
14. Tan J, Qiu K, Li M, Liang Y. Double-negative feedback loop between long non-coding RNA TUG1 and miR-145 promotes epithelial to mesenchymal transition and radioresistance in human bladder cancer cells. FEBS Lett. 2015; 589:3175–81.
15. Skvortsov S, Jimenez CR, Knol JC, Eichberger P, Schiestl B, Debbage P, Skvortsova I, Lukas P. Radioresistant head and neck squamous cell carcinoma cells: intracellular signaling, putative biomarkers for tumor recurrences and possible therapeutic targets. Radiother Oncol. 2011; 101:177–82.
16. Wang WJ, Wu SP, Liu JB, Shi YS, Huang X, Zhang QB, Yao KT. MYC regulation of CHK1 and CHK2 promotes radioresistance in a stem cell-like population of nasopharyngeal carcinoma cells. Cancer Res. 2013; 73:1219–31.
17. Huarte M, Guttman M, Feldser D, Garber M, Koziol MJ, Kenzelmann-Broz D, Khalil AM, Zuk O, Amit I, Rabani M, Attardi LD, Regev A, Lander ES, et al. A large intergenic noncoding RNA induced by p53 mediates global gene repression in the p53 response. Cell. 2010; 142:409–19.
18. Liu Y, Lu X. Non-coding RNAs in DNA damage response. Am J Cancer Res. 2012; 2:658–75.
19. Liu Y, Qian J, Li X, Chen W, Xu A, Zhao K, Hua Y, Huang Z, Zhang J, Liang C, Su S, Li P, Shao P, et al. Long noncoding RNA BX357664 regulates cell proliferation and epithelial-to-mesenchymal transition via inhibition of TGF-β1/p38/HSP27 signaling in renal cell carcinoma. Oncotarget. 2016; 7:81410–22. doi: 10.18632/oncotarget.12937.
20. Sun M, Nie F, Wang Y, Zhang Z, Hou J, He D, Xie M, Xu L, De W, Wang Z, Wang J. LncRNA HOXA11-AS Promotes Proliferation and Invasion of Gastric Cancer by Scaffolding the Chromatin Modification Factors PRC2, LSD1, and DNMT1. Cancer Res. 2016; 76:6299–310.
21. Li X, Wang H, Yao B, Xu W, Chen J, Zhou X. lncRNA H19/miR-675 axis regulates cardiomyocyte apoptosis by targeting VDAC1 in diabetic cardiomyopathy. Sci Rep. 2016; 6:36340.
22. Ren K, Li Y, Lu H, Li Z, Li Z, Wu K, Li Z, Han X. Long Noncoding RNA HOTAIR Controls Cell Cycle by Functioning as a Competing Endogenous RNA in Esophageal Squamous Cell Carcinoma. Transl Oncol. 2016; 9:489–97.
23. Chang L, Graham P, Hao J, Ni J, Deng J, Bucci J, Malouf D, Gillatt D, Li Y. Cancer stem cells and signaling pathways in radioresistance. Oncotarget. 2016; 7:11002–17. doi: 10.18632/oncotarget.6760.
24. Jin C, Yan B, Lu Q, Lin Y, Ma L. The role of MALAT1/miR-1/slug axis on radioresistance in nasopharyngeal carcinoma. Tumour Biol. 2016; 37:4025–33.
25. Lu Y, Li T, Wei G, Liu L, Chen Q, Xu L, Zhang K, Zeng D, Liao R. The long non-coding RNA NEAT1 regulates epithelial to mesenchymal transition and radioresistance in through miR-204/ZEB1 axis in nasopharyngeal carcinoma. Tumour Biol. 2016; 37:11733–41.
26. Zhang H, Luo H, Hu Z, Peng J, Jiang Z, Song T, Wu B, Yue J, Zhou R, Xie R, Chen T, Wu S. Targeting WISP1 to sensitize esophageal squamous cell carcinoma to irradiation. Oncotarget. 2015; 6:6218–34. doi: 10.18632/oncotarget.3358.
27. Borràs-Fresneda M, Barquinero JF, Gomolka M, Hornhardt S, Rössler U, Armengol G, Barrios L. Differences in DNA Repair Capacity, Cell Death and Transcriptional Response after Irradiation between a Radiosensitive and a Radioresistant Cell Line. Sci Rep. 2016; 6:27043.
28. Michna A, Schötz U, Selmansberger M, Zitzelsberger H, Lauber K, Unger K, Hess J. Transcriptomic analyses of the radiation response in head and neck squamous cell carcinoma subclones with different radiation sensitivity: time-course gene expression profiles and gene association networks. Radiat Oncol. 2016; 11:94.
29. Li G, Liu Y, Liu C, Su Z, Ren S, Wang Y, Deng T, Huang D, Tian Y, Qiu Y. Genome-wide analyses of long noncoding RNA expression profiles correlated with radioresistance in nasopharyngeal carcinoma via next-generation deep sequencing. BMC Cancer. 2016; 16:719.
30. Yogev O, Barker K, Sikka A, Almeida GS, Hallsworth A, Smith LM, Jamin Y, Ruddle R, Koers A, Webber HT, Raynaud FI, Popov S, Jones C, et al. p53 Loss in MYC-Driven Neuroblastoma Leads to Metabolic Adaptations Supporting Radioresistance. Cancer Res. 2016; 76:3025–35.
31. Zheng R, Yao Q, Xie G, Du S, Ren C, Wang Y, Yuan Y. TAT-ODD-p53 enhances the radiosensitivity of hypoxic breast cancer cells by inhibiting Parkin-mediated mitophagy. Oncotarget. 2015; 6:17417–29. doi: 10.18632/oncotarget.4002.
32. Jun S, Jung YS, Suh HN, Wang W, Kim MJ, Oh YS, Lien EM, Shen X, Matsumoto Y, McCrea PD, Li L, Chen J, Park JI. LIG4 mediates Wnt signalling-induced radioresistance. Nat Commun. 2016; 7:10994.
33. Engreitz JM, Haines JE, Perez EM, Munson G, Chen J, Kane M, McDonel PE, Guttman M, Lander ES. Local regulation of gene expression by lncRNA promoters, transcription and splicing. Nature. 2016; 539:452–55.
34. Ørom UA, Derrien T, Beringer M, Gumireddy K, Gardini A, Bussotti G, Lai F, Zytnicki M, Notredame C, Huang Q, Guigo R, Shiekhattar R. Long noncoding RNAs with enhancer-like function in human cells. Cell. 2010; 143:46–58.
35. Hung T, Wang Y, Lin MF, Koegel AK, Kotake Y, Grant GD, Horlings HM, Shah N, Umbricht C, Wang P, Wang Y, Kong B, Langerød A, et al. Extensive and coordinated transcription of noncoding RNAs within cell-cycle promoters. Nat Genet. 2011; 43:621–29.
36. Schmitt AM, Chang HY. Long Noncoding RNAs in Cancer Pathways. Cancer Cell. 2016; 29:452–63.
37. Shao Y, Ye M, Li Q, Sun W, Ye G, Zhang X, Yang Y, Xiao B, Guo J. LncRNA-RMRP promotes carcinogenesis by acting as a miR-206 sponge and is used as a novel biomarker for gastric cancer. Oncotarget. 2016; 7:37812–24. doi: 10.18632/oncotarget.9336.
38. Wang ZH, Guo XQ, Zhang QS, Zhang JL, Duan YL, Li GF, Zheng DL. Long non-coding RNA CCAT1 promotes glioma cell proliferation via inhibiting microRNA-410. Biochem Biophys Res Commun. 2016; 480:715–20.
39. Zhou Q, Chen F, Zhao J, Li B, Liang Y, Pan W, Zhang S, Wang X, Zheng D. Long non-coding RNA PVT1 promotes osteosarcoma development by acting as a molecular sponge to regulate miR-195. Oncotarget. 2016; 7:82620–33. doi: 10.18632/oncotarget.13012.
40. Xie CH, Cao YM, Huang Y, Shi QW, Guo JH, Fan ZW, Li JG, Chen BW, Wu BY. Long non-coding RNA TUG1 contributes to tumorigenesis of human osteosarcoma by sponging miR-9-5p and regulating POU2F1 expression. Tumour Biol. 2016; 37:15031–41.
41. Song L, Liu S, Zhang L, Yao H, Gao F, Xu D, Li Q. MiR-21 modulates radiosensitivity of cervical cancer through inhibiting autophagy via the PTEN/Akt/HIF-1α feedback loop and the Akt-mTOR signaling pathway. Tumour Biol. 2016; 37:12161–68.
42. Qu JQ, Yi HM, Ye X, Li LN, Zhu JF, Xiao T, Yuan L, Li JY, Wang YY, Feng J, He QY, Lu SS, Yi H, Xiao ZQ. MiR-23a sensitizes nasopharyngeal carcinoma to irradiation by targeting IL-8/Stat3 pathway. Oncotarget. 2015; 6:28341–56. doi: 10.18632/oncotarget.5117.
43. Qu JQ, Yi HM, Ye X, Zhu JF, Yi H, Li LN, Xiao T, Yuan L, Li JY, Wang YY, Feng J, He QY, Lu SS, Xiao ZQ. MiRNA-203 Reduces Nasopharyngeal Carcinoma Radioresistance by Targeting IL8/AKT Signaling. Mol Cancer Ther. 2015; 14:2653–64.
44. Sun Q, Liu T, Zhang T, Du S, Xie GX, Lin X, Chen L, Yuan Y. MiR-101 sensitizes human nasopharyngeal carcinoma cells to radiation by targeting stathmin 1. Mol Med Rep. 2015; 11:3330–36.
45. Yang H, Liu P, Zhang J, Peng X, Lu Z, Yu S, Meng Y, Tong WM, Chen J. Long noncoding RNA MIR31HG exhibits oncogenic property in pancreatic ductal adenocarcinoma and is negatively regulated by miR-193b. Oncogene. 2016; 35:3647–57.
46. Duan W, Du L, Jiang X, Wang R, Yan S, Xie Y, Yan K, Wang Q, Wang L, Zhang X, Pan H, Yang Y, Wang C. Identification of a serum circulating lncRNA panel for the diagnosis and recurrence prediction of bladder cancer. Oncotarget. 2016; 7:78850–58. doi: 10.18632/oncotarget.12880.
47. Zhang K, Luo Z, Zhang Y, Zhang L, Wu L, Liu L, Yang J, Song X, Liu J. Circulating lncRNA H19 in plasma as a novel biomarker for breast cancer. Cancer Biomark. 2016; 17:187–94.
48. Jiang C, Li X, Zhao H, Liu H. Long non-coding RNAs: potential new biomarkers for predicting tumor invasion and metastasis. Mol Cancer. 2016; 15:62.