
INTRODUCTION
Tumor necrosis factor-alpha (TNF-α) gene, located on chromosome 6p21.231, consists of four exons [1, 2]. TNF-α protein, encoded by TNF-α gene, is associated with cellular differentiation, proliferation, apoptosis, inflammatory responses, insulin resistance, and tumorigenesis [2–4]. Several single nucleotide polymorphisms (SNPs), including rs1800629 (-308 G/A) and rs361525 (-238 G/A), have been identified in the promoter region of TNF-α gene [2].
The role of TNF-α gene mutations in the risk of squamous cell carcinoma (SCC) remains inconclusive. For instance, the rs1800629 polymorphism of TNF-α gene has been linked to the risk of esophageal SCC in northern Indian patients [5], but not in Kazakh patients [6]. TNF-α rs1800629 polymorphism has been associated with the risks of oral SCC in Taiwan [7], but not in northern Indian population, which has been linked with rs361525 polymorphism [8]. There was also no association between the rs1800629 polymorphism and lung SCC risk in the German population [9].
Skin cancer comprises cutaneous melanoma, skin SCC (SSCC), and skin basal cell carcinoma (SBCC) [10]. Allelic variants of TNF-α gene have been reported to contribute to the risk of skin cancer in certain populations. For example, the study by Rizzato et al. has indicated that TNF-α rs1800629 might affect the SBCC risk in Caucasian population [11]. The A allele or GA genotype of TNF-α gene rs1800629 polymorphism was also reported to influence the course of BCC in Polish population [12]. However, the role of TNF-α polymorphisms in skin cancer is still inconclusive. For example, Skov et al. reported that TNF-α release, but not rs1800629 polymorphism, was linked to the SBCC risk in Caucasian population [13]. To our knowledge, no meta-analysis has been previously performed to assess the link between TNF-α polymorphisms and the risk of skin cancer.
Therefore, in this study, we carried out a comprehensive systematic review and meta-analysis to determine the association of TNF-α polymorphisms and the risk of skin cancer and different SCC diseases.
RESULTS
Characteristics of studies included in meta-analysis
Six databases, including PUBMED, Web of Science (WOS), EMBASE, WANFANG, CNKI, and SCOPUS, were electronically searched on January 17th, 2017 to identify the eligible studies. The search details are shown in Supplementary Table 1. Flowchart of the search strategy and article selection for meta-analysis is shown in Figure 1. Briefly, 985 related articles were obtained from the above databases. After 241 duplicated articles were removed, 699 articles were excluded by screening the title and abstract. The eligibility of 45 full-text articles was then assessed, and 25 articles were excluded. The results are shown in Supplementary Table 2. Finally, 20 eligible articles with 4865 cases and 6329 controls were included for quantitative synthesis [1, 5–9, 11–24]. All selected articles met the inclusion and exclusion criteria. We used the Newcastle-Ottawa Scale (NOS) to assess the quality of the studies. As shown in Supplementary Table 3, the NOS scores of all studies were equal to or greater than 7, indicating a high quality. After covariate adjustment in logistic regression, the characteristics and genotype distributions of included studies are shown in Tables 1 and 2.
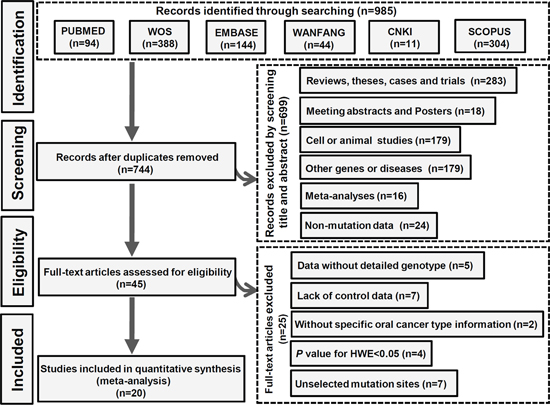
Figure 1: The selection process of the meta-analysis.
Table 1: Characteristics of studies included in meta-analysis
First author |
Year |
Country |
Ethnicity |
Number |
Source of controls |
Age (mean value) |
Genotyping assay |
Gender (male %) |
|||
|---|---|---|---|---|---|---|---|---|---|---|---|
Case |
Control |
Case |
Control |
Case |
Control |
||||||
Cui [6] |
2015 |
China |
Asian |
212 |
200 |
Population |
52.5 |
54.4 |
PCR-RFLP |
59.7% |
51.8% |
Flego [14] |
2009 |
Croatia |
Caucasian |
113 |
230 |
Population |
NA |
NA |
PCR-RFLP |
NA |
NA |
Gu [15] |
2009 |
USA |
Caucasian |
212 |
211 |
Population |
NA |
NA |
ARMS-PCR |
NA |
NA |
Gupta [1] |
2008 |
India |
Asian |
94 |
133 |
Population |
50.7 |
NA |
PCR-RFLP |
80.9% |
NA |
Huang [19] |
2005 |
China |
Asian |
65 |
65 |
Population |
65.0 |
55.0 |
PCR-RFLP |
81.5% |
77.0% |
Kietthubthew [24] |
2010 |
Thailand |
Asian |
97 |
152 |
Population |
67.5 |
69.7 |
Taqman PCR |
73.8% |
55.4% |
Kostic [17] |
2013 |
Serbia |
Caucasian |
50# |
60 |
Population |
69.0# |
NA |
PCR-RFLP |
70.0%# |
NA |
|
|
|
|
50& |
60 |
Population |
73.0& |
NA |
PCR-RFLP |
40.0%& |
NA |
Liu [7] |
2005 |
China |
Asian |
192 |
146 |
Population |
54.1 |
52.0 |
PCR-RFLP |
90.1% |
89.0% |
Oh [23] |
2010 |
USA |
Caucasian |
75 |
839 |
Population |
NA |
NA |
SNPlex assay |
NA |
NA |
Rizzato [11] |
2011 |
Mixed |
Caucasian |
506 |
515 |
Hospital |
67.0 |
61.0 |
KASPar SNP genotyping |
44.8% |
51.4% |
Seifart [9] |
2005 |
Germany |
Caucasian |
40 |
242 |
Population |
65.4 |
37.9 |
PCR-RFLP |
NA |
55.1% |
Shih [20] |
2006 |
China |
Asian |
83 |
205 |
Population |
NA |
62.8 |
PCR-RFLP+ sequencing |
NA |
66.3% |
Singh [8] |
2015 |
India |
Asian |
272 |
185 |
Population |
47.7 |
43.1 |
PCR-RFLP |
80.5% |
76.8% |
Skov [13] |
2003 |
Denmark |
Caucasian |
191 |
107 |
Population |
65.9 |
64.6 |
PCR-RFLP |
59.2% |
53.3% |
Sobjanek [12] |
2015 |
Poland |
Caucasian |
176 |
261 |
Population |
68.9 |
NA |
ARMS-PCR |
46.6% |
NA |
Umar [5] |
2013 |
India |
Asian |
290 |
311 |
Population |
57.0 |
55.0 |
ARMS-PCR |
72.8% |
71.1% |
Welsh [16] |
2011 |
USA |
Caucasian |
894& |
816 |
Population |
58.7& |
61.3 |
Taqman PCR |
56.0%& |
59.9% |
|
|
|
|
681* |
816 |
Population |
64.1* |
61.3 |
Taqman PCR |
63.5%* |
59.9% |
Whiteman [18] |
2010 |
Australia |
Caucasian |
207 |
1293 |
Population |
NA |
NA |
Sequenom iPLEX |
58.0% |
66.0% |
Yang [21] |
2011 |
China |
Asian |
205 |
198 |
Population |
49.3 |
48.9 |
Taqman PCR |
100.0% |
100.0% |
Zhang [22] |
2011 |
China |
Asian |
160 |
160 |
NA |
NA |
NA |
PCR-SSP |
NA |
NA |
Ref: reference; #: OSCC group; &: SBCC group; *: SSCC group; NA: not available; PCR-RFLP: polymerase chain reaction-restriction fragment length polymorphism; ARMS-PCR: amplification refractory mutation system-polymerase chain reaction; Taqman PCR: Taqman polymerase chain reaction; PCR-SSP: Polymerase chain reaction-sequence specific primer.
Table 2: The genotype data of studies included in meta-analysis
Group |
SNP |
First author [Ref] |
Year |
Case |
Disease |
Control |
HWE |
|||||||
|---|---|---|---|---|---|---|---|---|---|---|---|---|---|---|
Total |
G/G |
G/A |
A/A |
Total |
G/G |
G/A |
A/A |
χ2 |
P |
|||||
SSC |
rs1800629 |
Flego [14] |
2009 |
113 |
79 |
30 |
4 |
LSCC |
230 |
171 |
53 |
6 |
0.59 |
0.44 |
|
|
Huang [19] |
2005 |
65 |
64 |
1 |
0 |
LSCC |
65 |
55 |
10 |
0 |
0.45 |
0.50 |
|
|
Oh [23] |
2010 |
75 |
56 |
18 |
1 |
LSCC |
839 |
632 |
194 |
13 |
0.19 |
0.67 |
|
|
Seifart [9] |
2005 |
40 |
24 |
15 |
1 |
LSCC |
242 |
171 |
67 |
4 |
0.79 |
0.37 |
|
|
Shih [20] |
2006 |
83 |
50 |
25 |
8 |
LSCC |
205 |
169 |
34 |
2 |
0.04 |
0.84 |
|
|
Gupta [1] |
2008 |
94 |
61 |
23 |
10 |
OSCC |
133 |
114 |
19 |
0 |
0.79 |
0.38 |
|
|
Kietthubthew [24] |
2010 |
97 |
83 |
14& |
- |
OSCC |
152 |
133 |
19& |
- |
NA |
>0.05 |
|
|
Kostic [17] |
2013 |
50 |
35 |
14 |
1 |
OSCC |
60 |
39 |
21 |
0 |
2.70 |
0.10 |
|
|
Liu [7] |
2005 |
192 |
175 |
16 |
1 |
OSCC |
146 |
120 |
24 |
2 |
0.39 |
0.53 |
|
|
Singh [8] |
2015 |
272 |
235 |
35 |
2 |
OSCC |
185 |
164 |
20 |
1 |
0.21 |
0.65 |
|
|
Cui [6] |
2015 |
212 |
150 |
57 |
5 |
ESCC |
200 |
140 |
58 |
2 |
2.29 |
0.13 |
|
|
Umar [5] |
2013 |
290 |
227 |
62 |
1 |
ESCC |
311 |
268 |
42 |
1 |
0.23 |
0.63 |
|
|
Whiteman [18] |
2010 |
207 |
128 |
71 |
8 |
ESCC |
1293 |
842 |
403 |
48 |
0.00 |
0.98 |
|
|
Zhang [22] |
2011 |
160 |
135 |
23 |
2 |
ESCC |
160 |
140 |
18 |
2 |
2.36 |
0.12 |
|
|
Yang [21] |
2011 |
205 |
180 |
23 |
2 |
OPSCC |
198 |
155 |
43 |
0 |
2.94 |
0.09 |
|
|
Welsh [16] |
2011 |
681 |
476 |
188 |
17 |
SSCC |
816 |
571 |
223 |
22 |
0.00 |
0.97 |
SSC |
rs361525 |
Kietthubthew [24] |
2010 |
97 |
92 |
5& |
- |
OSCC |
152 |
141 |
11& |
- |
NA |
>0.05 |
|
|
Liu [7] |
2005 |
192 |
188 |
4 |
0 |
OSCC |
146 |
136 |
10 |
0 |
0.18 |
0.67 |
|
|
Singh [8] |
2015 |
272 |
252 |
20 |
0 |
OSCC |
185 |
180 |
5 |
0 |
0.03 |
0.85 |
|
|
Flego [14] |
2009 |
113 |
108 |
5 |
0 |
LSCC |
230 |
214 |
16 |
0 |
0.30 |
0.58 |
|
|
Shih [20] |
2006 |
83 |
75 |
8 |
0 |
LSCC |
205 |
161 |
44 |
0 |
2.96 |
0.09 |
|
|
Yang [21] |
2011 |
205 |
200 |
5 |
0 |
OPSCC |
198 |
187 |
11 |
0 |
0.16 |
0.69 |
skin cancer |
rs1800629 |
Gu [15] |
2009 |
212 |
156 |
46 |
10 |
melanoma |
211 |
140 |
61 |
10 |
0.98 |
0.32 |
|
|
Kostic [17] |
2013 |
50 |
29 |
21 |
0 |
SBCC |
60 |
39 |
21 |
0 |
2.70 |
0.10 |
|
|
Rizzato [11] |
2011 |
506 |
358 |
128 |
20 |
SBCC |
515 |
390 |
117 |
8 |
0.05 |
0.82 |
|
|
Skov [13] |
2003 |
191 |
133 |
49 |
9 |
SBCC |
107 |
68 |
37 |
2 |
1.45 |
0.23 |
|
|
Sobjanek [12] |
2015 |
176 |
134 |
41 |
1 |
SBCC |
261 |
178 |
80 |
3 |
3.38 |
0.07 |
|
|
Welsh [16] |
2011 |
894 |
612 |
265 |
17 |
SBCC |
816 |
571 |
223 |
22 |
0.00 |
0.97 |
|
|
|
|
681 |
476 |
188 |
17 |
SSCC |
816 |
571 |
223 |
22 |
0.00 |
0.97 |
Ref: reference; SCC: squamous cell carcinoma; SNP: single nucleotide polymorphisms; &: the number of GA+AA; NA: not available; LSCC: lung squamous cell carcinoma; OSCC: oral squamous cell carcinoma; ESCC: esophageal squamous cell carcinoma; OPSCC: oral and pharyngeal squamous cell carcinoma; SSCC: skin squamous cell carcinoma; SBCC: skin basal cell carcinomas; HWE: Hardy-Weinberg equilibrium.
Association between TNF-α rs1800629 polymorphism and the risk of SCC
Meta-analysis of 16 studies [1, 5–9, 14, 16–24] comprising 2836 cases and 5235 controls was performed to analyze the association between TNF-α rs1800629 polymorphism and the risk of SCC under allele model (A vs G), homozygote model (AA vs GG), heterozygote model (GA vs GG), dominant model (GA+AA vs GG), recessive model (AA vs GG+GA), and carrier model (carrier A vs G). Pooled analysis data are shown in Table 3. Compared with the control group, no significant overall SCC risk was observed in the case group under A vs G model (OR=1.18, 95% CI=0.92~1.51, Passociation=0.192), GA vs GG model (OR=1.10, 95% CI=0.87~1.39, Passociation=0.439), GA+AA vs GG (OR=1.15, 95% CI=0.90~1.47, Passociation=0.255), or carrier A vs G model (OR=1.12, 95% CI=0.91~1.39, Passociation=0.287). However, an increased overall SCC risk was observed in AA vs GG model (OR=1.62, 95% CI=1.15~2.29, Passociation=0.006) and AA vs GG+GA model (OR=1.56, 95% CI=1.10~2.20, Passociation=0.012).
Table 3: Pooled analysis for the association between TNF-α rs1800629 polymorphism and the risk of SCC
Comparison |
Subgroup |
Test of association |
Number |
|||||
|---|---|---|---|---|---|---|---|---|
ORs |
95% CIs |
z |
Passociation |
Studies |
Case |
Control |
||
A vs G |
overall |
1.18 |
0.92~1.51 |
1.30 |
0.192 |
15 |
2739 |
5083 |
|
Asian |
1.18 |
0.73~1.92 |
0.67 |
0.501 |
9 |
1573 |
1603 |
|
Caucasian |
1.07 |
0.93~1.22 |
0.94 |
0.349 |
6 |
1166 |
3480 |
|
ESCC |
1.19 |
0.99~1.44 |
1.84 |
0.066 |
4 |
869 |
1964 |
|
LSCC |
1.39 |
0.72~2.36 |
0.87 |
0.385 |
5 |
376 |
1581 |
|
OSCC |
1.19 |
0.49~2.88 |
0.39 |
0.697 |
4 |
608 |
524 |
AA vs GG |
overall |
1.62 |
1.15~2.29 |
2.73 |
0.006 |
14 |
2674 |
5018 |
|
Asian |
3.67 |
1.89~7.16 |
3.82 |
<0.001 |
8 |
1508 |
1538 |
|
Caucasian |
1.08 |
0.70~1.66 |
0.33 |
0.743 |
6 |
1166 |
3480 |
|
ESCC |
1.24 |
0.66~2.32 |
0.68 |
0.497 |
4 |
869 |
1964 |
|
LSCC |
2.72 |
1.32~5.61 |
2.72 |
0.007 |
4 |
311 |
1516 |
|
OSCC |
3.91 |
1.38~11.05 |
2.57 |
0.010 |
4 |
608 |
524 |
GA vs GG |
overall |
1.10 |
0.87~1.39 |
0.77 |
0.439 |
15 |
2739 |
5083 |
|
Asian |
1.05 |
0.67~1.64 |
0.20 |
0.839 |
9 |
1573 |
1603 |
|
Caucasian |
1.08 |
0.92~1.27 |
0.97 |
0.334 |
6 |
1166 |
3480 |
|
ESCC |
1.23 |
0.95~1.61 |
1.55 |
0.120 |
4 |
869 |
1964 |
|
LSCC |
1.27 |
0.74~2.18 |
0.85 |
0.393 |
5 |
376 |
1581 |
|
OSCC |
0.99 |
0.51~1.95 |
0.02 |
0.986 |
4 |
608 |
524 |
GA+AA vs GG |
overall |
1.15 |
0.90~1.47 |
1.14 |
0.255 |
16 |
2836 |
5235 |
|
Asian |
1.14 |
0.73~1.77 |
0.56 |
0.577 |
10 |
1670 |
1755 |
|
Caucasian |
1.08 |
0.93~1.26 |
0.99 |
0.324 |
6 |
1166 |
3480 |
|
ESCC |
1.24 |
0.97~1.57 |
1.73 |
0.084 |
4 |
869 |
1964 |
|
LSCC |
1.31 |
0.71~2.40 |
0.86 |
0.389 |
5 |
376 |
1581 |
|
OSCC |
1.12 |
0.58~2.15 |
0.33 |
0.738 |
5 |
705 |
676 |
AA vs GG+GA |
overall |
1.56 |
1.10~2.20 |
2.53 |
0.012 |
14 |
2674 |
5018 |
|
Asian |
3.52 |
1.80~6.88 |
3.68 |
<0.001 |
8 |
1508 |
1538 |
|
Caucasian |
1.05 |
0.68~1.62 |
0.22 |
0.829 |
6 |
1166 |
3480 |
|
ESCC |
1.19 |
0.64~2.22 |
0.56 |
0.577 |
4 |
869 |
1964 |
|
LSCC |
2.48 |
1.20~5.12 |
2.45 |
0.014 |
4 |
311 |
1516 |
|
OSCC |
3.84 |
1.34~11.01 |
2.50 |
0.012 |
4 |
608 |
524 |
carrier A vs G |
overall |
1.12 |
0.91~1.39 |
1.06 |
0.287 |
15 |
2739 |
5083 |
|
Asian |
1.12 |
0.74~1.69 |
0.52 |
0.604 |
9 |
1573 |
1603 |
|
Caucasian |
1.06 |
0.91~1.22 |
0.73 |
0.468 |
6 |
1166 |
3480 |
|
ESCC |
1.17 |
0.96~1.42 |
1.59 |
0.111 |
4 |
869 |
1964 |
|
LSCC |
1.24 |
0.75~2.07 |
0.84 |
0.402 |
5 |
376 |
1581 |
|
OSCC |
1.10 |
0.54~2.24 |
0.27 |
0.789 |
4 |
608 |
524 |
ESCC: esophageal squamous cell carcinoma; LSCC: lung squamous cell carcinoma; OSCC: oral squamous cell carcinoma; Ors: odd ratios; CIs: confidence intervals.
There are several types of SCC, including skin SCC (SSCC), esophageal SCC (ESCC), oral SCC (OSCC), and lung SCC (LSCC). We performed subgroup analyses of the above SCC types and different ethnicities under all models. As shown in Table 3 and Figure 2A, an increased overall SCC risk was observed in the Asian population under AA vs GG model (OR=3.67, 95% CI=1.89~7.16, Passociation<0.001). The increased risk of LSCC (OR=2.72, 95% CI=1.32~5.61, Passociation=0.007) and OSCC (OR=3.91, 95% CI=1.38~11.05, Passociation=0.010) was also observed (Table 3 and Figure 2B). Similar results were observed for the AA vs GG+GA model (Table 3 and Figure 3). No significant difference was found under other genetic models (all Passociation>0.05). These data indicate that the AA genotype of TNF-α rs1800629 polymorphism correlates with the higher susceptibility towards SCC.
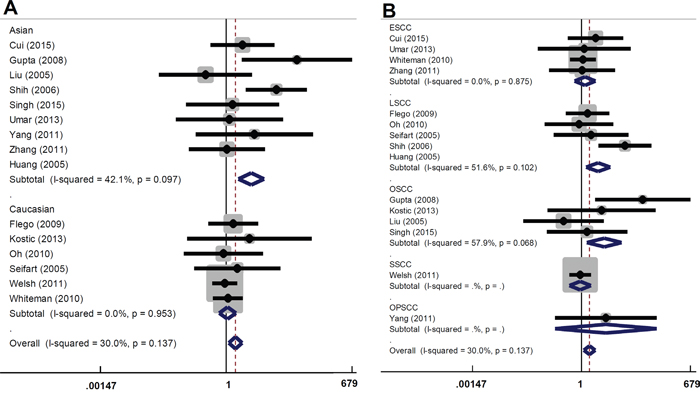
Figure 2: Forest plot for the association between TNF-α rs1800629 polymorphism and the risk of SCC under AA vs GG model. (A) Subgroup analyses based on ethnicity; (B) Subgroup analyses based on disease type.
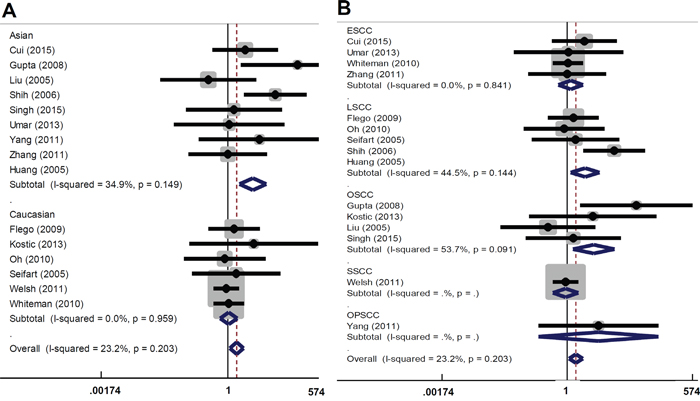
Figure 3: Forest plot for the association between TNF-α rs1800629 polymorphism and the risk of SCC under AA vs GG+GA model. (A) Subgroup analyses based on ethnicity; (B) Subgroup analyses based on disease type.
Association between TNF-α rs361525 polymorphism and the risk of SCC
Meta-analysis of the relationship between TNF-α rs361525 polymorphism and susceptibility to SCC was also performed. Six studies comprising 962 cases and 1116 controls were analyzed [7, 8, 14, 20, 21, 24]. Data of pooled analysis indicated that there was no significant difference for overall SCC risk under all genetic models (Table 4 and Supplementary Figure 1; all Passociation>0.05). Subgroup analysis (Table 4) indicated a decreased LSCC risk under A vs G model (OR=0.49, 95% CI=0.26~0.90, Passociation=0.023), GA vs GG model (OR=0.46, 95% CI=0.25~0.87, Passociation=0.018); GA+AA vs GG (OR=0.46, 95% CI=0.25~0.87, Passociation=0.018), and carrier A vs G (OR=0.51, 95% CI=0.27~0.96, Passociation=0.037). However, only two case-control studies comprising 196 cases and 435 controls were included in the LSCC subgroup [14, 20]. No significant difference was found for other comparisons (all Passociation>0.05). These data indicate that TNF-α rs361525 polymorphism does not contribute to the risk of SCC.
Table 4: Pooled analysis for the association between TNF-α rs361525 polymorphism and the risk of SCC
Comparison |
Subgroup |
Test of association |
Number |
|||||
|---|---|---|---|---|---|---|---|---|
ORs |
95% CIs |
z |
Passociation |
Studies |
Case |
Control |
||
A vs G |
overall |
0.63 |
0.29~1.35 |
1.19 |
0.235 |
5 |
865 |
964 |
|
Asian |
0.63 |
0.24~1.68 |
0.93 |
0.354 |
4 |
752 |
734 |
|
LSCC |
0.49 |
0.26~0.90 |
2.28 |
0.023 |
2 |
196 |
435 |
|
OSCC |
0.93 |
0.10~8.36 |
0.06 |
0.949 |
2 |
464 |
331 |
GA vs GG |
overall |
0.62 |
0.28~1.36 |
1.20 |
0.231 |
5 |
865 |
964 |
|
Asian |
0.61 |
0.22~1.70 |
0.94 |
0.348 |
4 |
752 |
734 |
|
LSCC |
0.46 |
0.25~0.87 |
2.38 |
0.018 |
2 |
196 |
435 |
|
OSCC |
0.93 |
0.10~8.78 |
0.06 |
0.949 |
2 |
464 |
331 |
GA+AA vs GG |
overall |
0.93 |
0.10~8.78 |
1.39 |
0.165 |
6 |
962 |
1116 |
|
Asian |
0.63 |
0.28~1.41 |
1.13 |
0.259 |
5 |
849 |
886 |
|
LSCC |
0.46 |
0.25~0.87 |
2.38 |
0.018 |
2 |
196 |
435 |
|
OSCC |
0.86 |
0.23~3.22 |
0.23 |
0.818 |
3 |
561 |
483 |
carrier A vs G |
overall |
0.64 |
0.31~1.35 |
1.17 |
0.243 |
5 |
865 |
964 |
|
Asian |
0.64 |
0.25~1.67 |
0.91 |
0.364 |
4 |
752 |
734 |
|
LSCC |
0.51 |
0.27~0.96 |
2.09 |
0.037 |
2 |
196 |
435 |
|
OSCC |
0.93 |
0.11~7.98 |
0.06 |
0.948 |
2 |
464 |
331 |
LSCC: lung squamous cell carcinoma; OSCC: oral squamous cell carcinoma; Ors: odd ratios; CIs: confidence intervals.
Association between TNF-α rs1800629 polymorphism and the risk of skin cancer
We then performed meta-analysis of the relationship between TNF-α rs1800629 and the risk of skin cancer, including SSCC, SBCC, and melanoma. Seven studies comprising 2710 cases and 2786 controls were included [11–13, 15–17]. Data of pooled analysis indicated no significant difference under all genetic models (all Passociation>0.05, Table 5 and Supplementary Figure 2). Subgroup analysis (based PB and SBCC) also showed no significant difference (Table 5). However, only one case-control study was included in the subgroup analysis of melanoma [15] and SSCC [16] (Table 5). These data suggest that TNF-α rs1800629 polymorphism does not have a significant correlation with the risk of skin cancer.
Table 5: Pooled analysis for the association between TNF-α rs1800629 polymorphism and the risk of skin cancer
Comparison |
Subgroup |
Test of association |
Number |
|||||
|---|---|---|---|---|---|---|---|---|
ORs |
95% CIs |
z |
Passociation |
Studies |
Case |
Control |
||
A vs G |
overall |
1.01 |
0.91~1.12 |
0.24 |
0.814 |
7 |
2710 |
2786 |
|
Caucasian |
1.01 |
0.91~1.12 |
0.24 |
0.814 |
7 |
2710 |
2786 |
|
PB |
0.95 |
0.85~1.07 |
0.82 |
0.413 |
6 |
2204 |
2271 |
|
SBCC |
1.05 |
0.93~1.20 |
0.82 |
0.411 |
5 |
1817 |
1759 |
|
melanoma |
0.78 |
0.54~1.11 |
1.39 |
0.164 |
1 |
212 |
211 |
|
SSCC |
1.00 |
0.82~1.21 |
0.04 |
0.964 |
1 |
681 |
816 |
AA vs GG |
overall |
1.09 |
0.78~1.54 |
0.52 |
0.603 |
6 |
2660 |
2726 |
|
Caucasian |
1.09 |
0.78~1.54 |
0.52 |
0.603 |
6 |
2660 |
2726 |
|
PB |
0.88 |
0.60~1.29 |
0.65 |
0.513 |
5 |
2154 |
2211 |
|
SBCC |
1.24 |
0.79~1.95 |
0.95 |
0.340 |
4 |
1767 |
1699 |
|
melanoma |
0.90 |
0.36~2.22 |
0.23 |
0.815 |
1 |
212 |
211 |
|
SSCC |
0.93 |
0.49~1.77 |
0.23 |
0.818 |
1 |
681 |
816 |
GA vs GG |
overall |
0.99 |
0.88~1.12 |
0.08 |
0.933 |
7 |
2710 |
2786 |
|
Caucasian |
0.99 |
0.88~1.12 |
0.08 |
0.933 |
7 |
2710 |
2786 |
|
PB |
0.96 |
0.84~1.09 |
0.64 |
0.524 |
6 |
2204 |
2271 |
|
SBCC |
1.03 |
0.89~1.20 |
0.41 |
0.680 |
5 |
1817 |
1759 |
|
melanoma |
0.68 |
0.43~1.06 |
1.72 |
0.086 |
1 |
212 |
211 |
|
SSCC |
1.01 |
0.80~1.27 |
0.10 |
0.923 |
1 |
681 |
816 |
GA+AA vs GG |
overall |
1.00 |
0.89~1.13 |
0.07 |
0.620 |
7 |
2710 |
2786 |
|
Caucasian |
1.00 |
0.89~1.13 |
0.07 |
0.620 |
6 |
2710 |
2786 |
|
PB |
0.95 |
0.84~1.08 |
0.75 |
0.453 |
5 |
2204 |
2271 |
|
SBCC |
1.05 |
0.91~1.21 |
0.63 |
0.527 |
1 |
1817 |
1759 |
|
melanoma |
0.71 |
0.47~1.08 |
1.62 |
0.105 |
1 |
212 |
211 |
|
SSCC |
1.00 |
0.80~1.25 |
0.03 |
0.974 |
7 |
681 |
816 |
AA vs GG+GA |
overall |
1.10 |
0.79~1.55 |
0.57 |
0.569 |
6 |
2660 |
2726 |
|
Caucasian |
1.10 |
0.79~1.55 |
0.57 |
0.569 |
6 |
2660 |
2726 |
|
PB |
0.90 |
0.62~1.31 |
0.54 |
0.587 |
5 |
2154 |
2211 |
|
SBCC |
1.23 |
0.79~1.93 |
0.92 |
0.359 |
4 |
1767 |
1699 |
|
melanoma |
1.00 |
0.41~2.44 |
0.01 |
0.991 |
1 |
212 |
211 |
|
SSCC |
0.92 |
0.49~1.75 |
0.24 |
0.809 |
1 |
681 |
816 |
carrier A vs G |
overall |
1.01 |
0.90~1.12 |
0.10 |
0.920 |
7 |
2710 |
2786 |
|
Caucasian |
1.01 |
0.90~1.12 |
0.10 |
0.920 |
7 |
2710 |
2786 |
|
PB |
0.96 |
0.85~1.09 |
0.59 |
0.553 |
6 |
2204 |
2271 |
|
SBCC |
1.01 |
0.90~1.19 |
0.53 |
0.595 |
5 |
1817 |
1759 |
|
melanoma |
0.78 |
0.53~1.17 |
1.18 |
0.236 |
1 |
212 |
211 |
|
SSCC |
1.00 |
0.81~1.24 |
0.01 |
0.996 |
1 |
681 |
816 |
SBCC: skin basal cell carcinomas; SSCC: skin squamous cell carcinoma, Ors: odd ratios; CIs: confidence intervals.
Heterogeneity, publication bias and sensitivity analysis
Regarding the rs1800629 polymorphism and SCC risk, A vs G (I2 value of 77.5 % and Pheterogeneity <0.001), GA vs GG (I2=66.3 % and Pheterogeneity <0.001), GA+AA vs GG (I2=71.4 % and Pheterogeneity <0.001) and carrier A vs G (I2 =64.0 % and Pheterogeneity <0.001) data indicated a high degree of heterogeneity among the studies (Table 6). Thus, random-effect model was applied. In addition, fixed model was used in AA vs GG (I2=30.0 % and Pheterogeneity=0.137) and AA vs GG+GA contrast (I2 =23.2 % and Pheterogeneity =0.203, Table 6).
Table 6: The analysis of heterogeneity and publication bias
Group |
SNP |
Comparison |
Heterogeneity |
Model |
Begg’s test |
Egger’s test |
|||
|---|---|---|---|---|---|---|---|---|---|
I2 |
Pheterogeneity |
z |
PBegg |
t |
PEgger |
||||
SSC |
rs1800629 |
A vs G |
77.5% |
<0.001 |
Random |
0.49 |
0.621 |
0.07 |
0.942 |
|
|
AA vs GG |
30.0% |
0.137 |
Fixed |
1.20 |
0.228 |
1.67 |
0.120 |
|
|
GA vs GG |
66.3% |
<0.001 |
Random |
0.00 |
1.000 |
-0.42 |
0.683 |
|
|
GA+AA vs GG |
71.4% |
<0.001 |
Random |
-0.05 |
1.000 |
-0.12 |
0.903 |
|
|
AA vs GG+GA |
23.2% |
0.203 |
Fixed |
1.20 |
0.228 |
1.75 |
0.105 |
|
|
carrier A vs G |
64.0 % |
<0.001 |
Random |
0.00 |
1.000 |
-0.17 |
0.864 |
SSC |
rs361525 |
A vs G |
66.2% |
0.019 |
Random |
0.73 |
0.462 |
0.05 |
0.962 |
|
|
GA vs GG |
67.7% |
0.015 |
Random |
0.73 |
0.462 |
0.05 |
0.962 |
|
|
GA+AA vs GG |
59.8% |
0.029 |
Random |
0.38 |
0.707 |
0.09 |
0.930 |
|
|
carrier A vs G |
63.2% |
0.028 |
Random |
0.73 |
0.462 |
-0.03 |
0.978 |
skin cancer |
rs1800629 |
A vs G |
46.1% |
0.084 |
Fixed |
0.30 |
0.764 |
-0.68 |
0.528 |
|
|
AA vs GG |
38.6% |
0.148 |
Fixed |
0.38 |
0.707 |
0.33 |
0.756 |
|
|
GA vs GG |
45.4% |
0.089 |
Fixed |
0.30 |
0.764 |
-1.36 |
0.233 |
|
|
GA+AA vs GG |
46.6% |
0.081 |
Fixed |
0.60 |
0.548 |
-1.04 |
0.347 |
|
|
AA vs GG+GA |
38.1% |
0.152 |
Fixed |
0.38 |
0.707 |
0.49 |
0.650 |
|
|
carrier A vs G |
7.4% |
0.372 |
Fixed |
0.30 |
0.764 |
-0.95 |
0.387 |
SCC: squamous cell carcinoma; SNP: single nucleotide polymorphisms.
For the rs361525 polymorphism and SCC risk, random-effect model was used for the overall SCC, due to the presence of overall significant heterogeneity (Table 6, all I2>50 %, Pheterogeneity<0.05). For the rs1800629 polymorphism and the risk of skin cancer, fixed-effect model was used for all models (Table 6, all I2 < 50 %, Pheterogeneity >0.05).
We also performed Begg’s and Egger’s tests to evaluate the potential publication bias among the included articles. The results indicate that publication bias can be ruled out for all comparisons (Table 6 and supplementary Figures 3-4; all PBegg>0.05, PEgger>0.05). Moreover, we conducted a sensitivity analysis and confirmed the stability of our results (Supplementary Figure 5 for rs1800629 and SCC risk; data no shown for others).
DISCUSSION
In the present study, 16 case-control studies of TNF-α rs1800629 polymorphism [1, 5–9, 14, 16–24] and 6 case-control studies of rs361525 polymorphism [7, 8, 14, 20, 21, 24] were included in the meta-analysis of TNF-α polymorphism and the risk of SCC disease. We found that an increased overall SCC risk was associated with the rs1800629 polymorphisms in the Asian population under AA vs GG, and AA vs GG+GA models, but not A vs G, GA vs GG, GA+AA vs GG, or carrier A vs G models. A significant difference between LSCC/OSCC risks and the rs1800629 polymorphism was found under the AA vs GG, and AA vs GG+GA models; this corresponds with previous data on the link of rs1800629 and the risk of upper aero-digestive tract or head/neck SCC [25, 26]. However, in 2013, Chen et al performed a meta-analysis to analyze the association between rs1800629 and oral cancer, and observed a negative association between rs1800629 and OSCC [27]. Different selection criteria may contribute to this discrepancy. In our meta-analysis, two studies were excluded due to the requirement of Hardy-Weinberg equilibrium (HWE) or genotype data [28, 29]. Regarding the ESCC risk and rs1800629 polymorphism, the negative result was found under all genetic models, which was in line with the data of Luo et al [30]. The rs361525 allele was reported to be significantly increased in healthy controls compared with cancer patients, indicating a protective function [31]. Here, no significant difference was detected for rs361525 and overall SCC risks under all genetic models, which was partly in accordance with the data of Gao et al regarding head and neck SCC [26] and Zhou et al for overall cancer [32]. In addition, seven case-control studies in Caucasian population were included for the analysis of skin cancer [11–13, 15–17]. We failed to observe a significant association between TNF-α rs1800629 and skin cancer. In 2011, Nan et al also did not find any association between TNF-α gene variants and skin BCC or SCC in the Genome-Wide Association Studies (GWAS) from 2045 cases and 6013 controls of European population [33].
Although our results were validated by Begg’s and Egger’s tests, and by sensitivity analysis, the limitations in our meta-analysis should also be addressed. (1) Due to the limited number of studies published to date, only the common genetic polymorphisms of TNF-α, including rs1800629 and rs361525, were chosen. In addition, small sample size and/or limited genotype data in eligible articles affected our analysis. For example, there are two case-control studies of the association between TNF-α rs1800629 and melanoma risk [15, 34]. However, one study was excluded due to the departure of HWE [34]. The frequency data of GA+AA combined genotype and GG genotype were extracted in one OSCC study [24]. (2) A considerable heterogeneity was observed in the meta-analysis of rs1800629/rs361525 and the SSC risks. SCC has many different etiologies, and stratified analyses by every SCC disease type were not performed. The variations of clinical characteristics, ethnicity, geographical location, habits, gender, age and population feature were not fully considered. In spite of the use of random-effect model, a limited number of studies was included in the subgroup analysis. For example, only one case-control study was included for the rs1800629 and the susceptibility to a specific SCC disease, including SSCC [16] and OPSCC [21]. The subgroup analysis of LSCC and rs361525 was based on only 2 case-control studies [14, 20], and showed a positive correlation under A vs G model, GA vs GG model; GA+AA vs GG, and carrier A vs G model. It is possible that the GA genotype of rs361525 is associated with the decreased risk of LSCC. However, well-powered studies and stratified analyses by more factors are required to confirm our findings.
TNF-α is an important multifunctional pro-inflammatory cytokine, which is closely linked to the occurrence, progression, metastasis, prevention and therapy of many types of human cancer [35–37]. Alterations in TNF-α gene expression or TNF-α cytokine release lead to a variety of cancers [2, 38]. Genetic variation has been considered as a disease susceptibility or resistance factor [2]. The rs1800629 G/A polymorphism, located in the promoter region (-308 site) of human TNF-α gene, can lead to the substitution from G common allele to A rare allele [2]. In vitro experiments showed that the “A” rare allele of rs1800629 could increase TNF-α transcription [39, 40]. The frequency of “A” allele also positively correlates with high TNF-α levels in patients with oral cancer [28]. TNF-α rs1800629 was found to be positively associated with distant metastases of triple negative breast cancer patients [36]. However, no association was found between rs1800629 and TNF-α gene expression in gastric cancer patients [41, 42]. Here, we observed a positive correlation between the AA genotype of rs1800629 and the risks of LSCC/OSCC. However, we did not find any significant association between the A allele and the SCC risks. It is possible that the “A” rare allele functions in an allele dosage-dependent manner. TNF-α was found to increase the efficiency of chemotherapy and radiotherapy against breast cancer cells [43]. The carriage of the A rare allele of rs1800629 may be involved in this process, through inducing TNF-α transcription and protein expression. It may be meaningful to analyze the effect of combined mutations of TNF-α and other genes, including TNF-beta and interleukin-6, on the carcinogenesis and SCC cancer therapy, since this may lead to the discovery of potential novel biomarkers for SCC.
In conclusion, our meta-analysis indicates that the AA genotype of TNF-α rs1800629 polymorphism may serve as a prognostic biomarker for SCC, especially for LSCC and OSCC in the Asian population. The rs361525 polymorphism does not seem to be a genetic risk factor for SCC. In conjunction with other studies, these results provide a scientific support for the prognostic value of TNF-α rs1800629 polymorphisms in predicting the SCC risk.
MATERIALS AND METHODS
Database retrieval
The related articles published before January 17th, 2017 were searched in the electronic databases, including PUBMED, WOS, EMBASE, WANFANG, CNKI and SCOPUS, without any language restrictions. The present meta-analysis followed “Preferred Reporting Items for Systematic Reviews and Meta-Analyses” (PRISMA) [44], as shown in Supplementary Table 4.
Article selection
Duplicated articles were removed by EndNote X7 software (Thomson Reuters). The following articles were excluded: 1) Reviews, theses, cases and trials; 2) Meeting abstracts and posters; 3) Cell or animal studies; 4) Other genes or diseases; 5) Meta-analyses; 6) Non-mutation data; 7) Data without detailed genotype; 8) Lack of control data; 9) Studies without specific oral cancer type information; 10) P value for HWE (PHWE) was less than 0.05; 11) Studies with unselected mutation sites. The selected articles provide sufficient information regarding the genotypes for TNF-α polymorphisms in case and control groups. PHWE values were obtained by the chi-squared test.
Data extraction and quality assessment
The authors extracted independently the following information: First author, publication year, country, ethnicity, number of cases/controls, source of controls, age (mean value), genotyping assay, gender (male %), SNP, genotype frequencies, disease type, χ2 and PHWE values in control group. Newcastle-Ottawa Scale (NOS) system (http://www.ohri.ca/programs/clinical_epidemiology/oxford.asp) was used to assess the quality of the included studies; NOS score ≥7 indicates a high quality study.
Statistical analyses
Mantel-Haenszel statistics was used to estimate the values of pooled odd radios (ORs) and 95 % confidence intervals (CIs); Passociation value less than 0.05 was considered statistically significant. Six genetic models, including allele, homozygote, heterozygote, dominant recessive, or carrier models were used. Cochran Q statistic and I2 test were carried out to assess the potential heterogeneities between studies. When Pheterogeneity value of Cochran Q statistic > 0.05 or I2 value <50 %, the fixed-effect model was used. Otherwise, random-effect model was applied. To investigate the potential sources of heterogeneity, sensitivity analyses and subgroup analyses based on SCC disease type, ethnicity or source of controls were performed. Begg’s test with pseudo 95 % confidence limits and Egger’s test were also conducted to evaluate the potential publication bias. Stata/SE 12.0 (College Station, TX, USA) software was used for all statistical analyses.
Authors’ contributions
This study was conceptualized and designed by Ning Liu. Ning Liu, Guang-Jing Liu and Juan Liu extracted and analyzed the data. The manuscript was written by Ning Liu. All authors approved the final manuscript.
CONFLICTS OF INTEREST
The authors have declared that no conflicts of interest exists.
REFERENCES
1. Gupta R, Sharma SC, Das SN. Association of TNF-alpha and TNFR1 promoters and 3' UTR region of TNFR2 gene polymorphisms with genetic susceptibility to tobacco-related oral carcinoma in Asian Indians. Oral oncology. 2008; 44:455-463.
2. Qidwai T, Khan F. Tumour necrosis factor gene polymorphism and disease prevalence. Scand J Immunol. 2011; 74:522-547.
3. Oeckinghaus A, Hayden MS, Ghosh S. Crosstalk in NF-kappaB signaling pathways. Nature immunology. 2011; 12:695-708.
4. Cawthorn WP, Sethi JK. TNF-alpha and adipocyte biology. FEBS Lett. 2008; 582:117-131.
5. Umar M, Upadhyay R, Kumar S, Ghoshal UC, Mittal B. Association of common polymorphisms in TNFA, NFkB1 and NFKBIA with risk and prognosis of esophageal squamous cell carcinoma. PLoS One. 2013; 8:e81999.
6. Cui XB, Wang DD, Zhang HY, Li TT, Jin TT, Peng H, Zhang SM, Wang B, Yu J, Liu CX, Yang L, Jin J, Li S, et al. Tumor necrosis factor-alpha gene 308G/A polymorphism is not associated with esophageal squamous cell carcinoma risk in Kazakh patients. International journal of clinical and experimental pathology. 2015; 8:9293-9299.
7. Liu CJ, Wong YK, Chang KW, Chang HC, Liu HF, Lee YJ. Tumor necrosis factor-alpha promoter polymorphism is associated with susceptibility to oral squamous cell carcinoma. Journal of oral pathology & medicine. 2005; 34:608-612.
8. Singh PK, Bogra J, Chandra G, Ahmad MK, Gupta R, Kumar V, Jain A, Ali Mahdi A. Association of TNF-alpha (-238 and -308) promoter polymorphisms with susceptibility of oral squamous cell carcinoma in North Indian population. Cancer biomarkers. 2015; 15:125-131.
9. Seifart C, Plagens A, Dempfle A, Clostermann U, Vogelmeier C, von Wichert P, Seifart U. TNF-alpha, TNF-beta, IL-6, and IL-10 polymorphisms in patients with lung cancer. Disease markers. 2005; 21:157-165.
10. Moan J, Grigalavicius M, Baturaite Z, Dahlback A, Juzeniene A. The relationship between UV exposure and incidence of skin cancer. Photodermatology, photoimmunology & photomedicine. 2015; 31:26-35.
11. Rizzato C, Canzian F, Rudnai P, Gurzau E, Stein A, Koppova K, Hemminki K, Kumar R, Campa D. Interaction between functional polymorphic variants in cytokine genes, established risk factors and susceptibility to basal cell carcinoma of skin. Carcinogenesis. 2011; 32:1849-1854.
12. Sobjanek M, Zablotna M, Michajlowski I, Nedoszytko B, Lesiak A, Nowicki R. -308 G/A TNF-alpha gene polymorphism influences the course of basal cell carcinoma in a Polish population. Archives of medical science. 2015; 11:599-604.
13. Skov L, Allen MH, Bang B, Francis D, Barker JN, Baadsgaard O. Basal cell carcinoma is associated with high TNF-alpha release but nor with TNF-alpha polymorphism at position--308. Experimental dermatology. 2003; 12:772-776.
14. Flego V, Badovinac AR, Bulat-Kardum L, Matanic D, Crnic-Martinovic M, Kapovic M, Ristic S. Primary lung cancer and TNF-alpha gene polymorphisms: A case-control study in a Croatian population. Medical Science Monitor. 2009; 15:CR361-CR365.
15. Gu F, Qureshi AA, Kraft P, Guo Q, Hunter DJ, Han J. Polymorphisms in genes involved in DNA repair, cell growth, oxidative stress and inflammatory response, and melanoma risk. The British journal of dermatology. 2009; 161:209-212.
16. Welsh MM, Karagas MR, Kuriger JK, Houseman A, Spencer SK, Perry AE, Nelson HH. Genetic determinants of UV-susceptibility in non-melanoma skin cancer. PLoS One. 2011; 6:e20019.
17. Kostic M, Nikolic N, Ilic B, Jelovac D, Trakilovic S, Bozovic M, Milasin J. Association of TNF-R2 (676T > G) single nucleotide polymorphism with head and neck cancer risk in the Serbian population. Archives of Biological Sciences. 2013; 65:387-393.
18. Whiteman DC, Parmar P, Fahey P, Moore SP, Stark M, Zhao ZZ, Montgomery GW, Green AC, Hayward NK, Webb PM. Association of Helicobacter pylori Infection With Reduced Risk for Esophageal Cancer Is Independent of Environmental and Genetic Modifiers. Gastroenterology. 2010; 139:73-83.
19. Huang YZ, Huang Y, Luo M, Huang TS. The study on the association between lung squamous cell carcinoma and Tumor necrosis factor-α polymorphism. Chinese journal of pathology. 2005; 85:1064-1065.
20. Shih CM, Lee YL, Chiou HL, Chen W, Chang GC, Chou MC, Lin LY. Association of TNF-alpha polymorphism with susceptibility to and severity of non-small cell lung cancer. Lung cancer (Amsterdam, Netherlands). 2006; 52:15-20.
21. Yang CM, Hou YY, Chiu YT, Chen HC, Chu ST, Chi CC, Hsiao M, Lee CY, Hsieh CJ, Lin YC, Hsieh YD, Ger LP. Interaction between tumour necrosis factor-alpha gene polymorphisms and substance use on risk of betel quid-related oral and pharyngeal squamous cell carcinoma in Taiwan. Archives of oral biology. 2011; 56:1162-1169.
22. Zhang LL, Liu YP, Du K, Wang H, Liu SZ, Wang XL. Association between 308 G/A tumor necrosis factor alpha gene polymorphism and prognosis of esophageal squamous cell carcinoma. Chinese journal of pathology. 2011; 40:44-45.
23. Oh SS, Chang SC, Cai L, Cordon-Cardo C, Ding BG, Greenland S, He N, Jiang Q, Kheifets L, Le A, Lee YC, Liu S, Lu ML, et al. Single nucleotide polymorphisms of 8 inflammation-related genes and their associations with smoking-related cancers. International journal of cancer. 2010; 127:2169-2182.
24. Kietthubthew S, Wickliffe J, Sriplung H, Ishida T, Chonmaitree T, Au WW. Association of polymorphisms in proinflammatory cytokine genes with the development of oral cancer in Southern Thailand. Int J Hyg Environ Health. 2010; 213:146-152.
25. Wang J, Jin X, Wang H, Yang J, Wang L, Lei L, Li X, Zhou Y, Zeng X, Jiang L, Liao G, Dan H, Chen Q. The -308G/A polymorphism of the tumor necrosis factor-alpha gene is associated with the risk of upper aerodigestive tract cancer: a meta-analysis. The Tohoku journal of experimental medicine. 2013; 229:245-254.
26. Gao X, Ma L, Sun H, Jian X. Association between two common polymorphisms of TNF-α gene (-308 and -238) and the risk of head and neck carcinomas based on case-control studies. International journal of clinical and experimental medicine. 2016; 9:2738-2747.
27. Chen FC, Zhang F, Zhang ZJ, Meng SY, Wang Y, Xiang XR, Wang C, Tang YY. Tumor Necrosis Factor-alpha Gene Polymorphisms and Risk of Oral Cancer: Evidence from a Meta-analysis. Asian Pacific Journal of Cancer Prevention. 2013; 14:7243-7249.
28. Yapijakis C, Serefoglou Z, Vylliotis A, Nkenke E, Derka S, Vassiliou S, Avgoustidis D, Neukam FW, Patsouris E, Vairaktaris E. Association of polymorphisms in Tumor Necrosis Factor Alpha and Beta genes with increased risk for oral cancer. Anticancer Res. 2009; 29:2379-2386.
29. Jin L, Sturgis EM, Zhang Y, Huang Z, Song X, Li C, Wei Q, Li G. Association of tumor necrosis factor-alpha promoter variants with risk of HPV-associated oral squamous cell carcinoma. Molecular cancer. 2013; 12:80.
30. Luo M, Yang Y, Luo D, Liu L, Zhang Y, Xiao F, Yang J, Zhang C, Fu S, Luo Z. Tumor necrosis factor-alpha promoter polymorphism 308 G/A is not significantly associated with esophageal cancer risk: a meta-analysis. Oncotarget. 2016; 7:79901-79913. doi: 10.18632/oncotarget.13093.
31. Jang WH, Yang YI, Yea SS, Lee YJ, Chun JH, Kim HI, Kim MS, Paik KH. The -238 tumor necrosis factor-alpha promoter polymorphism is associated with decreased susceptibility to cancers. Cancer Lett. 2001; 166:41-46.
32. Zhou P, Lv GQ, Wang JZ, Li CW, Du LF, Zhang C, Li JP. The TNF-alpha-238 polymorphism and cancer risk: a meta-analysis. PLoS One. 2011; 6:e22092.
33. Nan H, Xu M, Kraft P, Qureshi AA, Chen C, Guo Q, Hu FB, Curhan G, Amos CI, Wang LE, Lee JE, Wei Q, Hunter DJ, Han J. Genome-wide association study identifies novel alleles associated with risk of cutaneous basal cell carcinoma and squamous cell carcinoma. Human molecular genetics. 2011; 20:3718-3724.
34. Howell WM, Turner SJ, Collins A, Bateman AC, Theaker JM. Influence of TNFalpha and LTalpha single nucleotide polymorphisms on susceptibility to and prognosis in cutaneous malignant melanoma in the British population. European journal of immunogenetics. 2002; 29:17-23.
35. Wang X, Lin Y. Tumor necrosis factor and cancer, buddies or foes? Acta pharmacologica Sinica. 2008; 29:1275-1288.
36. Li HH, Zhu H, Liu LS, Huang Y, Guo J, Li J, Sun XP, Chang CX, Wang ZH, Zhai K. Tumour Necrosis Factor-α Gene Polymorphism Is Associated with Metastasis in Patients with Triple Negative Breast Cancer. Scientific reports. 2015; 5:10244.
37. Szlosarek P, Charles KA, Balkwill FR. Tumour necrosis factor-alpha as a tumour promoter. European journal of cancer (Oxford, England : 1990). 2006; 42:745-750.
38. van Horssen R, Ten Hagen TL, Eggermont AM. TNF-alpha in cancer treatment: molecular insights, antitumor effects, and clinical utility. The oncologist. 2006; 11:397-408.
39. Kroeger KM, Carville KS, Abraham LJ. The -308 tumor necrosis factor-alpha promoter polymorphism effects transcription. Mol Immunol. 1997; 34:391-399.
40. Wilson AG, Symons JA, McDowell TL, McDevitt HO, Duff GW. Effects of a polymorphism in the human tumor necrosis factor alpha promoter on transcriptional activation. Proc Natl Acad Sci U S A. 1997; 94:3195-3199.
41. Zabaglia LM, Ferraz MA, Pereira WN, Orcini WA, de Labio RW, Neto AC, Wisnieski F, de Oliveira JG, de Arruda Cardoso Smith M, Payao SL, Rasmussen LT. Lack of association among TNF-alpha gene expression, -308 polymorphism (G > A) and virulence markers of Helicobacter pylori. The journal of venomous animals and toxins including tropical diseases. 2015; 21:54.
42. de Oliveira JG, Rossi AF, Nizato DM, Cadamuro AC, Jorge YC, Valsechi MC, Venancio LP, Rahal P, Pavarino EC, Goloni-Bertollo EM, Silva AE. Influence of functional polymorphisms in TNF-alpha, IL-8, and IL-10 cytokine genes on mRNA expression levels and risk of gastric cancer. Tumour biology. 2015; 36:9159-9170.
43. Wu X, Wu MY, Jiang M, Zhi Q, Bian X, Xu MD, Gong FR, Hou J, Tao M, Shou LM, Duan W, Chen K, Shen M, Li W. TNF-alpha sensitizes chemotherapy and radiotherapy against breast cancer cells. Cancer cell international. 2017; 17:13.
44. Moher D, Liberati A, Tetzlaff J, Altman DG. Preferred reporting items for systematic reviews and meta-analyses: the PRISMA statement. PLoS medicine. 2009; 6:e1000097.