
INTRODUCTION
A unique set of rules has evolved to control the potential constant stimulation of the intestinal immune system that could arise from the intestinal microbiota. This in part takes the form of a conversation between the epithelial cells of the intestinal mucosa and the gut microbiota that keeps inflammation in check and plays a fundamental role in maintaining intestinal mucosal homeostasis.
A key component modulating the conversation between the mucosa and the vast population of bacteria that inhabit the large intestine is the thick mucus layer that provides a physical separation between the epithelial cell monolayer and the luminal contents. This mucus layer also provides a chemical and biochemical barrier that supports the structure of the mucus gel, as well as the ability of the gel to concentrate biological factors secreted by mucosal epithelial cells (reviewed in [1]). Mucus is also a source of nutrients for the intestinal microbiota, underscoring a complex role of the mucus layer. In addition, in the small intestine, the mucus, and goblet cells, which secrete the mucin MUC2, have an active role in regulating mucosal immunity [2, 3]. Thus, compromising the integrity of the mucus barrier has profound effects on the functioning and homeostasis of the intestinal mucosa.
We reported that targeted inactivation of the Muc2 gene in the mouse, which encodes the major intestinal mucin MUC2, eliminates the mucus barrier resulting in physical contact between intestinal bacteria and the mucosa. This generates a chronic, low-level inflammatory response, and eventual tumor development throughout the small and large intestine, and the rectum [4]. The importance of this subtle inflammatory response in Muc2−/− mice was also evident from exacerbation of the tumor phenotype in double mutant Muc2−/−; Apc1638N/+ or Muc2−/−; ApcMin/+ mice [5]. Muc2 deficiency not only accelerated the kinetics of tumor formation and increased tumor number initiated by loss of Apc function, but also shifted tumor location, with an increased tumor load in the colon. Importantly, these effects were Muc2 dosage dependent, as Muc2 haploinsufficiency caused similar, but more modest, changes. The tumor phenotype of the double mutant Muc2/Apc mice recapitulated the phenotype of Apc mutant mice challenged to mount an inflammatory response [6, 7], strongly suggesting that the inflammatory stimulus due to loss of the mucus barrier was a key event in exacerbating initiation of tumor development caused by loss of Apc function.
Because the mucus barrier plays such a fundamental role in intestinal functions and homeostasis, it is likely that absence of the barrier profoundly alters homeostasis in the intestinal mucosa. In this study, we used gene expression profiling of both isolated epithelial cells of the intestinal mucosa, as well as of mucosal tissue that contains epithelial as well as non-epithelial cells, to determine extent and nature of the perturbations of the mucosa in Muc2−/− compared to wild-type mice. The expression data and follow-up experiments demonstrated two major classes of alteration in Muc2−/− mucosa: first, altered immune cell functions and DNA repair as a sequela to damage of the mucosa; second, decreased ability of intestinal cells to absorb, process and secrete lipids back into circulation, and an impairment of IECs in catabolizing fatty acids, coupled with an increase in the ability of epithelial cells to take up glucose and alterations in its utilization.
RESULTS
To dissect alterations in the intestine of Muc2−/− mice, we compared the expression profile of isolated intestinal epithelial cells (IECs) from 3 month old Muc2−/− and control Muc2+/+ mice. We also compared the expression profile of the entire mucosal cell population of Muc2−/− and Muc2+/+ mice, which includes intestinal epithelial cells as well as stromal and immune cells. We focused on the duodenal cell population, the site displaying the highest frequency of tumor development, as we reported earlier [4].
We first identified changes that satisfied 2 criteria: a magnitude of difference > 1.5 fold coupled with a p value of ≤ 0.05 (Student’s t-test). Of 260 sequences meeting these criteria in the total heterogeneous cell population of the Muc2−/− intestinal mucosa, 162 were also detected among the changes in the purified epithelial cells. Thus, approximately 100 sequences most likely represent alterations in the stroma and immune cell compartment.
Bioinformatic analysis of these data (IPA, Ingenuity System Software) identified 15 different biological functions enriched in the altered expression profile of the Muc2−/− stromal cell population (Figure 1A). However, these changes could be aligned to only 5 discrete pathways (Figure 1B). It is notable that for these 5 pathways, the number of genes which showed detectable alterations in expression was limited to 5–10% of the genes in each pathway, indicating a specific response of the mucosa to the loss of the mucus barrier (Figure 1B).
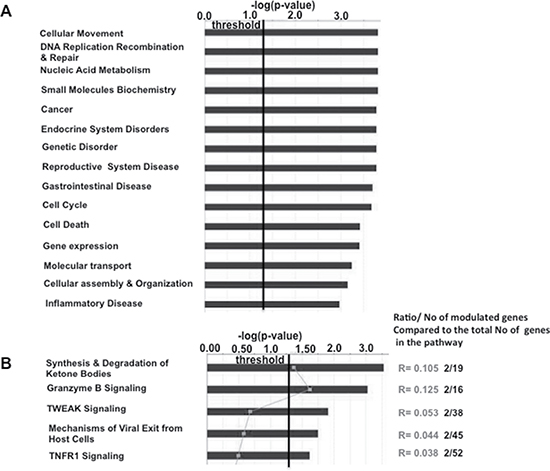
Figure 1: Modest alterations are detected in the intestinal non- epithelial cell compartment of Muc2−/− mice. Ingenuity pathway analysis (IPA) was used to identified gene expression changes that affect biological functions (A), and specific cellular pathways (B).
The altered biological functions identified in the Muc2−/− intestine involved genes associated with cell movement (Figure 1A), including several genes responsible for migration of immune cells. Specifically, this included genes involved in chemotaxis and migration of neutrophils and macrophages, exemplified by upregulation of C-C motif chemokine ligand 8 (CCl8), Serum amyloid A1 (Saa1), Neuromedin U (Nmu), and Endothelin 3 (Edn3). These data, along with upregulation of Stomatin, a component of neutrophil granules and phagosomes, prompted investigation of whether there was an increase in phagocytes in the intestine of Muc2 mice. Phagocytes respond to stimuli with an oxidative burst characterized by ROS production, which can be visualized as an insoluble brown precipitate formed by oxidized and polymerized DAB in the presence of endogenously produced H2O2 and activated peroxidase [8]. As shown in Figure 2, there were many more DAB positive cells in the small intestine (compare 2A to 2B) of the Muc2−/− mouse. In H&E stained serial sections, these cells were identified as PMNs (data not shown). Loss of DAB staining by the addition of catalase to the incubation buffer, an enzyme that metabolizes H2O2, demonstrated specificity of the reaction (Figure 2C). These data were confirmed by fluorescent detection of ROS producing cells using an oxidized DCF probe in the small intestine: Supplementary Figure 1 shows increased number of DCF positive – ie, green fluorescent-cells - in the stroma surrounding the crypts of Muc2−/− small intestine (S1B) compared to wild-type mice (S1A). Importantly, quantitative analysis of DAB+ cells (Figure 3) demonstrated that DAB+ cells were similarly represented in the intravillus stromal compartment of Muc2−/− and wild-type mice (Figure 3A), with a significant increase in the number of DAB+ cells in the pericrypt stroma (Figure 3B) of the duodenum of Muc2−/− mice.
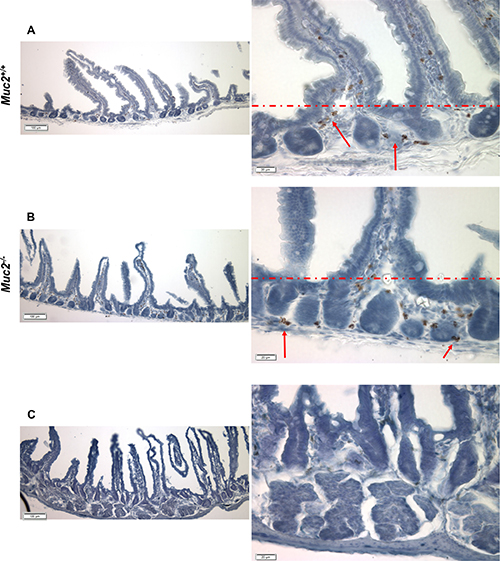
Figure 2: Detection of ROS producing cells in the stromal compartment of Muc2+/+ and Muc2−/− mice. (A–C) show representative micrographs of frozen sections of flat mucosa of small intestine from 3 month old Muc2+/+(A) and Muc2−/− (B) mice, respectively, incubated in vitro with DAB, as described in Material and Methods. Red arrows indicate cell positivity due to DAB polymerization in the presence of cell-generated H2O2. (C) shows loss of signal, and thus specificity of the reaction, upon addition of catalase to the reaction buffer. The red dotted line separates the intravillus area from the pericrypt area. Magnification bars are shown.
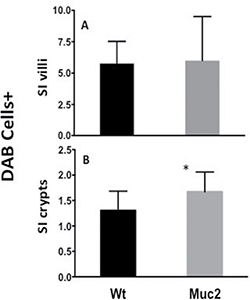
Figure 3: Increased number of ROS positive cells in Muc2−/− mice. Quantification of ROS producing cells in sections from Muc2+/+ and Muc2−/− mice. The number of DAB+ cells was determined in tissue sections incubated with DAB, as shown in Figure 2: (A) in the intravillus stroma; (B) in the stroma surrounding the crypts of the small intestine (SI) of 3 month old mice of the indicated genotypes. A minimum of 100 villi/crypts in well oriented sections were analyzed/ mouse, 3 mice/ genotype. (error bars, s.d.; Student’s t test, *p < 0.05)
To determine whether the increased ROS contribute to DNA damage in IECs, the accumulation of γH2AX, a marker of DNA damage, was determined in IECs from the small intestine. As shown in Figure 4A–4B, and quantified in Supplementary Figure 2, there was a distinct increased number of γH2AX positive IECs, that also showed greater staining intensity, in the small intestine of Muc2−/− (S2B) compared to wild-type mice (S2A). Further, γH2AX positive cells were localized in the crypts, where the increased number of ROS positive phagocytes was detected (Figures 2 and 3). Further, IECs may also be an additional source of ROS in response to increased exposure to the intestinal bacteria, as we previously reported in the intestine of the Muc2 mouse [9]. Indeed, Figure 5 shows elevated expression of NAPDH oxidase 1 (Nox1) and Dual oxidase 2 (Duox2), ROS generating enzymes that are modulated in response to bacteria [10–13], as determined by RTqPCR. Of note, the expression of these two genes was not significantly changed in the array results. These data suggest that elevated ROS production by the infiltrating phagocytes, and IECs, promote genomic instability in epithelial cells, a potential driver of tumor development, either directly and/or by altering the microenvironment. However, it cannot be ruled out that the increased number of γH2AX positive cells in mutant mice may be linked to the hyperproliferation documented in Muc2−/− crypts [4].
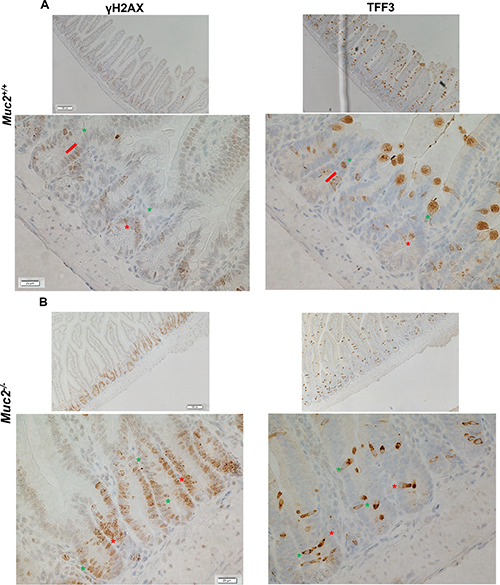
Figure 4: Increased number of γH2AX positive cells in Muc2−/− crypts. Immunohistochemical detection of γH2AX (left column), a marker for DNA damage, and TFF3 (right column), a marker of goblet cells in serial sections of SI from 3 month old mice of the indicated phenotypes, (A) and (B) for Muc2+/+ and Muc2−/−, respectively. In A and B red lines and asterisks identify γH2AX-positive goblet cells, expressing TFF3. Green asterisks pinpoint at γH2AX-positive cells that do not express TFF3.
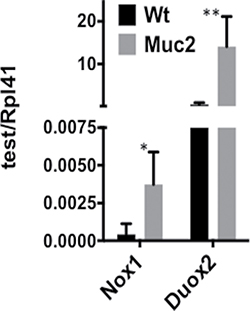
Figure 5: Elevated expression of genes encoding ROS generating enzymes in Muc2−/− IECs. qRT-PCR was used to determine the levels of mRNAs for Nox1, a NADPH oxidase subunit at the cell membrane, and Duox2, a dual oxidase in SI-IECs from WT and Muc2−/− mice.
It was recently reported that ROS are required for goblet cell functions, including mucin secretion [14]. Therefore, we ascertained whether γH2AX localized preferentially to goblet cells in the crypts of Muc2−/− mice. Serial sections were stained for γH2AX and TFF3, the latter a goblet specific marker that we showed is equivalently expressed in WT and Muc2−/− intestine [4], and serves as a surrogate marker for goblet cells when they are devoid of MUC2. Figure 4A and 4B (left panel γH2AX, right panel TFF3, respectively), show that the great majority of γH2AX positive cells in WT and Muc2−/− crypts of the small intestine were not goblet cells by the criteria of absence of TFF3 expression.
Muc2, the fundamental component of the mucus barrier, is expressed and secreted by goblet cells in both the small and large intestine. Not surprisingly, the inactivation of the Muc2 gene leads to the absence of recognizable goblet cells whose distinctive morphology is due to the storage of mucin [4]. The histological changes in the mucosa of Muc2 mice extend beyond this, however, to a general narrowing of crypt-villus architecture coupled with an acceleration of cell migration along the crypt-luminal axis [4]. Consistent with these perturbations in structure, there were also robust changes in gene expression in purified epithelial cells of the mucosa. This was analyzed utilizing the IPA Ingenuity system applied again to sequences that were altered ≥ 1.5 fold in expression coupled with a p ≤ 0.05 in isolated IECs of the Muc2−/− compared to wild-type mice. The most altered biological networks were linked to drug and lipid metabolism, small molecule biochemistry, and molecular transport (data not shown), in addition to other metabolic processes altered in the intestine of Muc2−/− mice relative to wild-type mice. This is particularly relevant, as recent studies have identified the gut microbiota, and their combined genetic potential, the microbiome, as an important environmental determinant in influencing host energy metabolism [15].
There were 36 canonical pathways that were significantly modulated. The most prominently modulated, both by fold change and p value, were xenobiotic and fatty acid metabolism (Figure 6A). The merger of the top 2 networks pinpoints major changes in several aspects of lipid metabolism, and identifies PPARa as a potential common regulator of those processes (Figure 6B).
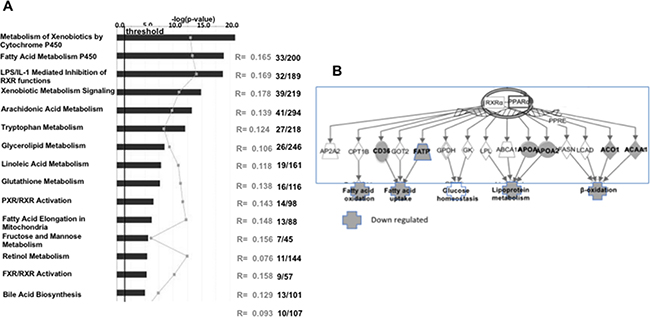
Figure 6: Major alterations are detected in SI-IECs of Muc2−/− mice: PPARα downregulation characterizes altered lipid metabolism in Muc2−/− IECs. Ingenuity pathway analysis (IPA) was used to identified gene expression changes that affect specific cellular pathways (A). In (B), IPA bioinformatics was used for the merger of the top 2 networks. The analysis confirms major changes in several aspects of lipid metabolism, and identifies PPARa as a prominent regulator of these processes. Symbols in grey indicate genes, and affected pathways, that are downregulated in Muc2−/− IECs.
Alterations of lipid, and specifically fatty acid metabolism, can be broadly subdivided into two main categories: those affecting the uptake and distribution of fatty acids in the organism, and those altering their utilization by intestinal epithelial cells. Our previous work had shown that fatty acid binding proteins (Fabps), facilitating the transport of fatty acids to the ER, were down-regulated in Muc2−/− IECs [5]. We now extend these observations and show in Table 1 that the expression of genes involved in sequential steps of lipid metabolism and associated functions was significantly decreased in the array data. qRT-PCR validation confirmed that this process was severely perturbed in Muc2−/− IECs: among the down-regulated genes were those encoding fatty acid transporters CD36 and Solute carrier family 27 member 4/Fatty acid transporter protein 4 (Scl27a4/Fatp4), the ER associated enzymes Diacylglycerol O-Acyltransferase 2 (Dgat2) and Microsomal Triglyceride Transfer Protein (Mttp), and those encoding mediators of the final assembly of chylomicrons, including Apolipoprotein B (ApoB), ApoAIV, ApoA1 and ApocII (Figure 7A).
Table 1: Genes involved in fatty acid metabolism
Log2 |
Direct targets |
||||
|---|---|---|---|---|---|
UniGene |
Gene Symbol |
Differences |
t Test |
Ppar-α* |
Function |
Mm.330113 |
Slc27a4/Fatp4 |
−1.2597 |
0.0454 |
Fatty Acid uptake and |
|
Mm.18628 |
CD36 |
−2.4442 |
0.0063 |
√ |
|
Mm.2941 |
Mttp |
−0.9460 |
0.0036 |
√ |
|
Mm.208030 |
Mogat2 |
−0.8522 |
0.0219 |
||
Mm.22633 |
Dgat1 |
−0.7512 |
0.0633 |
√ |
|
Mm.477728 |
Dgat2 |
−1.5784 |
0.0010 |
||
Mm.4533 |
Apoa4 |
−1.8770 |
0.0139 |
√ |
|
Mm.26743 |
Apoa1 |
−0.9414 |
2.18E-05 |
√ |
|
Mm.221239 |
Apob |
−1.2659 |
0.0342 |
||
Mm.477720 |
Apoc2 |
−1.6412 |
0.0047 |
||
Fatty Acid Degradation |
|||||
Mm.260164 |
Hadh |
−0.5912 |
0.0208 |
√ |
Mitochondria β-oxidation |
Mm.379011 |
Scp2 |
−0.8594 |
0.0003 |
Mitochondria β-oxidation |
|
Mm.210323 |
Acsl1 |
−0.7173 |
0.0429 |
√ |
Mitochondria β-oxidation |
Mm.245724 |
Acaa2 |
−0.7438 |
0.0095 |
√ |
Mitochondria β-oxidation |
Mm.292056 |
Acsl5 |
−1.0342 |
0.0145 |
√ |
Fatty_Acid_Degradation |
Mm.20396 |
Crat |
−0.8403 |
0.0004 |
√ |
Fatty_Acid_Degradation |
Mm.246682 |
Gyk |
−1.2075 |
0.0082 |
√ |
Fatty_Acid_Degradation |
Mm.42253 |
Slc22a5/Octn2 |
−0.8247 |
0.0138 |
√ |
carnitine uptake |
Mm.399042 |
Abcd3 |
−0.7621 |
0.0275 |
VLFA/peroxisomal β-oxidation |
|
Mm.290044 |
Slc27a2/Fatp2 |
−1.1491 |
0.0672 |
√ |
peroxisomal β-oxidation |
Mm.205266 |
Acaa1a /1b |
−0.9283 |
0.0014 |
peroxisomal β-oxidation |
|
Mm.475660 |
Acot4 |
−1.5366 |
0.0063 |
peroxisomal β-oxidation |
|
Mm.439978 |
Cyp4a10//Cyp4a31 |
−3.1568 |
0.0005 |
√ |
ω-oxidation |
Mm.1840 |
Cyp4b1 |
−1.9094 |
0.0163 |
ω-oxidation |
|
Mm.30504 |
Cyp4f16 |
−0.9681 |
0.0005 |
ω-oxidation |
|
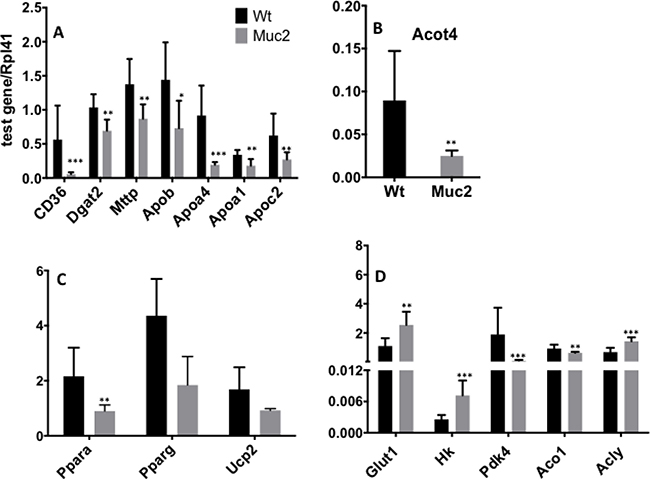
Figure 7: Muc2 deficiency alters the expression of genes associated with lipid metabolism. Validation by quantitative real-time polymerase chain reaction (qRT-PCR) of the levels of mRNAs encoded by each of the indicated genes involved in the regulation of lipid and glucose metabolism. Total RNA was isolated from purified SI-IECs from 3 month old WT and Muc2−/− mice.
In Muc2−/− IECs, perturbation of lipid metabolism also extended to the catabolism of fatty acids (Table 1). There was reduced expression of ATP binding cassette subfamily D3 (Abcd3), encoding a transporter for VLFA in peroxisomes and Fatp2/Slc27a2, a transporter required for activation of fatty acids and subsequent oxidation in peroxisomes, as well as Acyl-CoA Thioestherase 4 (Acot4), confirmed by qRT-PCR in Figure 7B, and Acaa1, the gene encoding 3-ketoacyl-CoA thiolase B which catalyzes the final step of peroxisomal β-oxidation.
As pointed out in Figure 6B, many of the genes that are modulated by Muc2 deficiency and that can affect lipid metabolism converge on the major central node represented by Peroxisome Proliferator Activated Receptor α (Pparα) (Figure 6B), and many are direct targets of Pparα (Table 1) [16, 17]. Figure 7C clearly demonstrates that Pparα expression is indeed significantly repressed in Muc2−/− IECs.
Pparα regulates key classI/II genes that orchestrate the xenobiotic and oxidative stress response. Consistent with this, our prior work documented that both classes of genes were significantly repressed in Muc2 −/− IECs [5]. Further, since there is an inverse relationship between Pparα activation and the down-regulation of genes involved in glucose transport, we investigated whether decreased Pparα expression would be accompanied by increased expression of genes involved in glucose metabolism. Indeed, as shown in Figure 7D, there was significantly increased expression of the genes encoding the glucose transporters Glut1/Slc2a1, as well as of Hk, which encodes the hexokinase that catalyzes glucose phosphorylation, the first step in glycolysis. Altered glucose utilization has also been linked to modulation of glucose utilization via induction of pyruvate dehydrogenase kinase isoform 4 (Pdk4), a Pparα target gene [18]. Accordingly, Pdk4, whose product inhibits pyruvate dehydrogenase, which catalyzes the metabolism of pyruvate to Acetyl-CoA, was down-regulated, implying increased pyruvate utilization for acetyl-CoA production in the mitochondria, and promoting an alternative pathway for de novo lipogenesis [19]. This is characteristic of proliferating cells [20], and we have reported elevated proliferation in the intestine of Muc2−/− mice. In Muc2 IECs, the data document decreased expression of Aconitase 1 (Aco1), and concomitant elevation of Acly, thus, increasing ATP-citrate-lyase (ACL)-dependent production of acetyl-CoA important for the proliferation of tumor cells and lipogenesis [21] (Figure 7D). In addition, the uncouple protein 2 (Ucp2), also a target of Pparα activation and downregulated in proliferating cells [22], is down-modulated in Muc2−/− IECs (Figure 7C), further supporting the interpretation that the Muc2 deficient mucosa is characterized by early metabolic alterations promoting anaplerotic reactions for biosynthetic processes required for proliferation.
The endoplasmic reticulum (ER) is a prominent site for lipid metabolism, alteration of lipid metabolic pathways, and pathways involved in the detoxification and oxidative stress responses. These are all altered in Muc2−/− mice [5], and can induce a stress response in the endoplasmic reticulum termed the “unfolded protein response” (UPR) [23]. Although the Muc2−/− IECs did not exhibit a significant elevation of total X-box binding protein 1 (Xbp1) expression, we observed a prominent increase of the ratio of spliced (active) versus unspliced Xbp1 mRNA in Muc2 IECs (Figure 8A–8C) suggesting that these IECs are under ER stress. Although this altered splicing pattern was not significant, it is consistent with significantly increased levels of Heat Shock Protein family member 5 (grp78/hspa5/BiP), an Xbp1 target, and we confirmed upregulation of Grp78 in the crypts of Muc2 compared to WT mice by immunostaining (Figure 8E). There was also increased expression of Heat Shock Protein (hsp40) family C10 (DnaJc10), a stress response gene that encodes a protein disulfide isomerase (PDI) of the ER as well as DNA Damage Inducible Transcript 3 (Ddit3/Gadd153) that is also involved in DNA damage response (Figure 8D).
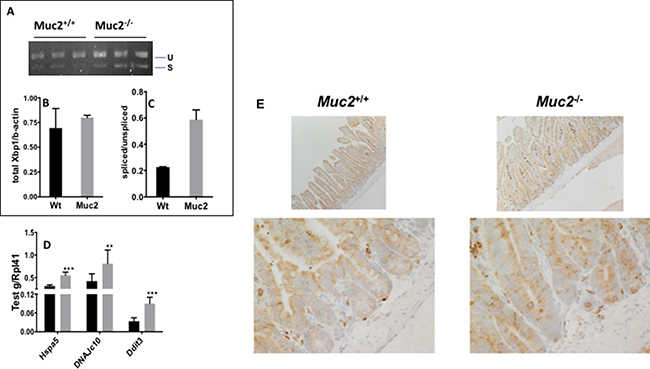
Figure 8: The endoplasmic reticulum (ER) stress response induced in Muc2−/− intestinal epithelial cells. The stress response was investigated in the SI-IECs of Muc2−/− mice by analyzing the relative levels of unspliced Xbp1(u) and spliced Xbp1 (s) mRNA. (A) shows the gel analysis of PCR reactions, detecting unspliced and spliced forms of Xbp1 in purified SI-IECs of mice of the indicated genotypes. (B) and (C) show quantification of the bands in A for total Xbp1 mRNA relative to β-actin (B) and the relative levels of spliced versus unspliced forms of Xbp1 (C). (D) The level of expression of the indicated ER stress responsive genes was determined by qRT-PCR in WT and Muc2−/− SI-IECs. (E) shows immunohistochemical detection of Grp78 in the small intestine of WT and Muc2 −/− mice.
Given the interplay between ROS, ER stress response, and goblet cell functions, we pursued whether the increased Grp78 expression was targeted to goblet cells. Immunohistochemical staining for Grp78 and TFF3 was done on serial sections. Figure 9A and 9B show that in Muc2−/− crypts there were occasional goblet cells, identified by positivity for TFF3, also positive for Grp78, yet the great majority of goblet cells were negative for Grp78 both in Muc2 and WT crypts. However, we observed that the fraction of Grp78 positive Paneth cells was greater in Muc2 compared to WT mice, in the absence of changes in the absolute number of Paneth cells in mutant and WT mice [4, 5]. These data are consistent with the increased expression of Paneth cell-specific peptides with bacteriocidal and bacteriostatic activity that we and others have previously reported in Muc2−/− mice [5, 24, 25]
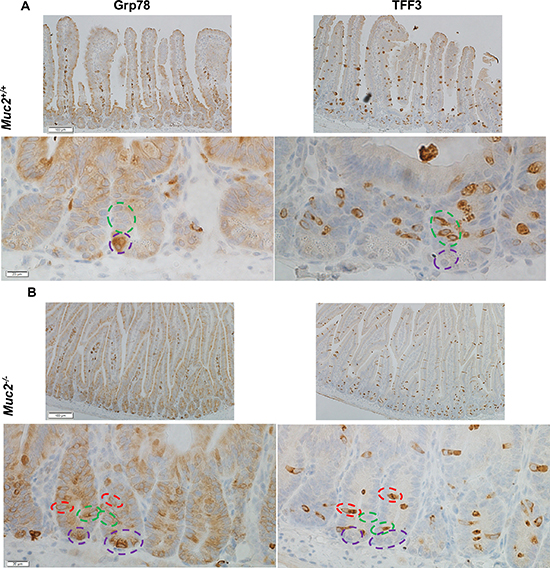
Figure 9: The expression of Grp78 does not preferentially localize to goblet cells. Immunohistochemical detection of Grp78, a marker of the ER stress response, left panels, and TFF3, a goblet cell specific marker, right panel, in serial sections of SI of 3 month old mice of the indicated genotype (A, WT, and B, Muc2). Green dotted circles indicate goblet cells positive for TFF3, but negative for Grp78. Purple dotted circles identify Grp78 positive Paneth cells.
DISCUSSION
Expression profiling of both isolated epithelial cells and total cells of the intestinal mucosa of Muc2−/− mice demonstrated that elimination of the mucus barrier generates significant functional shifts of the intestinal mucosa. These changes encompass alterations in immune cells due to the impact of MUC2 in modulating immune stimulation. This results in a low-level chronic inflammatory response that we documented in the intestine [5]. In addition, we show here that in the intestinal epithelial cells there are major changes in pathways of intermediary metabolism, encompassing altered lipid metabolism, increased utilization of glucose, and ER stress reflected in an unfolded protein response.
These changes are all likely linked to the function of Muc2 as the major component of the mucus barrier, which, when compromised, can alter the intestinal microbiota and the interactions of these bacteria with the mucosa. This is further complicated by the qualitative and quantitative alterations in the composition of the microbiota of Muc2−/− mice [24]. This complex interaction with the microbiota in Muc2−/− mice is also demonstrated by the rapid death of the mice upon treatment with antibiotic, while in contrast, Muc2+/+ mice tolerate antibiotic treatment very well (not shown). Alterations of microbiota-epithelial cell interactions are indeed indicated by the data here showing that there is increased number of ROS producing phagocytes in the stroma surrounding intestinal crypts, and upregulation of ROS producing enzymes expressed by IECs contributing to altered homeostasis. Increased ROS production in Muc2−/− intestine is indicative of the pathophysiology of the Muc2−/− mouse intestine. ROS can exert either negative or positive effects on histopathology depending on the intensity and duration of the oxidative insult. The negative effects of ROS are evident in the link between chronic inflammation, ROS production and cancer. It has been postulated that increased genomic mutation rate is mechanistically linked to tumor development associated with inflammation, which generates oxidative stress [26, 27]. In contrast, ROS, in particular H2O2, can also be beneficial through induction of repair processes [28, 29]. Further, in the intestine, commensal bacteria, specifically Lactobacilli that are elevated in the intestine of Muc2−/− mice [24], promote ROS production by Nox1 in enterocytes and modulate epithelial cell proliferation and migration [10, 11], processes that we have previously documented to be increased in the flat mucosa of the Muc2−/− mice [4], and further supported by the upregulation of Nox1 and Duox, an additional oxidase involved in antibacterial responses [12, 13], in Muc2−/− IECs (Figure 5). Thus, although there is a modest increase of ROS generating phagocytes, this increased ROS production in the Muc2−/− intestine may be part of the adaptive stress/repair response to increased damage/challenge due to the altered interaction between the IECs and the environment (eg. the gut bacteria) to control tissue homeostasis. However, when this stress response persists, it results in chronic, low level inflammation, also termed para-inflammation, that can drive tumorigenesis [30]. It is of note that these data are also consistent with the phenotype of double mutant Muc2−/−; Apc1638/N mice in which we demonstrated that there was a shift of tumor burden towards the colon, where we have also documented increased ROS producing phagocyte infiltration (Supplementary Figure 3); the phenotype of the double mutant Muc2/Apc mouse is reminiscent of the shift in tumor location observed in the Apc mutant mice challenged to mount of an inflammatory response. In addition, a large proportion of tumors in Muc2−/−Apc1638/N mice were characterized by mutational inactivation of the wild type Apc allele, in contrast to the loss of heterozygosity which is the most common mechanism of inactivation of the WT Apc allele in tumors of Apc1638/N mice in which the mucus barrier is intact [5].
We have documented alterations of lipid metabolism pathways in IECs of the normal appearing mucosa of the Muc2−/− mouse. In some instances these changes (i.e. Acot1 and Acly1) are modest though statistically significant; it can be inferred that they translate into shifted metabolic pathways consistent with the increased proliferation in Muc2 mice. Interestingly similar alterations involving lipid adsorption, processing and chylomicron release have been documented in the intestinal epithelium of mice with enterocyte specific inactivation of the retinoblastoma protein (RB) [31], resulting in enhanced crypt cell proliferation. In the absence of clear pathology, the alterations of lipid metabolism may be linked to an expansion of the proliferative capacity of IECs in response to damage signals, as in the case of low level chronic inflammation in Muc2−/− mice, or intrinsic signals in response to alterations of the Rb pathway. Interestingly, data generated using individual metabolic chambers to measure food intake, locomotor activity, oxygen consumption, and body temperature, accurately and with high temporal resolution, in several individual WT and Muc2−/− mice, showed that the altered expression of lipid metabolism genes was not accompanied by variations in body composition or rate of metabolism (data not shown). These results are similar to the reported absence of variations in body composition and rate of metabolism in comparing Rb deficient and WT mice. In this context, it is notable that alterations of fatty acid metabolism are documented in IBD [32]. Thus, in response to chronic damage intestinal epithelial cells may switch to a metabolic state characterized by altered lipid and enhanced glycolytic metabolism associated with increased proliferation. In agreement, analysis of the expression profile of IECs along the crypt-villus axis in wild type Black6 mice [33] shows that the decreased expression of genes involved in lipid metabolism that characterize the IECs of Muc2−/− mice recapitulates the normal developmental pattern of expression along the crypt/villus axis (Table 2), consistent with the hypothesis that decreased lipid metabolism characterizes cells of the crypt proliferative compartment.
Table 2: Modulation of genes of Fatty Acid metabolism along the crypt/villus axis
Gene Symbol |
Muc2/Wt |
F10/F1 |
t Test |
|---|---|---|---|
Differences log2 |
|||
Slc27a4/Fatp4 |
−1.2597 |
−2.5085 |
0.0000 |
CD36 |
−2.4442 |
−1.5082 |
0.0209 |
Mttp |
−0.9460 |
−1.2746 |
0.0001 |
Mogat2 |
−0.8522 |
||
Dgat1 |
−0.7512 |
−0.8729 |
0.3972 |
Dgat2 |
−1.5784 |
−2.8222 |
0.0000 |
Apoa4 |
−1.8770 |
−1.6981 |
0.0002 |
Apoa1 |
−0.9414 |
−0.6254 |
0.0002 |
Apob |
−1.2659 |
−3.3390 |
0.0004 |
Apoc2 |
−1.6412 |
−2.9857 |
0.0022 |
Hadh |
−0.5912 |
−1.5576 |
0.0143 |
Scp2 |
−0.8594 |
−1.2758 |
0.1873 |
Acsl1 |
−0.7173 |
−0.7345 |
0.0965 |
Acaa2 |
−0.7438 |
||
Acsl5 |
−1.0342 |
−1.3321 |
0.0014 |
Crat |
−0.8403 |
||
Gyk |
−1.2075 |
−2.9896 |
0.0000 |
Slc22a5/Octn2 |
−0.8247 |
||
Abcd3 |
−0.7621 |
−0.8979 |
0.0067 |
Slc27a2/Fatp2 |
−1.1491 |
0.0511 |
0.8748 |
Acaa1a /1b |
−0.9283 |
−1.4126 |
0.0013 |
Acot4 |
−1.5366 |
−0.6090 |
0.0487 |
Cyp4a10//Cyp4a31 |
−3.1568 |
||
Cyp4b1 |
−1.9094 |
−2.5144 |
0.0002 |
Cyp4f16 |
−0.9681 |
−1.5814 |
0.0086 |
F10: crypt cell fraction. F1: villus cell fraction [29].
Finally, alterations of genes involved in lipid metabolism, specifically of Mttp, may also affect mucosal immunity. MTTP, in cooperation with IEC-expressed CD1d, provides protective functions in inflammation through induction of IL10, Hsp105 and Cd11d to itself [34] . Thus, reduced Mttp expression may perpetuate the cycle of a chronic “wound-healing” response to low levels of tissue damage that is associated with increased risk of tumor development [30].
The presence of a chronic stress response well before the appearance of tumors in Muc2−/− mice can also be inferred by the altered expression of components of the ER-stress response. In addition, the increased accumulation of Xbp1-s, which was shown to be required for the maintenance of secretory cell lineages [35], may also be linked to the ER response associated with enhanced production of bacteriostatic and bacteriocidal peptides by secretory Paneth cells that we and others previously reported [5, 24, 25], documented by their increased expression of Grp78 (Figure 9A and 9B). Of note, conditional inactivation of Xbp1 in the intestine results in spontaneous colitis, and, in IBD patients, increased levels of Xbp1-s were described [35, 36]. Studies in several mouse models with alterations of components of the UPR specifically in intestinal goblet cells, or displaying an exacerbated ER response linked to a mutation in the Muc2 gene resulting in the accumulation of miss-folded protein, have underlined the complex interplay between goblet cells and the Muc2 mucin they secrete, and the ER-response in determining increased susceptibility to colitis [37–40]. However, we did not detect an enhanced ER stress response specifically in the goblet cells of the Muc2−/− mouse. In this context, it is important that the ER stress response in Muc2−/− intestine is not accompanied by colitis, but may be a marker of the lower level of chronic inflammation that we have previously reported in the Muc2−/− mucosa. This status of pathologically silent chronic inflammation may explain the increased Grp78 positivity of intravillus stroma cells that may be in an activated state with increased expression/secretion of cytokines, as previously reported by us [2]. Similar observation was reported in the small intestine of IEC-specific Grp78-deficient mouse [41].
The significance of altered cross-talk between the intestinal epithelial cells and the microbiota in Muc2−/− mice is at least two fold. First, more subtle and focal compromise of the mucus barrier, indicated by a decrease in goblet cells, the lineage that synthesizes and secretes mucins and other components of the mucus, is seen in many mouse models of intestinal cancer [42–45]. Moreover, aberrant crypt foci, and a subset of mucin depleted ACF (MDF) which may be direct precursors to tumor development [44, 46–48] are depleted in goblet cells and thus, focally in the mucins they produce. Thus, these focal changes may mimic the generalized defect of mucosal barrier function generated in the Muc2 mouse that leads to development of tumors in the small and large intestine and the rectum. Interestingly, even in sporadic colon cancers, which are not clearly associated with pre-existing inflammation, Grivennikov et al. identified an inflammatory signature linked to an adenoma-associated barrier defect and microbial product exposure [49], involving IL23, which we reported was elevated in the normal appearing colon of Muc2−/− mice [5].
In summary, our analysis of the Muc2−/− mouse, in which there is loss of the mucus barrier, reveals important perturbations that contribute to the loss of homeostasis and the development of colon and intestinal tumors. These perturbations, which are amplified by their presence throughout the mucosa in the Muc2 mouse completely devoid of the mucus barrier, may identify changes in biochemistry and molecular pathways that drive higher probability of tumor development but which are only subtly and focally altered in the long-term development of common sporadic colon cancer.
MATERIALS AND METHODS
Mice
The Muc2−/− mice have been back-crossed onto a Bl/6 background for >10 generations. Muc2−/− and Muc2+/+ littermates from breeding of heterozygotes were maintained on standard chow diet and provided tap water ad libitum. All mice were housed and bred in an AALAC accredited animal services facility and all mouse experiments followed a protocol approved by the Institutional Animal Care and Use Committees at the Albert Einstein School of Medicine. Mice were sacrificed at 3 month of age.
Total RNA isolation and microarray analysis
Total RNA was isolated from frozen, pulverized tissue, or purified intestinal epithelial cells, using Trizol (Invitrogen), treated with RQ1 RNAse free DNAseI (Promega) for 15 min at room temperature followed by purification on a Qiagen column (RNeasy kit, Qiagen) following the kit protocol for those samples to be used in microarray experiments. Otherwise, after DNAse I digestion, RNA was purified by sequential phenol:chloroform extraction followed by ethanol precipitation. Integrity of RNA was determined using the Agilent 2100 Bioanalyzer or by ethidium bromide visualization upon agarose gel electrophoresis.
For microarray experiments, total RNA was purified from intestinal epithelial cells isolated from the duodenum of age matched Muc2−/− and WT mice, three mice per genotype, at 3 months of age, both genders in equal number, as previously reported [5]. Duodenum was chosen as it was the preferential site for tumor development [4]. Expression analysis was performed using Gene Chip Mouse Genome 430 2.0 arrays (Affimetrix) by the Albert Einstein core facility (http://www.aecom.yu.edu/dna/affy). Background correction, normalization, and log-scale transformation of the raw expression data was done by robust multichip analysis (RMA) using the Methods for Affymetrix Oligonucleotide Arrays R package (freely available at http://www.bioconductor.org). The criteria to consider a gene to be altered in expression in the flat mucosa of Muc2−/− mice compared to wt mice were a mean difference in expression level (increase or decrease) of 1.5 fold, and a p-value comparing Muc2−/− to WT mice of < 0.05 (Student’s t-test).
Genes satisfying these criteria were further analyzed using IPA to identify biological functions and canonical pathways affected by Muc2 deficiency.
Quantitative RT-PCR
Microarray validation of selected genes was performed by reverse transcription of RNA preparations from duodenal IECs purified independently from a separate cohort of 3 month old mice (3 mice/genotype). Expression levels of individual genes were determined by qRT-PCR using SYBER Green Core reagent kit in a 7900HT ABI Instrument (Applied Biosystem), using the standard curve method with values normalized to those of the ribosomal protein L41 (Rpl41).
Total RNA was isolated from independently purified intestinal epithelial cells from duodenum from 3 Muc2−/− and 3 WT, 3-month-old, gender matched mice. Cells were rapidly frozen in liquid N2, and kept at −80°C till RNA isolation. RNA was reverse transcribed into cDNA using SuperScript III reverse transcriptase (Invitrogen) and anchored oligodT primers. Amplification was conducted in a 7900HT ABI instrumente (Applied Biosystems) using the SYBER Green Core reagent kit. Each sample was analyzed in duplicate and quantification of relative level of gene expression was determined using the standard curve method. All values were normalized to the levels of β-actin or ribosomal protein L41 (Rpl41). In all cases reaction specificity was evaluated by the analysis of product melting curves and gel analysis. Primer sequences are available upon request
Immunohistochemistry
5 μm sections from formalin fixed, paraffin embedded samples were processed as previously reported [50–52]. Briefly, after deparaffinization and rehydration, sections were quenched in 3% H2O2 for 10 minutes at room temperature, briefly washed in dH2O. Antigen retrieval was then routinely performed in 0.01M sodium citrate pH 6.0 for 30′ in a conventional rice steamer, and slides then allowed to cool on the bench for 30 minutes. Blocking, when required, was performed by incubating slides in blocking solution [2.5% non-fat dried milk, 2% BSA fraction V, (Sigma) in TBS-T (1X TBS + 0.05% tween-20)] for 45 minutes at room temperature. Primary antibody, diluted in Signal Stain antibody diluent (Cell Signaling), was applied overnight at 4°C, followed by the SupperPicture anti rabbit HRP-conjugated polymer 1h at RT (In Vitrogen).). Detection was achieved using 3′5′ diaminobenzidine (DAB) as substrate. Antibodies were: anti g-H2AX/Phospho-Histone H2AX (Ser 139), rabbit monoclonal – Cell Signaling (1:400). Anti Grp78/BiP, rabbit monoclonal – Cell Signalling (1:200). Anti ITF/TFF3, rabbit polyclonal, was a generous gift of Dr. Tomasetto, Strasburg, France, (1:500).
ACKNOWLEDGMENTS AND FUNDING
Supported in part by the National Institutes of Health; United States Public Health Service (grant R01DK058245, R01CA151494, R01CA135561,R01 CA174432, U19AI091175, and Albert Einstein Cancer Center Support Grant P30 CA13330). We thank Lidija Klampfer for critical reading the manuscript, and Karina Peregrina for help with the microphotographs.
CONFLICTS OF INTEREST
None.
REFERENCES
1. Kufe DW. Mucins in cancer: function, prognosis and therapy. Nat Rev Cancer. 2009; 9:874–885.
2. Shan M, Gentile M, Yeiser JR, Walland AC, Bornstein VU, Chen K, He B, Cassis L, Bigas A, Cols M, Comerma L, Huang B, Blander JM, et al. Mucus Enhances Gut Homeostasis and Oral Tolerance by Delivering Immunoregulatory Signals. Science. 2013; 342:447–453.
3. McDole JR, Wheeler LW, McDonald KG, Wang B, Konjufca V, Knoop KA, Newberry RD, Miller MJ. Goblet cells deliver luminal antigen to CD103+ dendritic cells in the small intestine. Nature. 2012; 483:345–349.
4. Velcich A, Yang W, Heyer J, Fragale A, Nicholas C, Viani S, Kucherlapati R, Lipkin M, Yang K, Augenlicht L. Colorectal cancer in mice genetically deficient in the mucin Muc2. Science. 2002; 295:1726–1729.
5. Yang K, Popova NV, Yang WC, Lozonschi I, Tadesse S, Kent S, Bancroft L, Matise I, Cormier RT, Scherer SJ, Edelmann W, Lipkin M, Augenlicht L, Velcich A. Interaction of Muc2 and Apc on Wnt Signaling and in Intestinal Tumorigenesis: Potential Role of Chronic Inflammation. Cancer Res. 2008; 68:7313–7322.
6. Tanaka T, Kohno H, Suzuki R, Hata K, Sugie S, Niho N, Sakano K, Takahashi M, Wakabayashi K. Dextran sodium sulfate strongly promotes colorectal carcinogenesis in ApcMin/+ mice: Inflammatory stimuli by dextran sodium sulfate results in development of multiple colonic neoplasms. Int J Cancer. 2006; 118:25–34.
7. Sodir NM, Chen X, Park R, Nickel AE, Conti PS, Moats R, Bading JR, Shibata D, Laird PW. Smad3 Deficiency Promotes Tumorigenesis in the Distal Colon of ApcMin/+ Mice. Cancer Res. 2006; 66:8430–8438.
8. Poelstra K, Hardonk MJ, Koudstaal J, Bakker WW. Intraglomerular platelet aggregation and experimental glomerulonephritis. Kidney Int. 1990; 37:1500–1508.
9. Johansson ME, Phillipson M, Petersson J, Velcich A, Holm L, Hansson GC. The inner of the two Muc2 mucin-dependent mucus layers in colon is devoid of bacteria. Proc Natl Acad Sci U S A. 2008; 105:15064–15069.
10. Jones RM, Luo L, Ardita CS, Richardson AN, Kwon YM, Mercante JW, Alam A, Gates CL, Wu H, Swanson PA, Lambeth JD, Denning PW, Neish AS. Symbiotic lactobacilli stimulate gut epithelial proliferation via Nox-mediated generation of reactive oxygen species. EMBO J. 2013; 32:3017–3028.
11. Neish AS, Jones RM. Redox signaling mediates symbiosis between the gut microbiota and the intestine. Gut Microbes. 2014; 5:250–253.
12. Lipinski S, Till A, Sina C, Arlt A, Grasberger H, Schreiber S, Rosenstiel P. DUOX2-derived reactive oxygen species are effectors of NOD2-mediated antibacterial responses. J Cell Sci. 2009; 122:3522–3530.
13. Birchenough GMH, Nyström EEL, Johansson MEV, Hansson G. A sentinel goblet cell guards the colonic crypt by triggering Nlrp6-dependent Muc2 secretion. Science. 2016; 352:1535–1542.
14. Patel K, Miyoshi H, Beatty W, Head R, Malvin M, Cadwell K, Guan J, Saitoh T, Akira S, Seglen P, Dinauer M, Virgin H, Stappenbeck T. Autophagy proteins control goblet cell function by potentiating reactive oxygen species production. EMBO J. 2013; 32:3130–3144.
15. Wong AC, Vanhove AS, Watnick PI. The interplay between intestinal bacteria and host metabolism in health and disease: lessons from Drosophila melanogaster. Dis Model Mechan. 2016; 9:271–281.
16. McMullen PD, Bhattacharya S, Woods CG, Sun B, Yarborough K, Ross SM, Miller ME, McBride MT, LeCluyse EL, Clewell RA, Andersen ME. A map of the PPARα transcription regulatory network for primary human hepatocytes. Chemico-Biological Interactions. 2014; 209:14–24.
17. Rakhshandehroo M, Knoch B, Müller M, Kersten AS. Peroxisome Proliferator-Activated Receptor Alpha Target Genes. PPAR Res. 2010; ID 612089.
18. Sugden MC, Bulmer K, Gibbons GF, Knight BL, Holness MJ. eroxisome-proliferator-activated receptor-alpha (PPARalpha) deficiency leads to dysregulation of hepatic lipid and carbohydrate metabolism by fatty acids and insulin. BiochemJ. 2002; 364:361–368.
19. Grassian AR, Coloff JL, Brugge JS. Extracellular Matrix Regulation of Metabolism and Implications for Tumorigenesis. Cold Spring Harbor Symposia on Quantitative Biology. 2011; 76:313–324.
20. Fritz V, Fajas L. Metabolism and proliferation share common regulatory pathways in cancer cells. Oncogene. 2010; 29:4369–4377.
21. Hatzivassiliou G, Zhao F, Bauer DE, Andreadis C, Shaw AN, Dhanak D, Hingorani SR, Tuveson DA, Thompson CB. ATP citrate lyase inhibition can suppress tumor cell growth. Cancer Cell. 2005; 8:311–321.
22. Esteves P, Pecqueur C, Ransy C, Esnous C, Lenoir V, Bouillaud F, Bulteau AL, Lombès A, Prip-Buus C, Ricquier D, Alves-Guerra MC. Mitochondrial Retrograde Signaling Mediated by UCP2 Inhibits Cancer Cell Proliferation and Tumorigenesis. Cancer Research. 2014; 74:3971–3982.
23. Ron D, Walter P. Signal integration in the endoplasmic reticulum unfolded protein response. Nat Rev Mol Cell Biol. 2007; 8:519–529.
24. Hartmann P, Chen P, Wang HJ, Wang L, McCole DF, Brandl K, Stärkel P, Belzer C, Hellerbrand C, Tsukamoto H, Ho SB, Schnabl B. Deficiency of intestinal mucin-2 ameliorates experimental alcoholic liver disease in mice. Hepatology. 2013; 58:108–119.
25. Burger-van Paassen N, Loonen L, Witte-Bouma J, Korteland-van Male AM, de Bruijn AC, van der Sluis M, Lu P, Van Goudoever JB, Wells JM, Dekker J, Van Seuningen I, Renes IB. Mucin Muc2 deficiency and weaning influences the expression of the innate defense genes Reg3β, Reg3γ and angiogenin-4. PLoS One. 2012:e38798.
26. Touati E, Michel V, Thiberge JM, Wuscher N, Huerre M, Labigne A. Chronic Helicobacter pylori infections induce gastric mutations in mice. Gastroenterology. 2003; 124:1408–1419.
27. Sedelnikova OA, Redon CE, Dickey JS, Nakamura AJ, Georgakilas AG, Bonner WM. Role of oxidatively induced DNA lesions in human pathogenesis. Mutation Research/Reviews in Mutation Research. 2010; 704:152–159.
28. Roy S, Khanna S, Nallu K, Hunt TK, Sen CK. Dermal Wound Healing Is Subject to Redox Control. Mol Ther. 2006; 13:211–220.
29. Niethammer P, Grabher C, Look AT, Mitchison TJ. A tissue-scale gradient of hydrogen peroxide mediates rapid wound detection in zebrafish. Nature. 2009; 459:996–999.
30. Chovatiya R, Medzhitov R. Stress, Inflammation, and Defense of Homeostasis. Molecular Cell. 2014; 54:281–288.
31. Choi PM, Guo J, Erwin CR, Wandu WS, Leinicke JA, Xie Y, Davidson NO, Warner BW. Disruption of retinoblastoma protein expression in the intestinal epithelium impairs lipid absorption. Am J Physiol Gastrointest Liver Physiol. 2014; 306: G909–G915.
32. Heimerl S, Moehle C, Zahn A, Boettcher A, Stremmel W, Langmann T, Schmitz G. Alterations in intestinal fatty acid metabolism in inflammatory bowel disease. Biochimica et Biophysica Acta (BBA) - Molecular Basis of Disease. 2006; 1762:341–350.
33. Wang D, Peregrina K, Dhima E, Lin EY, Mariadason JM, Augenlicht LH. Paneth cell marker expression in intestinal villi and colon crypts characterizes dietary induced risk for mouse sporadic intestinal cancer. Proceedings of the National Academy of Sciences. 2011; 108:10272–10277.
34. Olszak T, Neves JF, Dowds CM, Baker K, Glickman J, Davidson NO, Lin CS, Jobin C, Brand S, Sotlar K, Wada K, Katayama K, Nakajima A, et al. Protective mucosal immunity mediated by epithelial CD1d and IL-10. Nature. 2014; 509:497–502.
35. Kaser A, Lee AH, Franke A, Glickman JN, Zeissig S, Tilg H, Nieuwenhuis EES, Higgins DE, Schreiber S, Glimcher LH, Blumberg RS. XBP1 Links ER Stress to Intestinal Inflammation and Confers Genetic Risk for Human Inflammatory Bowel Disease. Cell. 2008; 134:743–756.
36. Kaser A, Blumberg RS. Endoplasmic reticulum stress and intestinal inflammation. Mucosal Immunol. 2009; 3:11–16.
37. Heazlewood CK, Cook MC, Eri R, Price GR, Tauro SB, Taupin D, Thornton DJ, Png CW, Crockford TL, Cornall RJ, Adams R, Kato M, Nelms KA, et al. Aberrant Mucin Assembly in Mice Causes Endoplasmic Reticulum Stress and Spontaneous Inflammation Resembling Ulcerative Colitis. PLOS Medicine. 2008; 5: 440–459.
38. Das I, Png C, Oancea I, Hasnain S, Lourie R, Proctor M, Eri R, Sheng Y, Crane D, Florin T, McGuckin MA. Glucocorticoids alleviate intestinal ER stress by enhancing protein folding and degradation of misfolded protein. J Exp Med. 2013; 210:1201–1216.
39. Bertolotti A, Wang X, Novoa I, Jungreis R, Schlessinger K, Cho JH, West AB, Ron D. Increased sensitivity to dextran sodium sulfate colitis in IRE1β-deficient mice. J Clin Invest. 2001; 107:585–593.
40. Zhao F, Edwards R, Dizon D, Afrasiabi K, Mastroianni JR, Geyfman M, Ouellette AJ, Andersen B, Lipkin SM. Disruption of Paneth and goblet cell homeostasis and increased endoplasmic reticulum stress in Agr2-/- mice. Developmental Biology. 2010; 338:270–279.
41. van Lidth de Jeude JF, Meijer BJ, Wielenga MC, Spaan CN, Baan B, Rosekrans SL, Meisner S, Shen YH, Lee AS, Paton JC, Paton AW, Muncan V, van den Brink GR, Heijmans J. Induction of endoplasmic reticulum stress by deletion of Grp78 depletes Apc mutant intestinal epithelial stem cells. Oncogene. 2016.
42. Pretlow TP, Edelmann W, Kucherlapati R, Pretlow TG, Augenlicht LH. Spontaneous Aberrant Crypt Foci in Apc1638N Mice with a Mutant Apc Allele. Am J Pathol. 2003; 163:1757–1763.
43. Pretlow TP, O'Riordan MA, Somich GA, Amini SB, Pretlow TG. Aberrant crypts correlate with tumor incidence in F344 rats treated with azoxymethane and phytate. Carcinogenesis. 1992; 13:1509–1512.
44. Caderni G, Femia AP, Giannini A, Favuzza A, Luceri C, Salvadori M, Dolara P. Identification of Mucin-depleted Foci in the Unsectioned Colon of Azoxymethane-treated Rats: Correlation with Carcinogenesis. Cancer Res. 2003; 63:2388–2392.
45. Femia AP, Dolara P, Luceri C, Salvadori M, Caderni G. Mucin-depleted foci show strong activation of inflammatory markers in 1,2-dimethylhydrazine-induced carcinogenesis and are promoted by the inflammatory agent sodium dextran sulfate. International Journal of Cancer. 2009; 125:541–547.
46. Pretlow TP, Barrow BJ, Ashton WS, O'Riordan MA, Pretlow TG, Jurcisek JA, Stellato TA. Aberrant crypts: putative preneoplastic foci in human colonic mucosa. Cancer Res. 1991; 51:1564–1567.
47. Femia AP, Dolara P, Caderni G. Mucin-depleted foci (MDF) in the colon of rats treated with azoxymethane (AOM) are useful biomarkers for colon carcinogenesis. 10.1093/carcin/bgh005. Carcinogenesis. 2004; 25:277–281.
48. Femia AP, Swidsinski A, Dolara P, Salvadori M, Amedei A, Caderni G. Mucin Depleted Foci, Colonic Preneoplastic Lesions Lacking Muc2, Show Up-Regulation of Tlr2 but Not Bacterial Infiltration. Plos One. 2012; 7:e29918.
49. Grivennikov SI, Wang K, Mucida D, Stewart CA, Schnabl B, Jauch D, Taniguchi K, Yu GY, Osterreicher CH, Hung KE, Datz C, Feng Y, Fearon ER, et al. Adenoma-linked barrier defects and microbial products drive IL-23/IL-17-mediated tumour growth. Nature. 2012; 491:254–258.
50. Grivennikov SI, Wang K, Mucida D, Stewart CA, Schnabl B, Jauch D, Taniguchi K, Yu GY, Osterreicher CH, Hung KE, Datz C, Feng Y, Fearon ER, et al. Targeted inactivation of p27kip1 is sufficient for large and small intestinal tumorigenesis in the mouse, which can be augmented by a Western-style high-risk diet. Cancer Res. 2003; 63:4990–4996.
51. Yang W, Velcich A, Lozonschi I, Liang J, Nicholas C, Zhuang M, Bancroft L, Augenlicht LH. Inactivation of p21WAF1/cip1 enhances intestinal tumor formation in Muc2-/- mice. Am J Pathol. 2005; 166:1239–1246.
52. Yang WC, Mathew J, Velcich A, Edelmann W, Kucherlapati R, Lipkin M, Yang K, Augenlicht LH. Targeted inactivation of the p21(WAF1/cip1) gene enhances Apc-initiated tumor formation and the tumor-promoting activity of a Western-style high-risk diet by altering cell maturation in the intestinal mucosal. Cancer Res. 2001; 61:565–569.