
INTRODUCTION
Treatment options for NSCLC, the most predominant type of lung cancer, have developed rapidly due to the discovery and investigation of genetic drivers such as EGFR-activating mutations [1, 2]. Mutations in EGFR act as both biomarkers and rational targets for treatment [2]. Patients with adenocarcinoma histology, females, never-smokers, and those of Asian ethnicity are more likely to have EGFR mutations and thus exhibit better responses to EGFR tyrosine kinase inhibitors (TKIs) [3]. Exon 19 deletions and mutations of exon 21 (L858R) are the two most prevalent (approximately 90%) activating mutations, and patients with these mutations have shown a high overall response rate to TKIs (approximately 80%) [2, 4, 5].
As a result, EGFR genotype could help in the selection of patients who will benefit from TKIs when making treatment decisions. However, some hurdles must still be overcome before making this individualized approach to treatment a reality. First, there is no unified mutation detection approach for testing patients. Other problems, such as tumor site inaccessibility, a shortage of tissues for testing, tumor heterogeneity or a patient’s refusal to undergo invasive detection, also pose limitations. Thus, the development of noninvasive and effective methods to help identify the status of the EGFR gene is necessary. We previously discussed the role of PET/CT in staging, assessing therapy response and developing a radiotherapy plan for patients with NSCLC [6, 7]. PET/CT is based on the fact that the glucose metabolism of a tumor is partly reflected by FDG uptake. Processes downstream of the EGFR gene could influence glucose metabolism by regulating the synthesis of glucose-transporter-1 (GLUT1), which correlates with FDG uptake [8, 9]. Therefore, FDG uptake might be associated with EGFR gene mutation in tumors.
Many researchers have reported that the SUVmax of a primary lesion, a metabolic parameter on PET, is associated with prognosis in NSCLC [10–13]. Previous studies found that NSCLC patients who were treated with TKIs and who have a low SUVmax of the primary lesion might have better outcomes [14]. Given that patients with EGFR mutation showed a better response to TKIs than those with wild-type EGFR, it was hypothesized that low SUVmax might be associated with EGFR gene mutations [15]. Many researchers have focused on the relationship between PET/CT-associated parameters and EGFR gene mutation [15–25]. However, most prior studies focusing on SUVmax have produced varying results.
MTV is acquired by outlining a primary tumor using an SUVmax cutoff of 2.5, which provides additional information such as tumor burden and heterogeneity and could be prognostic for survival and tumor metabolic activity [20, 26–28]. We therefore explored the role of MTV for predicting EGFR mutation status in NSCLC and further established a useful prediction model to help in screening and identification of mutation status.
RESULTS
Patients and tumor characteristics
We identified 87 (mean age, 60 years) patients who underwent EGFR mutation detection. Adenocarcinoma was the major pathology (n=78; 89.7%). Male sex (n=49; 56.3 %), non-smoker status (n=55; 63.2 %), advanced stage (III–IV) (n=74; 85.1 %) and peripheral tumor location (n=59; 67.8 %) were relatively predominant. Forty-one of the patients (47.1 %) had EGFR mutations, and the main mutation subtypes were exon19 deletion (n=14) and exon 21 L858R point mutation (n=25). Other mutations were identified in the two other patients with an EGFR mutation. Clinical factors and EGFR mutation status are summarized in Table 1 and Table 2.
Table 1: Patient Characteristics and tumor variables
Number (%) |
|
|---|---|
Patients, n |
87 (100) |
Age (years) |
|
Median |
60 |
Range |
29-86 |
Gender, n |
|
Male |
49 (56) |
Female |
38 (44) |
Smoking status, n |
|
Smoker |
32 (37) |
Never-smoker |
55 (63) |
Stage, TNM, n |
|
I/II |
13 (15) |
III/IV |
74 (85) |
Pathology, n |
|
ADC |
78 (90) |
Other |
9 (10) |
Location, n |
|
Peripheral |
59 (68) |
Central |
28 (32) |
Table 2: Clinical characteristics and EGFR mutation status
Variables |
Total |
EGFR+ (%) |
EGFR- (%) |
P |
|---|---|---|---|---|
Age |
||||
>60 |
41 |
19(46) |
22(53) |
1.000 |
≤60 |
46 |
22(48) |
24(52) |
|
Gender |
||||
Male |
49 |
22(45) |
27(55) |
0.670 |
Female |
38 |
19(50) |
19(50) |
|
Smoking status, n |
||||
Smoker |
32 |
8(25) |
24(75) |
0.002 |
Never-smoker |
55 |
33(60) |
22(40) |
|
Stage, AJCC, n |
||||
I/II |
13 |
8(62) |
22(48) |
0.368 |
III/IV |
74 |
33(45) |
41(55) |
|
Pathology, n |
||||
ADC |
78 |
40(51) |
38(49) |
0.032 |
Other |
9 |
1(11) |
8(89) |
|
Location, n |
||||
Peripheral |
59 |
34(58) |
25(42) |
0.006 |
Central |
28 |
7(25) |
21(75) |
|
Diameter, n |
||||
>3.5 cm |
36 |
13(36) |
23(64) |
0.126 |
≤3.5 cm |
51 |
28(55) |
23(45) |
|
SUVmax, n |
||||
>10.4 |
46 |
20(43) |
26(57) |
0.470 |
≤10.4 |
41 |
21(51) |
20(49) |
|
SUVmean, n |
||||
>6.0 |
43 |
10(23) |
34(77) |
0.087 |
≤6.0 |
44 |
31(72) |
12(28) |
|
MTV, n |
||||
>11.0 cm3 |
44 |
10(23) |
34(77) |
0.001 |
≤11.0 cm3 |
43 |
31(72) |
12(28) |
|
CEA |
||||
>15.0 ng/mL |
42 |
22(52) |
20(48) |
0.382 |
≤15.0 ng/mL |
42 |
17(49) |
25(60) |
Abbreviations: SUVmax: maximal standardized uptake value; MTV: metabolic tumor volume; EGFR+: EGFR mutation; and EGFR-: no EGFR mutation.
Comparison of metabolic parameters and EGFR mutation status
Patients with EGFR mutations had significantly lower MTV and SUVmean values than those with wild-type EGFR (p=0.001 and p=0.031, respectively) (Figure 1). No statistically significant correlation with SUVmax was found between patients with mutant and wild-type EGFR.
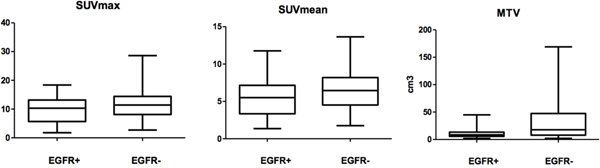
Figure 1: Comparison of metabolic parameters of primary lesions in NSCLC between EGFR+ and EGFR- by Wilcoxon rank-sum test. SUVmean and MTV, p<0.05; SUVmax p >0.05.
EGFR status and clinical features
A significant correlation was found between EGFR status and smoking history, pathology and tumor location. Other characteristics, including age, gender, and TNM stage, did not differ significantly by mutation status. ROC curve analysis revealed a pretreatment CEA cutoff and tumor diameter of 8.0 (ng/mL) and 3.5 (cm), respectively, with AUCs of 0.57 and 0.65. However, no significant difference was found according to these two factors (Table 2).
EGFR status and PET/CT results
The comparison of different EGFR mutation statuses and metabolic parameters is shown in Figure 1. There was no association between the tested metabolic parameters and EGFR mutation status. We therefore explored the use of metabolic parameters in predicting EGFR mutation status. ROC curve analysis revealed cutoff points for SUVmax, SUVmean and MTV of 10.4, 6.0 and 11.0 (cm3), respectively, with AUCs of 0.599, 0.634 and 0.711. We dichotomized the patients according to these thresholds and found that EGFR mutations were more frequent in patients with a lower MTV (p=0.001), indicating the predictive role of this parameter.
Predicting EGFR mutation
In univariate analysis, EGFR mutation was correlated with ADC pathology, non-smoker status, peripheral tumor location, and low MTV. In addition, tumor diameter was an important factor in our study because EGFR mutations tended to be relatively more frequent in patients with smaller-diameter tumors, although no statistically significant difference (p=0.126) was found between the two groups. Multivariable logistic regression analysis with inclusion of these parameters revealed that only non-smoker status, peripheral tumor location and low MTV were significant predictors of EGFR mutation (Table 3). ROC curve analysis was then performed to validate the predictive value of these factors; an AUC of 0.805 was produced, which suggests good discrimination (Figure 2). The sensitivity and specificity of our prediction model including MTV were 61.0% and 80.4%, respectively.
Table 3: Multivariate regression analyses for various predictive factors of EGFR mutation
EGFR |
|||
|---|---|---|---|
OR |
95% CI |
P |
|
Never smoker |
3.589 |
1.077-11.953 |
0.037 |
ADC |
2.288 |
0.211-24.822 |
0.496 |
Peripheral location |
3.833 |
1.113-13.207 |
0.033 |
MTV≤11.0 cm3 |
35.859 |
4.038-318.481 |
0.001 |
Diameter≤3.5 cm |
0.134 |
0.015-1.209 |
0.073 |
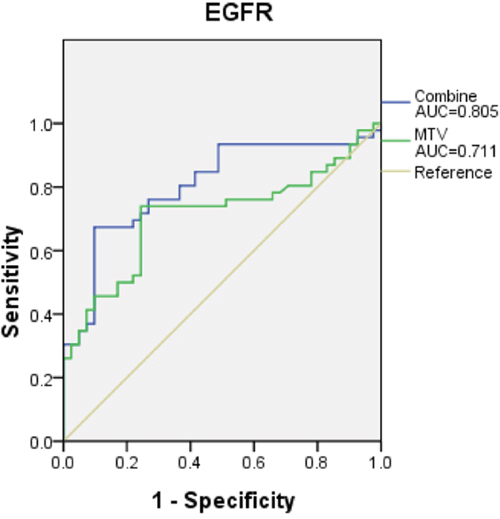
Figure 2: The prediction models consist of three criteria. MTV, non-smokers and peripheral location for EGFR mutation yielded a higher AUC (0.805, 95% CI 0.712-0.899, p=0.001), which suggests that the model has good discrimination. However, the AUC when using only MTV to predict EGFR mutation was lower.
DISCUSSION
Individual gene detection has been recommended for advanced NSCLC; however, such assessment is often limited by tumor inaccessibility, insufficient sample tissue for detection and patients’ unwillingness to undergo invasive detection procedures [15]. Therefore, PET/CT is advantageous as a noninvasive strategy for predicting EGFR gene mutation status. In this study, we found that MTV, a metabolic parameter estimated by PET/CT, was correlated with EGFR mutation status. By contrast, SUVmax did not show a significant correlation.
Many prior studies have focused on the role of PET/CT in predicting EGFR mutation status. Na et al. and Huang et al. found a significant association between SUVmax and EGFR mutation status, although the trends between the EGFR mutant groups and wild-type groups in the two reports differed [15, 16]. Three other studies found no relationship between SUVmax and EGFR gene mutation status [19, 20, 24]. Data from previous association studies are summarized in Table 4.
Table 4: Summary of published data on the associations between EGFR mutation and variables in patients with NSCLC
Author |
Year |
Country |
Number of Patients |
TNM stage |
Pathology |
Mutations |
FDG-Variables |
Findings |
Other variables |
|---|---|---|---|---|---|---|---|---|---|
Na |
2010 |
Korea |
100 |
1, 2, 3, and 4 |
ADC+SCC +Other |
19 and 21 |
SUVmax |
Low SUVmax was predictive of EGFR mutations. |
N |
Huang |
2010 |
China |
77 |
3 and 4 |
ADC |
18, 19, 20, and 21 |
SUVmax |
High SUVmax was predictive of EGFR mutations. |
N |
Mak |
2011 |
America |
100 |
1, 2, 3, and 4 |
ADC+SCC +Other |
18, 19, 20, and 21 |
SUVmax |
Low SUVmax was predictive of EGFR mutations. |
Smoking history |
Choi |
2012 |
Korea |
163 |
3 and 4 |
ADC+SCC +other |
18, 19, 20, and 21 |
SUVmax, SUVmean |
Low SUVmax was predictive of EGFR mutations |
Smoking history |
Putora |
2013 |
Switzerland |
14 |
NA |
ADC |
19 and 21 |
SUVmax |
Not predictive of EGFR mutations. |
N |
Chung |
2014 |
Korea |
106 |
1, 2, 3, and 4 |
ADC |
18, 19, 20, and 21 |
SUVmax and tMTV |
Not predictive of EGFR mutations |
NA |
Caicedo |
2014 |
Spain |
102 |
3 and 4 |
ADC+SCC +other |
18, 19, 20, and 21 |
SUVmax |
Not predictive of EGFR mutations |
N |
Ko |
2014 |
China |
132 |
1, 2, 3, and 4 |
ADC |
18, 19, 20, and 21 |
SUVmax |
High SUVmax was predictive of EGFR mutations. |
CEA, smoking history, and diameter |
Lee |
2015 |
China |
71 |
4 |
ADC |
18, 19, 20, and 21 |
nSUVmax and mSUVmax |
nSUVmax, mSUVmax were predictive of EGFR mutations |
Age, gender, and smoking history |
Mo |
2015 |
Korea |
206 |
1, 2, 3, and 4 |
ADC+SCC +Other |
18, 19, 20, and 21 |
SUVmax |
Not predictive of EGFR mutations |
Gender and smoking history |
Cho |
2016 |
Korea |
61 |
1, 2, 3, and 4 |
ADC+SCC +other |
18, 19, 20, and 21 |
SUVmax |
SUVmax was predictive of EGFR mutations |
Gender |
Abbreviations: SUVmax: maximal standardized uptake value of primary lesion; nSUVmax: maximal standardized uptake value of metastasis lymph node; mSUVmax: maximal standardized uptake value of metastasis lesions (except lymph node); tMTV: metabolic tumor volume of all malignant lesions throughout the body; ADC: adenocarcinoma; and SCC: squamous cell carcinoma.
According to our observations, the presence of EGFR mutations did not correlate with SUVmax or SUVmean. A possible explanation for these observations is that SUVmax and SUVmean are semi-quantitative indexes that could vary with different PET scanners, fasting duration, level of plasma glucose and region of interest (ROI) parameters. In addition, simple SUV might fail to reflect the spatial features and behaviors of a primary lesion in imaging, which could provide more information about the biological behaviors of tumors such as mutation status and tumor heterogeneity [29].
Given the limitation of SUVmax, we chose another volume-based PET/CT parameter, metabolic tumor volume (MTV), as an alternative variable to explore the relationship between PET/CT and EGFR gene mutation status. This parameter provides complementary information about disease burden, which is prognostic for outcomes and tumor metabolic activity [27, 30]. Previous studies have found a positive impact of low MTV on patient outcomes [20, 26, 31]. It is also well known that patients with mutant EGFR appear to have a better prognosis than patients with wild-type EGFR [2, 4, 5]. Thus, we hypothesize that low MTV may be associated with EGFR gene mutation.
Some prior studies focused on this parameter have reported that whole MTV is not associated with EGFR gene mutation status [20, 32]. Whole MTV includes all malignant lesions and can be influenced by substantial interference. Focusing only on the MTV of a primary lesion, as in the current work, might reduce this interference to a certain extent. Using different criteria, such as SUV2.5, SUV3.0, and SUV40%, to define MTV could influence results, but SUV2.5 has been identified as the best choice [33]. We found that low MTV was associated with EGFR mutation and established that MTV is predictive of EGFR gene mutations.
Our sample size (n=87) was comparable to previous similar studies, which have ranged from 77 to 106 in size. Furthermore, clinicopathological variables, such as sex, tumor histology, smoking history, and tumor location, were explored in our study, and a peripheral location and smoking history were found to be associated with EGFR mutation. These factors have varied in former studies, which could be a result of evaluating different numbers of patients and patients from different countries. Our findings provide evidence that a low MTV is associated with EGFR mutation and that PET/CT-associated parameters have a role in the noninvasive prediction of EGFR gene mutation status.
Noninvasive examination has been a focus of many recent studies, including our own. Determining how to utilize a patient’s clinicopathologic and imaging information to help identify EGFR mutation is worth studying. Measurements of metabolic parameters such as MTV and SUVmax offer an easy pathway towards this goal, as the majority of patients receive PET/CT during primary diagnosis and staging. Despite being readily available, however, the metabolic parameters that could help identify EGFR mutation have not been well researched to date. Based on the results in the current work, the sensitivity and specificity for our prediction model that included MTV were 61.0% and 80.4%, respectively.
One advantage of using metabolic parameters to predict EGFR mutation status is that these parameters provide direct measures of malignant lesions and can reflect tumor heterogeneity to a certain degree. However, many noninvasive methods can experience interference caused by the internal environment, and different technologies have different standards. By contrast, PET/CT is well established and has been widely used. Many studies have tried to identify useful parameters that could help predict EGFR mutation status using conventional imaging such as CT and MR. Our group has focused on the clinical application value of PET/CT in many fields. Our prediction model showed better discrimination than previous models and warrants further research. Finally, the results from the current work might be used to help develop an imaging biomarker to non-invasively identify EGFR mutation status using PET imaging to complement, but not replace, molecular testing. Prospective studies with blinded mutation status and independent datasets will be needed to further validate the predictive power of the metabolic parameters discussed here. Furthermore, additional studies should investigate how EGFR mutation gives rise to certain phenotypic traits that are quantified by these imaging parameters.
There were some limitations to our study. First, the study had a retrospective design with a relatively small size. Second, a possible bias could have existed in the process of patient-selection. Third, differences in metabolic parameters between EGFR mutation and mutations in other important genes (e.g., ALK) were not discussed, which is something we aim to address in future studies. We will continue to follow up with the patients assessed here and intend to publish survival results in the future. In addition, there were several PET/CT parameters that were not discussed. As heterogeneity in tumor phenotype can be quantitatively described through radiomic features, [29, 34, 35] we plan to assess these parameters in the future. Overall, the current work makes important contributions to the noninvasive prediction of EGFR mutation status in patients without a known genotype.
In conclusion, the results of the present study suggest that EGFR mutation in an Asian population with NSCLC is correlated with clinical and metabolic parameters, including MTV, smoking status and tumor location. The combined evaluation of these three factors could be helpful in discriminating mutation status, especially for patients with inadequate sampling or when genetic testing is not available. However, a larger, multi-institutional, prospective study is needed for further validation of the current results, and cost analysis is also mandatory when developing an optimal diagnostic algorithm.
PATIENTS AND METHODS
Study design and patients
The institutional review board approved this study for human investigation. Between January 2013 and September 2016, retrospective analysis was carried out for all newly diagnosed patients with pathologically confirmed NSCLC with further testing performed for EGFR mutation analysis and PET/CT examination less than 2 weeks before any treatment in Shandong Cancer Hospital Affiliated with Shandong University. Tumor samples of primary lesions were obtained by CT-guided biopsy, bronchoscopy, or pathologically or from postoperative specimens. We excluded the following patients: (1) patients who had any therapy prior to PET/CT, (2) patients whose specimens were inadequate for mutation analyses, (3) patients with acute and chronic pneumonia or other infections that might interfere with PET/CT imaging, (4) patients who had other cancers previously, (5) patients who had double or multiple primary cancers, and (6) patients whose primary lesion measured less than 1 cm in diameter, which might cause an error in PET/CT imaging due to a partial volume effect. Ultimately, clinical data and PET/CT imaging data were analyzed from 87 patients who underwent EGFR testing. Basic clinical characteristics are summarized in Table 1. Age, gender, smoking history, TNM stage, location of primary tumor (central or peripheral), maximum diameter of primary tumor according to CT, pre-therapy level of serum CEA (normal 0–3.4 ng/ml) and metabolic parameters from PET/CT were analyzed, as shown in Table 2. Patients who never smoked or smoked less than 100 cigarettes until the time of diagnosis were regarded as non-smokers. The others were considered smokers [23].
PET/CT imaging analysis
Pretreatment PET/CT scans were performed using a PET/CT scanner (Discovery LS, GE Healthcare). The patients fasted for no less than 6 hours before the examination, and blood glucose levels met the requirement before intravenous injection of [18F] FDG. Sixty minutes later, PET and CT scans were obtained during free breathing with axial sampling at 4.25 millimeters thickness per slide. Reconstruction and analysis of PET and CT images were achieved using the manufacturer’s review station (Xeleris; GE Healthcare).
Two experienced PET/CT physicians (M.L. and H.Y.) measured tumor SUVmax, SUVmean and MTV for all patients. MTV was defined as the volume of the part of the primary lesion that was obtained using the cutoff (SUV≥2.5), which has been widely approved for NSCLC [33]. SUVmax and SUVmean of the MTV were obtained automatically through the manufacturer’s software. The details of the procedure have been reported previously [33].
EGFR gene mutation test
Pathological samples used for mutation status analysis were obtained via surgery, bronchoscopy or CT-guided biopsy. Genomic DNA from tumor tissue was acquired from paraffin-embedded sections using a microdissection method based on the protocols recommended by the manufacturer. ARMS-PCR was used to amplify the EGFR gene, and detection was performed using an ADx EGFR mutation detection kit. Previous reports have described the details of the detection procedure [36].
Statistical analysis
Continuous covariates such as metabolic parameters were compared against EGFR mutation status through the Wilcoxon rank-sum test. Differences in categorical variables including clinical parameters and PET/CT metabolic parameters among different mutation statuses were analyzed using Fisher’s exact or chi-squared tests. A ROC curve was applied to obtain cutoff values for continuous variables to predict mutation status. Multivariate logistic regression analysis was used to analyze the independent predictors of EGFR+ vs. EGFR- status. Finally, the predictive value of the model based on the independent predictors was assessed by analyzing the area under the ROC curve (AUC). According to previous studies, an AUC value of at least 0.70 represents acceptable or good discrimination [37]. Two-sided p values <0.05 were considered statistically significant. All statistical analyses were performed using SPSS (version 20.0).
CONFLICTS OF INTEREST
None of the authors have any conflicts of interest to disclose.
GRANT SUPPORT
This study was funded by the Natural Scientific Fund of Shandong Province (ZR2014HM011) and the Key Research Development Program of Shandong Province (2015GSF118181).
REFERENCES
1. Hanahan D, Weinberg RA. Hallmarks of cancer: the next generation. Cell. 2011; 144:646-674.
2. Lynch TJ, Bell DW, Sordella R, Gurubhagavatula S, Okimoto RA, Brannigan BW, Harris PL, Haserlat SM, Supko JG, Haluska FG, Louis DN, Christiani DC, Settleman J, Haber DA. Activating mutations in the epidermal growth factor receptor underlying responsiveness of non-small-cell lung cancer to gefitinib. N Engl J Med. 2004; 350:2129-2139.
3. Fukuoka M, Yano S, Giaccone G, Tamura T, Nakagawa K, Douillard JY, Nishiwaki Y, Vansteenkiste J, Kudoh S, Rischin D, Eek R, Horai T, Noda K, et al. Multi-institutional randomized phase II trial of gefitinib for previously treated patients with advanced non-small-cell lung cancer (The IDEAL 1 Trial) [corrected]. J Clin Oncol. 2003; 21:2237-2246.
4. Paez JG, Janne PA, Lee JC, Tracy S, Greulich H, Gabriel S, Herman P, Kaye FJ, Lindeman N, Boggon TJ, Naoki K, Sasaki H, Fujii Y, et al. EGFR mutations in lung cancer: correlation with clinical response to gefitinib therapy. Science. 2004; 304:1497-1500.
5. Miller VA, Riely GJ, Zakowski MF, Li AR, Patel JD, Heelan RT, Kris MG, Sandler AB, Carbone DP, Tsao A, Herbst RS, Heller G, Ladanyi M, et al. Molecular characteristics of bronchioloalveolar carcinoma and adenocarcinoma, bronchioloalveolar carcinoma subtype, predict response to erlotinib. J Clin Oncol. 2008; 26:1472-1478.
6. Higashi K, Ueda Y, Arisaka Y, Sakuma T, Nambu Y, Oguchi M, Seki H, Taki S, Tonami H, Yamamoto I. 18F-FDG uptake as a biologic prognostic factor for recurrence in patients with surgically resected non-small cell lung cancer. J Nucl Med. 2002; 43:39-45.
7. Shi X, Meng X, Sun X, Xing L, Yu J. PET/CT imaging-guided dose painting in radiation therapy. Cancer Lett. 2014; 355:169-175.
8. Sordella R, Bell DW, Haber DA, Settleman J. Gefitinib-sensitizing EGFR mutations in lung cancer activate anti-apoptotic pathways. Science. 2004; 305:1163-1167.
9. Mamede M, Higashi T, Kitaichi M, Ishizu K, Ishimori T, Nakamoto Y, Yanagihara K, Li M, Tanaka F, Wada H, Manabe T, Saga T. [18F]FDG uptake and PCNA, Glut-1, and Hexokinase-II expressions in cancers and inflammatory lesions of the lung. Neoplasia. 2005; 7:369-379.
10. Vansteenkiste JF, Stroobants SG, Dupont PJ, De Leyn PR, Verbeken EK, Deneffe GJ, Mortelmans LA, Demedts MG. Prognostic importance of the standardized uptake value on (18)F-fluoro-2-deoxy-glucose-positron emission tomography scan in non-small-cell lung cancer: An analysis of 125 cases. Leuven Lung Cancer Group. J Clin Oncol. 1999; 17:3201-3206.
11. Sasaki R, Komaki R, Macapinlac H, Erasmus J, Allen P, Forster K, Putnam JB, Herbst RS, Moran CA, Podoloff DA, Roth JA, Cox JD. [18F]fluorodeoxyglucose uptake by positron emission tomography predicts outcome of non-small-cell lung cancer. J Clin Oncol. 2005; 23:1136-1143.
12. Goodgame B, Pillot GA, Yang Z, Shriki J, Meyers BF, Zoole J, Gao F, Dehdashti F, Patterson A, Siegel BA, Govindan R. Prognostic value of preoperative positron emission tomography in resected stage I non-small cell lung cancer. J Thorac Oncol. 2008; 3:130-134.
13. Berghmans T, Dusart M, Paesmans M, Hossein-Foucher C, Buvat I, Castaigne C, Scherpereel A, Mascaux C, Moreau M, Roelandts M, Alard S, Meert AP, Patz EF Jr, et al. Primary tumor standardized uptake value (SUVmax) measured on fluorodeoxyglucose positron emission tomography (FDG-PET) is of prognostic value for survival in non-small cell lung cancer (NSCLC): a systematic review and meta-analysis (MA) by the European Lung Cancer Working Party for the IASLC Lung Cancer Staging Project. J Thorac Oncol. 2008; 3:6-12.
14. Na, II, Byun BH, Kang HJ, Cheon GJ, Koh JS, Kim CH, Choe DH, Ryoo BY, Lee JC, Lim SM, Yang SH. 18F-fluoro-2-deoxy-glucose uptake predicts clinical outcome in patients with gefitinib-treated non-small cell lung cancer. Clin Cancer Res. 2008; 14:2036-2041.
15. Na, II, Byun BH, Kim KM, Cheon GJ, Choe du H, Koh JS, Lee DY, Ryoo BY, Baek H, Lim SM, Yang SH, Kim CH, Lee JC. 18F-FDG uptake and EGFR mutations in patients with non-small cell lung cancer: a single-institution retrospective analysis. Lung Cancer. 2010; 67:76-80.
16. Huang CT, Yen RF, Cheng MF, Hsu YC, Wei PF, Tsai YJ, Tsai MF, Shih JY, Yang CH, Yang PC. Correlation of F-18 fluorodeoxyglucose-positron emission tomography maximal standardized uptake value and EGFR mutations in advanced lung adenocarcinoma. Med Oncol. 2010; 27:9-15.
17. Mak RH, Digumarthy SR, Muzikansky A, Engelman JA, Shepard JA, Choi NC, Sequist LV. Role of 18F-fluorodeoxyglucose positron emission tomography in predicting epidermal growth factor receptor mutations in non-small cell lung cancer. Oncologist. 2011; 16:319-326.
18. Choi YJ, Cho BC, Jeong YH, Seo HJ, Kim HJ, Cho A, Lee JH, Yun M, Jeon TJ, Lee JD, Kang WJ. Correlation between (18)f-fluorodeoxyglucose uptake and epidermal growth factor receptor mutations in advanced lung cancer. Nucl Med Mol Imaging. 2012; 46:169-175.
19. Putora PM, Fruh M, Muller J. FDG-PET SUV-max values do not correlate with epidermal growth factor receptor mutation status in lung adenocarcinoma. Respirology. 2013; 18:734-735.
20. Chung HW, Lee KY, Kim HJ, Kim WS, So Y. FDG PET/CT metabolic tumor volume and total lesion glycolysis predict prognosis in patients with advanced lung adenocarcinoma. J Cancer Res Clin Oncol. 2014; 140:89-98.
21. Caicedo C, Garcia-Velloso MJ, Lozano MD, Labiano T, Vigil Diaz C, Lopez-Picazo JM, Gurpide A, Zulueta JJ, Richter Echevarria JA, Perez Gracia JL. Role of [(1)(8)F]FDG PET in prediction of KRAS and EGFR mutation status in patients with advanced non-small-cell lung cancer. Eur J Nucl Med Mol Imaging. 2014; 41:2058-2065.
22. Ko KH, Hsu HH, Huang TW, Gao HW, Shen DH, Chang WC, Hsu YC, Chang TH, Chu CM, Ho CL, Chang H. Value of (1)(8)F-FDG uptake on PET/CT and CEA level to predict epidermal growth factor receptor mutations in pulmonary adenocarcinoma. Eur J Nucl Med Mol Imaging. 2014; 41:1889-1897.
23. Lee EY, Khong PL, Lee VH, Qian W, Yu X, Wong MP. Metabolic phenotype of stage IV lung adenocarcinoma: relationship with epidermal growth factor receptor mutation. Clin Nucl Med. 2015; 40:e190-195.
24. Lee SM, Bae SK, Jung SJ, Kim CK. FDG uptake in non-small cell lung cancer is not an independent predictor of EGFR or KRAS mutation status: a retrospective analysis of 206 patients. Clin Nucl Med. 2015; 40:950-958.
25. Cho A, Hur J, Moon YW, Hong SR, Suh YJ, Kim YJ, Im DJ, Hong YJ, Lee HJ, Kim YJ, Shim HS, Lee JS, Kim JH, Choi BW. Correlation between EGFR gene mutation, cytologic tumor markers, 18F-FDG uptake in non-small cell lung cancer. BMC Cancer. 2016; 16:224.
26. Yoo SW, Kim J, Chong A, Kwon SY, Min JJ, Song HC, Bom HS. Metabolic Tumor Volume Measured by F-18 FDG PET/CT can Further Stratify the Prognosis of Patients with Stage IV Non-Small Cell Lung Cancer. Nucl Med Mol Imaging. 2012; 46:286-293.
27. Liao S, Penney BC, Zhang H, Suzuki K, Pu Y. Prognostic value of the quantitative metabolic volumetric measurement on 18F-FDG PET/CT in Stage IV nonsurgical small-cell lung cancer. Acad Radiol. 2012; 19:69-77.
28. Nygaard AD, Holdgaard PC, Spindler KL, Pallisgaard N, Jakobsen A. The correlation between cell-free DNA and tumour burden was estimated by PET/CT in patients with advanced NSCLC. Br J Cancer. 2014; 110:363-368.
29. Yip SS, Kim J, Coroller T, Parmar C, Rios Velazquez E, Huynh E, Mak R, Aerts HJ. Associations between somatic mutations and metabolic imaging phenotypes in non-small cell lung cancer. J Nucl Med. 2016.
30. Chen HH, Chiu NT, Su WC, Guo HR, Lee BF. Prognostic value of whole-body total lesion glycolysis at pretreatment FDG PET/CT in non-small cell lung cancer. Radiology. 2012; 264:559-566.
31. Ho TY, Chou PC, Yang CT, Tsang NM, Yen TC. Total lesion glycolysis determined per RECIST 1.1 criteria predicts survival in EGFR mutation-negative patients with advanced lung adenocarcinoma. Clin Nucl Med. 2015; 40:e295-299.
32. Winther-Larsen A, Fledelius J, Sorensen BS, Meldgaard P. Metabolic tumor burden as marker of outcome in advanced EGFR wild-type NSCLC patients treated with erlotinib. Lung Cancer. 2016; 94:81-87.
33. Meng X, Sun X, Mu D, Xing L, Ma L, Zhang B, Zhao S, Yang G, Kong FM, Yu J. Noninvasive evaluation of microscopic tumor extensions using standardized uptake value and metabolic tumor volume in non-small-cell lung cancer. Int J Radiat Oncol Biol Phys. 2012; 82:960-966.
34. Henriksson E, Kjellen E, Wahlberg P, Ohlsson T, Wennerberg J, Brun E. 2-Deoxy-2-[18F] fluoro-D-glucose uptake and correlation to intratumoral heterogeneity. Anticancer Res. 2007; 27:2155-2159.
35. Aerts HJ, Velazquez ER, Leijenaar RT, Parmar C, Grossmann P, Carvalho S, Bussink J, Monshouwer R, Haibe-Kains B, Rietveld D, Hoebers F, Rietbergen MM, Leemans CR, et al. Decoding tumour phenotype by noninvasive imaging using a quantitative radiomics approach. Nat Commun. 2014; 5:4006.
36. Ma X, Zhu H, Guo H, Han A, Wang H, Jing W, Zhang Y, Kong L, Yu J. Risk factors of brain metastasis during the course of EGFR-TKIs therapy for patients with EGFR-mutated advanced lung adenocarcinoma. Oncotarget. 2016; 7:81906-81917. doi: 10.18632/oncotarget.11918.
37. Hanley JA, McNeil BJ. The meaning and use of the area under a receiver operating characteristic (ROC) curve. Radiology. 1982; 143:29-36.