
INTRODUCTION
Cell cycle deregulation, a fundamental hallmark of cancer, has been recognized as a driving force for cancer proliferation [1, 2]. Cell cycle regulators have been intensively studied as both biomarkers and therapeutic targets. Core regulators, such as p53, p21, p27, pRb, separase cyclin D, cyclin E, Aurora A and Polo-like kinase-1 (Plk1) are aberrantly expressed in various types of cancers, associating with tumor progression and prognosis [3–10]. Above them, Aurora A and Plk1 are key regulators of cell-cycle processes, including mitotic entry, centrosome maturation, spindle assembly and sister chromatid cohesion. Aberrant activation of either Aurora A or Plk1 can promote the development of cancer and they represent promising targets for anticancer therapeutics [10–12].
Bora (also known as C13orf134 and FLJ 22624) is located at Chr13q22.1, a malignant susceptibility locus in cancer [13]. Bora is originally identified as a cell cycle protein interacting with Aurora A in Drosophila [14]. Bora expression is low in G1/S boundary but increases in late S phase, peaks in the G2 phase and is degraded during mitosis [15–17]. Specifically, Bora interacts with Plk1 and controls the accessibility of its activation loop for phosphorylation and activation by Aurora A, thus promote mitotic entry [15, 18, 19]. Low levels of Bora is also required to sustain Plk1 activity during mitosis [20]. Recent studies highlight the role of Bora in G2-M transition, which is critical for the DNA damage dependent checkpoint that guards genomic stability [18, 21–23]. Therefore, the Bora-Aurora A-Plk1 axis is critical for coordinating cell cycle progression and genomic stability, two key processes that are involved in cancer initiation and progression. However, the expression and the clinicopathological significance of Bora in cancer remains unclear.
In the present study, we examined Bora expression and its clinicopathological significances in breast, lung and gastric adenocarcinomas. We found that cell cycle protein Bora was highly expressed in primary breast cancer tissues compared to paired non-cancerous tissues. Further analysis indicated that high expression of Bora was associated with poor overall survival and disease-free survival in breast, lung and gastric adenocarcinomas. Moreover, Bora overexpression was associated with poor prognosis in distinct clinical stages (II/III) and subtypes (HR+, HER2+) of breast cancer. Multivariate analysis further demonstrated that high expression of Bora was an independent prognostic parameter for both OS and DFS in all the three types of adenocarcinomas.
RESULTS
Bora was overexpressed in breast cancer tissues and enhanced cell proliferation
To determine whether Bora was aberrantly expressed in cancer, we compared Bora expression in paired breast cancer and non-cancerous tissues. In all the six paired samples, Bora was highly expressed in breast cancer tissues compared with paired non-cancerous tissues (Figure 1A). Immunohistochemistry (IHC) staining of Bora in breast cancer tissues indicated that Bora was overexpressed in the cytoplasm of the breast cancer cells (Figure 1B, b2). Furthermore, High expression of Bora was positively correlated with Ki67 the index of cell proliferation (Figure 1C). In conclusion, Bora was overexpressed in breast cancer and associated with cancer proliferation.
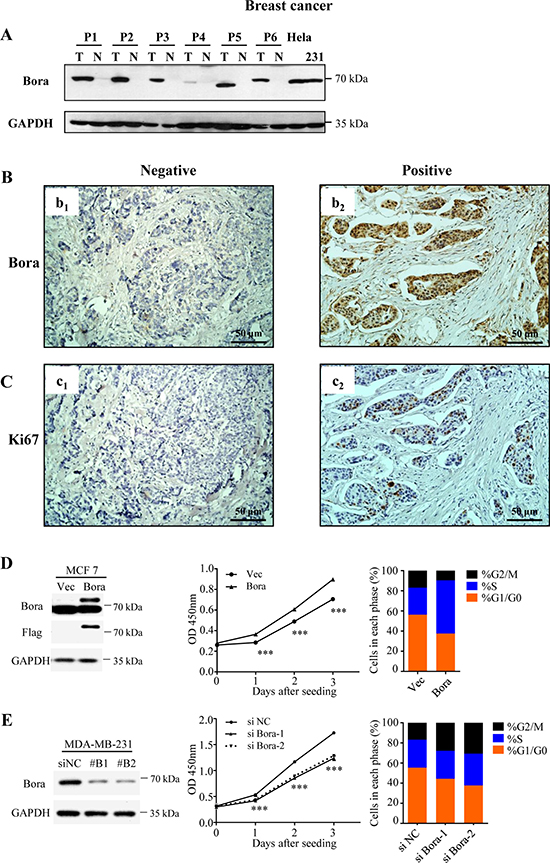
Figure 1: Bora was overexpressed in breast cancer tissues and enhanced cell proliferation. (A) Western blotting analysis of Bora expression in representative primary breast cancer tissues (T) and normal breast tissues (N). GAPDH was used as a loading control. Lysates of Hela and MDA-MB-231 cells were served as positive controls. (B and C) Representative immunohistochemical (IHC) staining for Bora (B) and Ki67 (C) in breast cancer tissues. Scale bars, 50 μm. (D) Empty vector (Vec) or Flag-Bora (Bora) overexpressed MCF-7 cells were collected for western blotting analysis (Left). Cell proliferation was assessed every day for 3 days using CCK-8 assays. Results were shown as the mean ± S.D. from three independent experiments. ***P < 0.0001, two-sided t test (Middle). And the cell-cycle parameters were analyzed by flow cytometry (Propidium iodide). Data were shown as the mean value of three independent experiments (Right). (E) MDA-MB-231 cells were transfected with control (siNC) or two siRNAs against Bora (siBora-1 and -2). Depletion efficiency was validated by Western blot (Left). Cell proliferation after siRNA transfection was assessed every day for 3 days using CCK-8 assays. Results were shown as the mean ± S.D. from three independent experiments. ***P < 0.0001, one-way ANOVA (Middle). And the cell cycle was analyzed at 48 h after transfection. Data were shown as the mean value of three independent experiments (Right).
We then examined the functional association of Bora and cell proliferation. Consistently, we found that overexpression of Bora (Figure 1D, Left) in MCF-7 cells increased p-Plk1 (Supplementary Figure 1A) and enhanced cell proliferation (Figure 1D, Middle). Whereas knockdown of Bora (Figure 1E, Left) in MDA-MB-231 cells significantly reduced cell proliferation (Figure 1E, Middle). Flow cytometric analysis indicated that Bora overexpression in MCF-7 cells resulted in a significant decrease of cells in G0/G1 phase, and a substantial increase of cells in S phase (Figure 1D, Right). In contrast, knockdown of Bora in MDA-MB-231 cells resulted in cell cycle arrested in G2/M phase (Figure 1E, Right). Interestingly, TUNEL assay indicated that neither overexpression nor knockdown of Bora caused DNA damage (Supplementary Figure 1B). Thus, Bora was functionally involved in cell cycle process and enhanced proliferation in breast cancer cells.
Systematic analyses of Bora expression and clinical features
To examine the clinical relevance of Bora in breast cancer, the clinical features, including age, clinical stage, tumor classification, node classification, P53 and Ki67 were analysed with Bora expression in breast cancer (Table 1). Breast cancer patients were classified into high (283/538, 52.60%) and low (255/538, 47.40%) expression subgroups according to the cut-off score by Receiver Operating Characteristic (ROC) curve analysis. Bora expression was positively correlated with Ki67 level (P < 0.001) and molecular subtypes (P < 0.001), but not other clinical characteristics. Detailed analysis was performed in breast cancer subtypes defined by IHC: HR+ (ER+ and/or PR+ and Her2-), HER2+ and TNBC (ER- and PR- and HER2-) [24]. High expression of Bora was found at a higher proportion in TNBC (77.63%) compared with non-TNBC (42.76%, P < 0.001) subtypes.
Table 1: Bora expression and patients’ characteristics
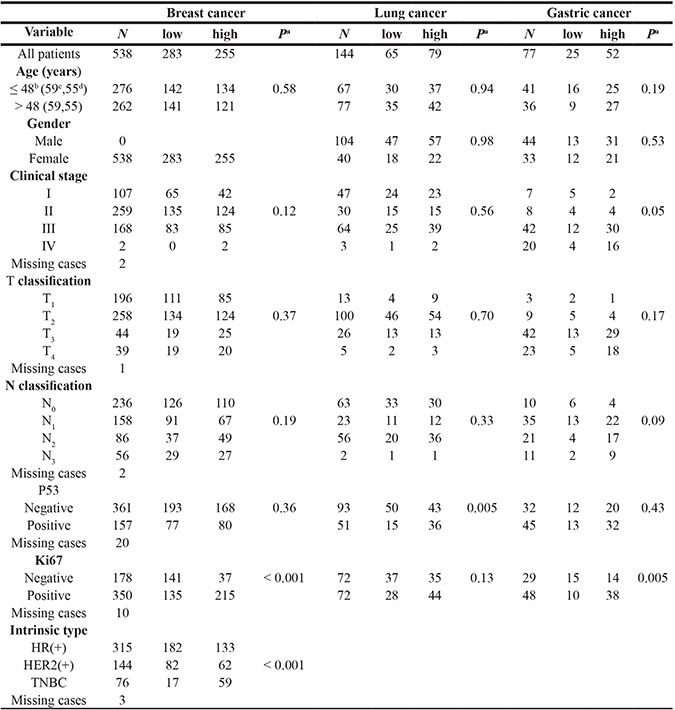
aChi-square test, bmedian age in breast cancer, cmedian age in lung cancer, dmedian age in gastric cancer.
High Bora expression indicated poor survival outcome in breast cancer
To assess the clinical significance of Bora in breast cancer, survival analysis was carried out in the cohort of breast cancer (n = 538). ROC curve analysis was employed to determine cut-off point for Bora expression in overall survival (OS) and disease free survival (DFS) analysis (Figure 2A and 2B, respectively). We set Bora expression score 5 (≥ 5 VS. < 5) as the cut-off for OS (4.83, P < 0.0001) and DFS (4.72, P = 0.001). Patients with high Bora expression showed a significantly worse prognosis for both OS and DFS than those with low expression (P < 0.0001, Figure 2C; P = 0.007, Figure 2D). These results indicated that Bora predicted poor prognosis in breast cancer.
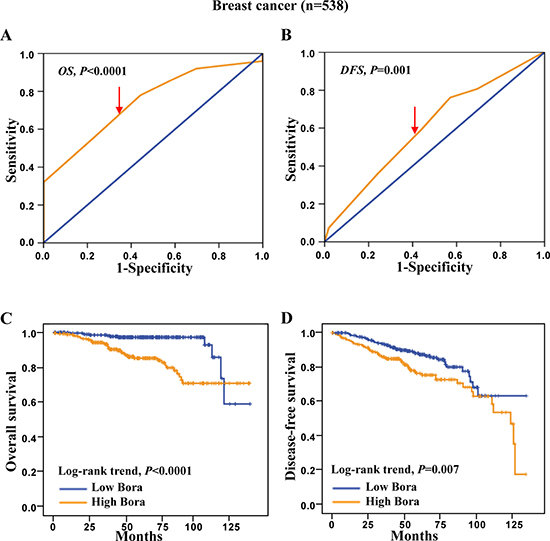
Figure 2: ROC curves and Kaplan-Meier survival analysis in breast cancer. (A and B) Bora cut-off point for overall survival (A) and disease-free survival (B) in breast cancer. Bora cut-off score for overall survival and disease-free survival was 4.83 and 4.72, respectively. (C and D) Kaplan-Meier curves for overall survival (C) and disease-free survival (D) of breast cancer patients according to Bora expression status. The P-values were determined using the log-rank test.
Bora significance in clinical stages and subtypes of breast cancer
To further analyze the significance of Bora in breast cancer subsets, we performed survival analysis in different clinical stages. We excluded the stage I and IV subsets due to the high survival rate (107/107, 100%) of stage I and limited case number (N = 2) of stage IV patients. The results showed that high Bora expression was significantly associated with poor OS (P = 0.021, Figure 3A), but not DFS (P = 0.210, Figure 3B) in stage II patients. In contrast, high expression of Bora indicated significantly poor outcomes in both OS (P < 0.0001, Figure 3C) and DFS (P = 0.039, Figure 3D) of stage III patients.
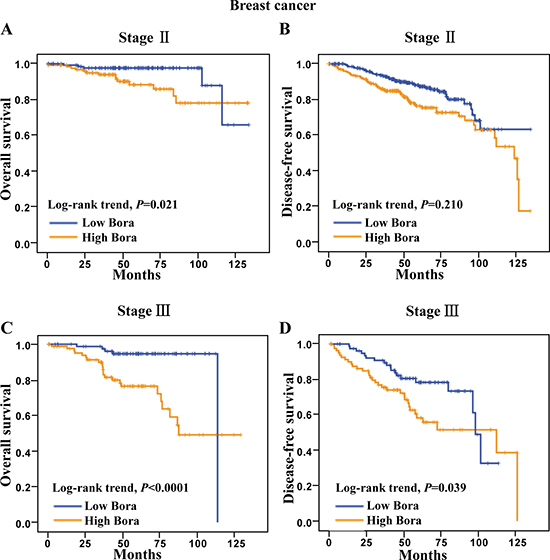
Figure 3: Survival analysis of Bora in clinical stage II and III breast cancer patients. (A and B) Kaplan-Meier curves for overall survival (A) and disease-free survival (B) of breast cancer patients in clinical stage II. (C and D) Kaplan-Meier curves for overall survival (C) and disease-free survival (D) of breast cancer patients in clinical stage III. The P-values were determined by the log-rank test.
We next determined the clinical significance of Bora in distinct molecular subtypes (HR+, HER2+ and TNBC) of breast cancer [24]. We found that high Bora expression was associated with poor clinical outcomes in both HR+ and HER2+ subtypes, but not TNBC. Specifically, high Bora expression indicated significantly poor OS (P <0.0001, Figure 4A) and DFS (P=0.044, Figure 4B) in HR+ patients. In HER2+ breast cancer patients, high expression of Bora was associated with poor OS (P=0.028, Figure 4C) but not DFS (P = 0.180, Figure 4D). However, Bora did not serve as a prognostic factor in TNBC (data not shown), and larger case numbers might be needed to address this issue. These results indicated that Bora predicted poor prognosis in distinct breast cancer subtypes.
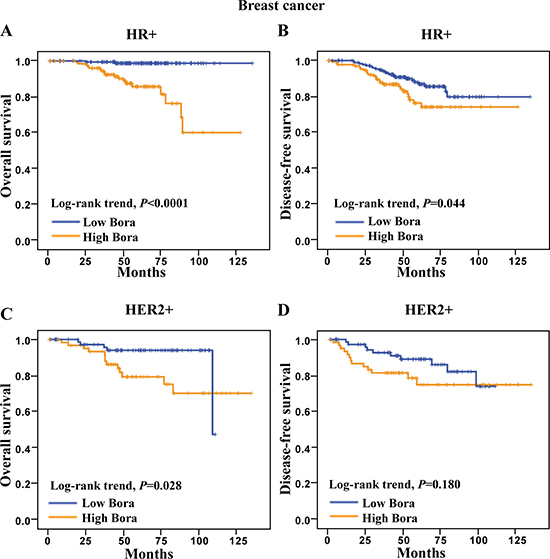
Figure 4: Survival analysis of Bora in HR+ and HER2+ breast cancer patients. (A and B) Kaplan-Meier curves for overall survival (A) and disease-free survival (B) of HR+ breast cancer patients. (C and D) Kaplan-Meier curves for overall survival (C) and disease-free survival (D) of HER2+ breast cancer patients. The P-values were determined by the log-rank test.
High bora expression indicated poor survival outcome in lung adenocarcinoma
To study the clinical significance of Bora in lung cancer, we examined Bora expression in lung adenocarcinoma. The expression of Bora (Figure 5A) and Ki67 (Figure 5B) was positively correlated. Patients were defined as high (79/144, 54.86%) and low Bora (65/144, 45.14%) expression subgroups based on the ROC-derived Bora cut-off score 3 for both OS (2.75, P < 0.0001, Figure 5C) and DFS (2.70, P = 0.001, Figure 5D). Correlation analysis demonstrated that Bora expression was positively correlated with P53 level (P = 0.005, Table 1). The percentage of high Bora expression in Ki67 positive lung cancer group (44/72, 61.11%) was higher than that of Ki67 negative group (35/72, 48.61%). Furthermore, patients with high Bora expression exhibited significantly worse OS (P = 0.005, Figure 5E) and DFS (P = 0.001, Figure 5F) than those with low Bora expression. These results indicated that Bora was also an adverse prognostic factor for lung adenocarcinoma.
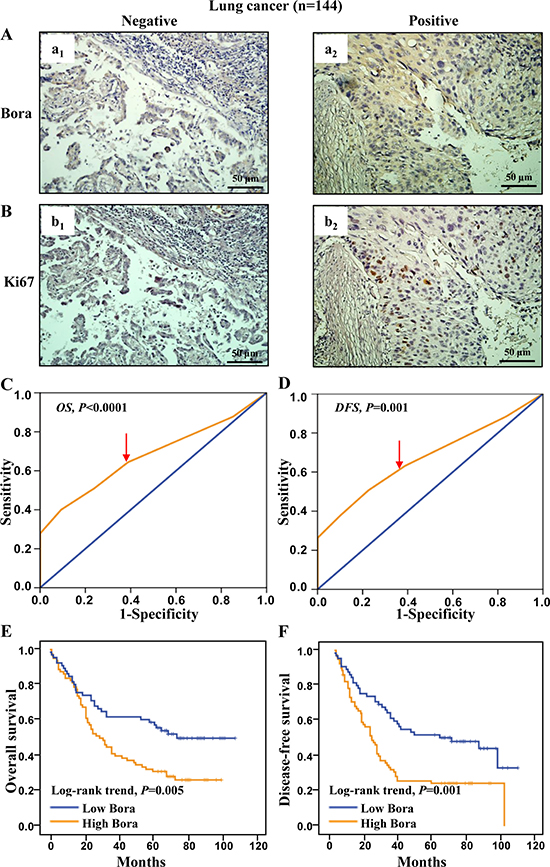
Figure 5: Bora expression and survival analysis in lung cancer. (A and B) Representative IHC staining for Bora (A) and Ki67 (B) in lung cancer tissues. Scale bars, 50 μm. (C and D) Bora cut-off point for overall survival (C) and disease-free survival (D) in lung cancer. Bora cut-off score for overall survival and disease-free survival were 2.75 and 2.70, respectively. (E and F) Kaplan-Meier curves for overall survival (E) and disease-free survival (F) of lung cancer patients according to Bora expression. The P-values were determined by the log-rank test.
Bora expression and survival analysis in gastric cancer
We further assessed the clinical significance of Bora in gastric adenocarcinoma. Consistent with the results in breast cancer, the expression of Bora (Figure 6A) and Ki67 (Figure 6B) was positively correlated. Patients were grouped into high (cut-off score 5, 52/77, 67.53%) and low (25/77, 32.47%) Bora expression subsets according to the ROC-based analyses for OS (4.83, P < 0.0001, Figure 6C) and DFS (4.72, P = 0.004, Figure 6D). Correlation analysis demonstrated that Bora expression was positively correlated with Ki67 level (P = 0.005, Table 1) as well as advanced clinical stage (marginal P=0.05, Table 1). Patients with high expression of Bora were associated with poor OS (P < 0.0001, Figure 6E) and DFS (P < 0.0001, Figure 6F) compared to those with low Bora expression, indicating that Bora was an adverse prognostic factor for gastric cancer.
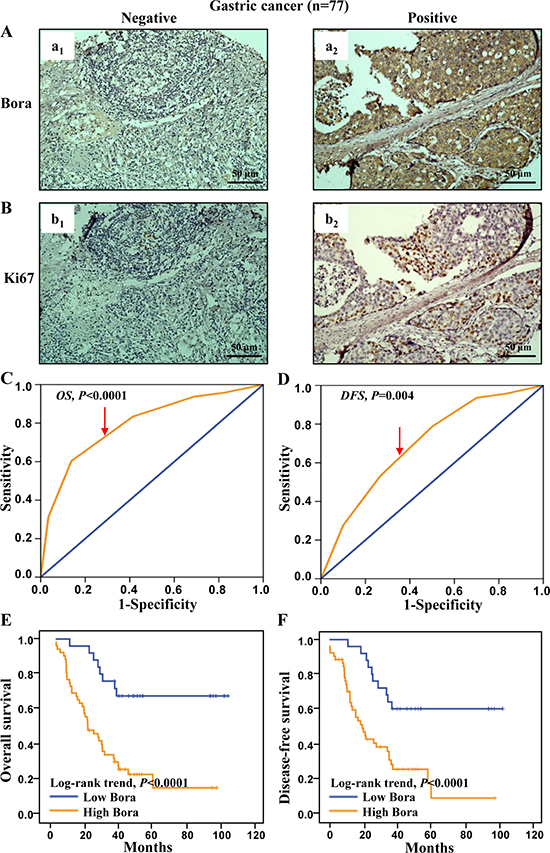
Figure 6: Bora expression and survival analysis in gastric cancer. (A and B) Representative IHC staining for Bora (A) and Ki67 (B) in gastric cancer tissues. Scale bars, 50 μm. (C and D) Bora cut-off point for overall survival (C) and disease-free survival (D) in gastric cancer. Bora cut-off score for overall survival and disease-free survival were 4.85 and 4.95, respectively. (E and F) Kaplan-Meier curves for overall survival (E) and disease-free survival (F) of gastric cancer patients according to Bora expression. The P-values were determined by the log-rank test.
Multivariate analysis and clinical outcome in three types of adenocarcinomas
To avoid the bias caused by univariate analysis, multivariate Cox analysis was performed in in three types of adenocarcinomas (Tables 2–4). Specifically, significant clinical factors for OS were tumor size and clinical stage (P = 0.011 and 0.009, respectively), whereas tumor size (P = 0.003), clinical stage (P = 0.009), PR (P = 0.001) and Ki67 (P = 0.042) were significant factors for DFS in breast cancer. Bora was indeed an independent factor to predict the poor prognosis for both OS (HR: 4.317, CI: 2.147 to 8.680, P < 0.001) and DFS (HR: 1.686, CI: 1.131 to 2.511, P = 0.010) in breast cancer (Table 2). Both clinical stage (P < 0.001) and Ki67 (P = 0.001 for OS, P = 0.020 for DFS) were linked to OS and DFS in lung adenocarcinoma. Consistently, Bora was also an independent biomarker for adverse prognosis of OS (HR: 1.838, CI: 1.919 to 2.836, P = 0.006) and DFS (HR: 1.671, CI: 1.088 to 2.565, P = 0.019) in lung adenocarcinoma (Table 3). In addition, Table 4 showed that Bora was an independent biomarker for poor prognosis of OS (HR: 4.360, CI: 2.019 to 9.414, P < 0.001) and DFS (HR: 3.552, CI: 1.698 to 7.431, P = 0.001) in gastric adenocarcinoma. In conclusion, Bora was an independent biomarker for poor prognosis in breast, lung, and gastric adenocarcinomas.
Table 2: Multivariate cox proportional hazard analysis of prognostic variables in breast cancer patients
For Overall Survival |
For Disease-Free Survival |
|||||
|---|---|---|---|---|---|---|
Variable |
HR |
95% CI |
Pa |
HR |
95% CI |
Pa |
Age > 48b (vs. ≤ 48 y) |
0.972 |
0.542 to 1.744 |
0.924 |
0.600 |
0.397 to 0.906 |
0.015 |
Tumor size > 2 (vs. ≤ 2 cm) |
1.986 |
1.174 to 3.359 |
0.011 |
1.772 |
1.216 to 2.581 |
0.003 |
Clinical stage IV + III (vs. II+ I) |
2.304 |
1.236 to 4.298 |
0.009 |
1.777 |
1.156 to 2.732 |
0.009 |
ER Positive (vs. Negative) |
0.568 |
0.151 to 2.138 |
0.403 |
0.749 |
0.336 to 1.666 |
0.478 |
PR Positive (vs. Negative) |
1.524 |
0.436 to 5.325 |
0.509 |
0.476 |
0.308 to 0.736 |
0.001 |
HER2 Positive (vs. Negative) |
1.807 |
0.936 to 3.486 |
0.078 |
1.109 |
0.671 to 1.834 |
0.686 |
P53 Positive (vs. Negative) |
0.917 |
0.478 to 1.758 |
0.793 |
0.909 |
0.577 to 1.430 |
0.679 |
Ki67 Positive (vs. Negative) |
1.708 |
0.817 to 3.568 |
0.155 |
1.614 |
1.018 to 2.559 |
0.042 |
Bora High expression |
4.317 |
2.147 to 8.680 |
< 0.001 |
1.686 |
1.131 to 2.511 |
0.010 |
alog-rank test, bmedian age; ER, estrogen receptor; PR, progesterone receptor; HER2, human epidermal growth factor receptor 2;
HR, hazard ratio; CI, confidence interval.
Table 3: Multivariate cox proportional hazard analysis of prognostic variables in lung cancer patients
For Overall Survival |
For Disease-Free Survival |
|||||
|---|---|---|---|---|---|---|
Variable |
HR |
95% CI |
Pa |
HR |
95% CI |
Pa |
Age > 59b (vs. ≤ 59 y) |
1.283 |
0.834 to 1.975 |
0.257 |
1.120 |
0.738 to 1.699 |
0.594 |
Gender Female (vs. Male) |
0.657 |
0.400 to 1.077 |
0.096 |
0.792 |
0.494 to 1.272 |
0.336 |
Clinical stage IV + III (vs. II + I) |
2.813 |
1.811 to 4.369 |
< 0.001 |
2.564 |
1.672 to 3.932 |
< 0.001 |
P53 Positive (vs. Negative) |
1.011 |
0.643 to 1.590 |
0.961 |
1.288 |
0.830 to 1.998 |
0.259 |
Ki67 Positive (vs. Negative) |
2.157 |
1.379 to 3.374 |
0.001 |
1.661 |
1.085 to 2.542 |
0.020 |
Bora High expression |
1.838 |
1.919 to 2.836 |
0.006 |
1.671 |
1.088 to 2.565 |
0.019 |
alog-rank test, bmedian age; HR, hazard ratio; CI, confidence interval.
Table 4: Multivariate cox proportional hazard analysis of prognostic variables in gastric cancer patients
For Overall Survival |
For Disease-Free Survival |
|||||
|---|---|---|---|---|---|---|
Variable |
HR |
95% CI |
Pa |
HR |
95% CI |
Pa |
Age > 55 b (vs. ≤ 55 y) |
1.564 |
1.823 to 2.971 |
0.172 |
1.343 |
0.695 to 2.597 |
0.381 |
Gender Female (vs. Male) |
1.627 |
0.888 to 2.981 |
0.115 |
1.724 |
0.926 to 3.210 |
0.086 |
Clinical stage IV + III (vs. II+ I) |
2.950 |
1.242 to 7.005 |
0.014 |
1.319 |
0.580 to 3.003 |
0.509 |
P53 Positive (vs. Negative) |
0.890 |
0.472 to 1.678 |
0.718 |
1.189 |
0.624 to 2.266 |
0.599 |
Ki67 Positive (vs. Negative) |
1.427 |
0.670 to 3.040 |
0.356 |
1.054 |
0.520 to 2.133 |
0.885 |
Bora High expression |
4.360 |
2.019 to 9.414 |
< 0.001 |
3.552 |
1.698 to 7.431 |
0.001 |
alog-rank test, bmedian age; HR, hazard ratio; CI, confidence interval.
DISCUSSION
We have made novel findings in the present study (1) Bora was highly expressed in breast cancer tissues, compared to paired non-cancerous tissues. (2) Patients with high Bora expression displayed poor OS and DFS in breast, lung and gastric adenocarcinomas. (3) High expression of Bora was positively correlated with the cell proliferation index Ki67. (4) Bora was associated with poor prognosis in breast cancer patients of distinct clinical stages II/III and subtypes (HR+, HER2+). (5) Bora expression was an independent prognostic parameter for OS and DFS in all three types of adenocarcinomas. Taken together, our findings provide evidence that high Bora expression indicate poor prognosis in breast, lung and gastric adenocarcinomas.
As a key cell cycle protein, Bora facilitates the recovery of G2/M phase checkpoint through Aurora A mediated phosphorylation and activation of Plk1 kinase [15, 18]. The G2/M checkpoint prevents cells from entering mitosis upon DNA damage, providing an opportunity for DNA damage repairing [25]. Our results showed that Bora was highly expressed in primary breast cancer tissues compared to non-cancerous tissues. Particularly, a higher proportion of Bora expression was observed in TNBC subtype, which displayed significantly higher rates of local and distant recurrence [26]. In addition, high expression of Bora was positively correlated with the cell proliferation index Ki67, enhancing cell proliferation and cell cycle progression. Our data demonstrated that the cell cycle protein Bora was overexpressed in cancer tissues and associated with adverse clinical outcomes.
Currently, little is known about the potential prognostic biomarkers across multiple adenocarcinomas. Here, Bora serves as a potential biomarker for poor prognosis across three types of adenocarcinomas. High expression of Bora was associated with poor outcome independent of known prognostic markers in breast, lung and gastric adenocarcinomas. In addition, high expression of Bora predicted poor OS and DFS in breast cancer patients with HR+ or HER2+, indicating that Bora could be a novel prognosis factor in addition to ER, PR and HER2 to accurately stratify patients. These findings hold significant clinical application in predicting prognosis and identifying high risk patients, and promote future studies in exploring Bora as a therapeutic target in cancer.
Recently, a large number of inhibitors for Aurora A and Plk1 kinases are being evaluated as anticancer drugs in Phase I or Phase II clinical trials, such as Aurora A kinase inhibitors: MLN8054 (Phase I), MLN8237 (Phase II), ENMD-2076 (Phase II), MP529 (preclinical) and Plk1 inhibitors: BI2536 (Phase II), BI6727 (Phase II), GSK-461364 (Phase I) [27]. However, both kinase inhibitors only showed modest bioactivity against solid tumors [28, 29]. Thus, it’s urgently needed to identify novel candidate biomarkers and targets that can enhance the efficacy of existing Aurora A or Plk1 inhibitors. Bora, which links these two kinases to promote cell cycle progression [18], might serve as a potential candidate. Indeed, Bora deletion greatly reduces phosphorylation of Plk1 by Aurora A, reduces the inter-kinetochore tension and activates the tension-sensitive spindle checkpoint [14, 15], leading to cell cycle arrest or mitotic delay [16, 17]. Our study showed that Bora was overexpressed in multiple adenocarcinomas, knockdown of Bora impaired cell proliferation and arrested cell cycle in G2/M phase. Further studies are required to evaluate the anti-tumor effects of Aurora A and Plk1 inhibitors after Bora blockade.
In conclusion, to our knowledge, this is the first study reporting that Bora was an independent biomarker for adverse overall survival and disease-free survival in breast, lung and gastric adenocarcinomas. Bora, a critical player of the Aurora A-Bora-Plk1 axis in controlling cell cycle progression, is a candidate prognostic biomarker and potential therapeutic targets in cancer.
MATERIALS AND METHODS
Patients and eligibility
Formalin-fixed and paraffin-embedded tissues from 538 breast cancer patients, 144 lung cancer patients and 77 gastric cancer patients, who underwent initial surgical resection between 1999 and 2007, were randomly selected from the Department of Pathology, Cancer Center and the Second Affiliated Hospital of Sun Yat-sen University (Guangzhou, China). Patients satisfying the following criteria were selected to participate: (1) over 5-year follow up period; (2) microscopically confirmed adenocarcinoma; (3) no prior radiation therapy history; (4) receiving unified regimen as first-line chemotherapy after resection of primary tumors. All tumors were classified and staged according to the revised guidelines advocated by the International Union against Cancer. Demographic and detailed clinical characteristics of all patients were presented in Table 1. The follow-up deadline was summarized in January 2012 (OS was defined as the time from diagnosis to the date of death or when censused at the latest date if patients were still alive; DFS was defined as the time from diagnosis to the date of local failure/distant metastasis or the date of death or when censused at the latest date). The study obtained informed consent from all patients at their recruitment time and approval from the Institute Research Ethics Committee of Sun Yat-sen University.
Tissue microarrays
Construction of tissue microarrays (TMAs) were performed as previously described [30]. Briefly, the formalin-fixed, paraffin-embedded tissue blocks and the corresponding histological H&E stained slides were overlaid for tissue TMA sampling. In view of tumor heterogeneity, triplicate 0.6mm-diameter cylinders of tissue were punched from selected tumor areas of individual donor tissue block and re-embedded into a recipient paraffin block at defined position, using a tissue arraying instrument (Beecher Instruments, Silver Spring, MD). The TMA block contained 538 breast cancer samples, 144 lung cancer samples and 77 gastric cancer samples. Subsequently, multiple sections (5μm thick) were cut from the TMA block and mounted on microscope slides. H&E staining was used to one section from the tissue array to confirm that the punches contained tumor region.
Immunohistochemistry
The IHC studies of ER, PR, HER2, Ki67, P53 and Bora were performed using a standard of two-step technique. The TMA slides were dried at 65°C for 4h, dewaxed in xylene, rehydrated through graded alcohol, and immersed in 3% hydrogen peroxide for 20 min to block endogenous peroxidase activity. An antigen retrieval process was accomplished in a microwave oven with 10 M citrate buffer (pH 6.0), for 15 min. The slides were incubated with 3% bovine serum albumin at room temperature (RT) for 30 min to reduce nonspecific reaction. Subsequently, the TMA slides were incubated with the antibody against ER (monoclonal rabbit; 1:100; Thermo, SP1), PR (monoclonal mouse; 1:100; Dako, PgR 636), HER2 (monoclonal rabbit; 1:100; ZA-0023), Ki67 (monoclonal mouse; 1:150; Dako, MIB-1), P53 (monoclonal mouse; 1:500; Dako, clone D07) and Bora (polyclonal rabbit; 1:100; sigma, SAB3500025), overnight at 4°C, respectively. After three times of rinsing with 0.01M phosphate-buffered saline (PBS, pH = 7.4) for 10 minutes, the detection of the primary antibody was achieved with a secondary antibody (Envision, Dako, Denmark) for 30 minutes at RT, and stained with DAB (3,3-diaminobenzidine) after washed in PBS again. Finally, the sections were counterstained with Mayer’s hematoxylin, dehydrated, and mounted. A negative control was obtained by replacing the primary antibody with a normal murine IgG.
Immunohistochemical analysis evaluation
The brown granules in cytoplasm were considered as Bora positive staining. We scored the staining intensity as follows: 0, no staining; 1+, mild staining; 2+, moderate staining; 3+, intense staining. The area of staining was evaluated as follows: 0, no staining of cells in any microscopic fields; 1+, < 25% of tissue stained positive; 2+, 25–50% stained positive; 3+, 50–75% stained positive; 4+, > 75% stained positive. Bora expression was evaluated by combined assessing of staining intensity and extension. The minimum score when summed (intensity + extension) was 0, and the maximum was 7. Two independent pathologists scored each section, and agreement on staining intensity was 89.6% (482/538) in breast cancer, 86.8% (105/144) in lung cancer and 90.9% (70/77) in gastric cancer. The sections that was not concordance were reassessed by both of them.
ER and PR positivity was defined as ≥ 10% positive tumor cells with nuclear staining [31]. HER2+ positivity was defined as IHC scored of 3+ [32]. Cells stained for Ki67 and P53 were counted and expressed as a percentage. The percentage was determined by the number of Ki67 or P53 positive cells among the total number of counted tumor cells. High expression of Ki67 was defined as ≥ 5%, P53 ≥ 10% as previously reported [33].
Cell culture and Western blotting analysis
The breast cancer cell lines (MDA-MB-231 MCF-7), the cervical cancer cell line (Hela) and 293T cells were obtained from American Type Culture Collection. Cells were routinely maintained in high-glucose DMEM (Gibco, C11995) supplemented with 10% fetal bovine serum (Hyclone, SV30087.02), penicillin (100 units/mL; Sigma, P3032), and streptomycin (100 units/mL; Sigma, S9137) at 37°C in humidified 5% CO2 incubator. The expression of Bora in breast cancer and paired non-cancerous tissues was performed by western blot as previously reported [34].
Tissues and cells were lysed in RIPA buffer (50mM Tris pH 7.4, 150 mM NaCl, 1% NP-40, 0.5% sodium deoxycholate, 0.1% SDS, 1 mM phenylmethyl sulfonyl fluoride) containing protease inhibitor cocktail (Roche) and phosphatase inhibitor cocktail (Sigma-Aldrich). The protein concentration was detected by the Bradford method with BSA (Sigma-Aldrich) as the standard. Equal amounts of protein were subjected to SDS-PAGE and transferred to nitrocellulose membranes (Bio-Rad). The membranes were then blocked and incubated with antibodies against GAPDH (1:4000, Abmart, #M20006), Bora (1:1000, sigma, SAB3500025), Flag (1:5000, sigma, F1804), Plk1 (1:500, Santa Cruz Biotechnology, sc-17783), Phospho-Plk1 (Thr210) (1:1000, Cell Signaling Technology, 9062). After that, membranes were incubated with peroxidase-conjugated secondary antibodies (Millipore) and detected with enhanced chemiluminescence (Millipore) on X-ray films (Kodak).
Plasmids, lentivirus production and transduction
pLVX-Flag (empty vector) was constructed by replacing DsRed gene in pLVX-DsRed-N1-Monomer (Clontech) with Flag sequence. Bora CDS was amplified from MDA-MB-231 cells and inserted into pLVX-Flag to construct pLVX-Bora-Flag. Lentivirus was produced in 293T cells using the second-generation packaging system plasmids psPAX2 (Addgene) and pMD2.G (Addgene) with Lipofectamine 2000. Infectious lentiviruses were collected at 48 h after transfection and filtered through 0.45-μm PVDF filters. MCF-7 cells were infected with concentrated virus in the presence of polybrene (8μg/ml, Sigma-Aldrich). The supernatant was replaced with complete culture medium after 24h, followed by selection with puromycin (2μg/ml), and the expression of Bora in infected cells was verified by western blot.
RNA interference
siRNA oligonucleotides targeting Bora and non-targeting siRNA were purchased from GenePharma. Transfections with siRNA were performed with Lipofectamine 2000. The siRNAs against Bora were (1) 5′-CTATGAGACTTCAGATGTA-3′ and (2) 5′-TAACTAGTCCTTCGCCTAT-3′. The control siRNA (siNC) was 5′-TTCTCCGAACGTGTCACGGTT-3′.
Synchronization
Cells were synchronized at prometaphase by a thymidine-nocodazole arrest (TN; a 18-hr thymidine arrest and a 5-hr release, followed by a 14-hr nocodazole arrest), then protein was extracted to detect the expression of Phospho-Plk1 (Thr210). Thymidine, 2.5 mM; Nocodazole, 100 ng/ml.
Cell cycle and cell proliferation analysis
For cell cycle analysis, cells were collected and fixed in 70% ethanol overnight at 4°C. Fixed cells were incubated with 50 mg/mL propidium iodide and 100 mg/mL RNase at 37℃ for 30 minutes and then analyzed by flow cytometry (Beckman Coulter).
For cell proliferation analysis, cells were seeded in 96-well flat-bottomed plates, with each well containing 1,000 cells in 100 μl of cell suspension. After a certain time in culture, cell viability was measured using Cell Counting Kit-8 (CCK-8) assays (Dojindo). Each experiment with five replicates was repeated three times.
TUNEL assay
Cells were grown on glass coverslips, fixed with 4% paraformaldehyde solution and permeabilized with Triton X-100 (1%). For TUNEL assay, DNA strand breaks were detected with a TUNEL assay kit (KeyGEN BioTECH, KGA7051) according to the manufacturer’s instructions. Nuclei were stained with DAPI. Merged images were counted under a confocal laser scanning microscope (OLYMPUS FV1000).
Statistical analysis
Statistical analysis was performed using the SPSS software (SPSS standard version 16.0; SPSS Inc, Chicago, IL). The chi-square test was employed to evaluate the relationship between Bora and clinicopathologic characteristics. ROC curve analysis was performed to compare the sensitivity and specificity for the prediction of survival as described previously [35]. The relationship between Bora expression and survival was determined by Kaplan-Meier analysis. The log-rank tests were performed to evaluate the difference in survival probabilities between patient subsets. The Multivariate Cox proportional hazard models were utilized to estimate the Hazard Ratio (HR) and 95% confidence intervals (CI) for patient outcome. The comparison of means between two groups was conducted using Student’s t test, whereas comparison for more than two groups was conducted using one-way ANOVA. All P values quoted were two-tailed and P < 0.05 was considered statistically significant.
Authors’ contributions
Qiong-Xia Zhang and Rui Gao participated in immunohistochemistry, data analysis and manuscript preparation for the entire project. Jin Xiang, Zhong-Yu Yuan participated in the collection of adenocarcinoma samples and immunohistochemistry scoring. Yuan-Min Qian participated in molecular experiments. Min Yan, Zi-Feng Wang participated in manuscript editing and made critical revisions. Chang-Hong Liu, Hai-Dong Zhao and Quentin Liu participated in design and data analysis in the whole project and made critical revisions in the manuscript.
ACKNOWLEDGMENTS
The authors thank the other members of the Quentin Liu lab for their critical comments and technical support.
CONFLICTS OF INTEREST
The authors have declared that no competing interests exist.
FUNDING
The work was supported by the National Natural Science Foundation of China (81630005, 81130040 and 81573025 to Q.L., 81301734 to Z.W.), the Science and Technology Planning Project of Guangzhou (No.201604020163 to Q.L.), Innovative Research Team in University of Ministry of Education of China (No. IRT13049 to Q.L.), Natural Science Foundation of Guangdong (2016A030311038 to Q.L.), Sister Institution Network Fund (SINF, 2012 to Q.L.), Basic Scientific Research Fund of Sun Yat-sen University (14ykpy41 to Z.W.).
REFERENCES
1. Malumbres M, Barbacid M. Cell cycle, CDKs and cancer: a changing paradigm. Nat Rev Cancer. 2009; 9:153–166.
2. Hanahan D, Weinberg RA. Hallmarks of cancer: the next generation. Cell. 2011; 144:646–674.
3. Dowell SP, Wilson PO, Derias NW, Lane DP, Hall PA. Clinical utility of the immunocytochemical detection of p53 protein in cytological specimens. Cancer Res. 1994; 54:2914–2918.
4. Tsihlias J, Kapusta L, Slingerland J. The prognostic significance of altered cyclin-dependent kinase inhibitors in human cancer. Annu Rev Med. 1999; 50:401–423.
5. Sherr CJ. Cancer cell cycles. Science. 1996; 274: 1672–1677.
6. Meyer R, Fofanov V, Panigrahi A, Merchant F, Zhang N, Pati D. Overexpression and mislocalization of the chromosomal segregation protein separase in multiple human cancers. Clin Cancer Res. 2009; 15:2703–2710.
7. Kim SH, Lewis JJ, Brennan MF, Woodruff JM, Dudas M, Cordon-Cardo C. Overexpression of cyclin D1 is associated with poor prognosis in extremity soft-tissue sarcomas. Clin Cancer Res. 1998; 4:2377–2382.
8. Keyomarsi K, Tucker SL, Buchholz TA, Callister M, Ding Y, Hortobagyi GN, Bedrosian I, Knickerbocker C, Toyofuku W, Lowe M, Herliczek TW, Bacus SS. Cyclin E and survival in patients with breast cancer. N Engl J Med. 2002; 347:1566–1575.
9. Strebhardt K, Ullrich A. Targeting polo-like kinase 1 for cancer therapy. Nat Rev Cancer. 2006; 6:321–330.
10. Yan M, Wang C, He B, Yang M, Tong M, Long Z, Liu B, Peng F, Xu L, Zhang Y, Liang D, Lei H, Subrata S, et al. Aurora-A Kinase: A Potent Oncogene and Target for Cancer Therapy. Med Res Rev. 2016; 36:1036–1079.
11. Archambault V, Glover DM. Polo-like kinases: conservation and divergence in their functions and regulation. Nat Rev Mol Cell Biol. 2009; 10:265–275.
12. Medema RH, Lin CC, Yang JC. Polo-like kinase 1 inhibitors and their potential role in anticancer therapy, with a focus on NSCLC. Clin Cancer Res. 2011; 17:6459–6466.
13. Rozenblum E, Vahteristo P, Sandberg T, Bergthorsson JT, Syrjakoski K, Weaver D, Haraldsson K, Johannsdottir HK, Vehmanen P, Nigam S, Golberger N, Robbins C, Pak E, et al. A genomic map of a 6-Mb region at 13q21-q22 implicated in cancer development: identification and characterization of candidate genes. Hum Genet. 2002; 110:111–121.
14. Hutterer A, Berdnik D, Wirtz-Peitz F, Zigman M, Schleiffer A, Knoblich JA. Mitotic activation of the kinase Aurora-A requires its binding partner Bora. Dev Cell. 2006; 11:147–157.
15. Seki A, Coppinger JA, Jang CY, Yates JR, Fang G. Bora and the kinase Aurora a cooperatively activate the kinase Plk1 and control mitotic entry. Science. 2008; 320:1655–1658.
16. Chan EH, Santamaria A, Sillje HH, Nigg EA. Plk1 regulates mitotic Aurora A function through betaTrCP-dependent degradation of hBora. Chromosoma. 2008; 117:457–469.
17. Seki A, Coppinger JA, Du H, Jang CY, Yates JR 3rd, Fang G. Plk1- and beta-TrCP-dependent degradation of Bora controls mitotic progression. J Cell Biol. 2008; 181:65–78.
18. Macurek L, Lindqvist A, Lim D, Lampson MA, Klompmaker R, Freire R, Clouin C, Taylor SS, Yaffe MB, Medema RH. Polo-like kinase-1 is activated by aurora A to promote checkpoint recovery. Nature. 2008; 455:119–123.
19. Tavernier N, Noatynska A, Panbianco C, Martino L, Van Hove L, Schwager F, Leger T, Gotta M, Pintard L. Cdk1 phosphorylates SPAT-1/Bora to trigger PLK-1 activation and drive mitotic entry in C. elegans embryos. J Cell Biol. 2015; 208:661–669.
20. Bruinsma W, Macurek L, Freire R, Lindqvist A, Medema RH. Bora and Aurora-A continue to activate Plk1 in mitosis. J Cell Sci. 2014; 127:801–811.
21. Thomas Y, Cirillo L, Panbianco C, Martino L, Tavernier N, Schwager F, Van Hove L, Joly N, Santamaria A, Pintard L, Gotta M. Cdk1 Phosphorylates SPAT-1/Bora to Promote Plk1 Activation in C. elegans and Human Cells. Cell Rep. 2016; 15:510–518.
22. Bruinsma W, Aprelia M, Garcia-Santisteban I, Kool J, Xu YJ, Medema RH. Inhibition of Polo-like kinase 1 during the DNA damage response is mediated through loss of Aurora A recruitment by Bora. Oncogene. 2016; 36:1840–1848.
23. Qin B, Gao B, Yu J, Yuan J, Lou Z. Ataxia telangiectasia-mutated- and Rad3-related protein regulates the DNA damage-induced G2/M checkpoint through the Aurora A cofactor Bora protein. J Biol Chem. 2013; 288:16139–16144.
24. Desmedt C, Haibe-Kains B, Wirapati P, Buyse M, Larsimont D, Bontempi G, Delorenzi M, Piccart M, Sotiriou C. Biological processes associated with breast cancer clinical outcome depend on the molecular subtypes. Clin Cancer Res. 2008; 14:5158–5165.
25. Dasika GK, Lin SC, Zhao S, Sung P, Tomkinson A, Lee EY. DNA damage-induced cell cycle checkpoints and DNA strand break repair in development and tumorigenesis. Oncogene. 1999; 18:7883–7899.
26. Park YH, Kim ST, Cho EY, Choi YL, Ok ON, Baek HJ, Lee JE, Nam SJ, Yang JH, Park W, Choi DH, Huh SJ, Ahn JS, et al. A risk stratification by hormonal receptors (ER, PgR) and HER-2 status in small (< or = 1 cm) invasive breast cancer: who might be possible candidates for adjuvant treatment? Breast Cancer Res Treat. 2010; 119:653–661.
27. Lens SM, Voest EE, Medema RH. Shared and separate functions of polo-like kinases and aurora kinases in cancer. Nat Rev Cancer. 2010; 10:825–841.
28. Gautschi O, Heighway J, Mack PC, Purnell PR, Lara PN Jr, Gandara DR. Aurora kinases as anticancer drug targets. Clin Cancer Res. 2008; 14:1639–1648.
29. Sebastian M, Reck M, Waller CF, Kortsik C, Frickhofen N, Schuler M, Fritsch H, Gaschler-Markefski B, Hanft G, Munzert G, von Pawel J. The efficacy and safety of BI 2536, a novel Plk-1 inhibitor, in patients with stage IIIB/IV non-small cell lung cancer who had relapsed after, or failed, chemotherapy: results from an open-label, randomized phase II clinical trial. J Thorac Oncol. 2010; 5:1060–1067.
30. Cai MY, Tong ZT, Zhu W, Wen ZZ, Rao HL, Kong LL, Guan XY, Kung HF, Zeng YX, Xie D. H3K27me3 protein is a promising predictive biomarker of patients’ survival and chemoradioresistance in human nasopharyngeal carcinoma. Mol Med. 2011; 17:1137–1145.
31. Keam B, Im SA, Lee KH, Han SW, Oh DY, Kim JH, Lee SH, Han W, Kim DW, Kim TY, Park IA, Noh DY, Heo DS, et al. Ki-67 can be used for further classification of triple negative breast cancer into two subtypes with different response and prognosis. Breast Cancer Res. 2011; 13:R22.
32. Perez EA, Roche PC, Jenkins RB, Reynolds CA, Halling KC, Ingle JN, Wold LE. HER2 testing in patients with breast cancer: poor correlation between weak positivity by immunohistochemistry and gene amplification by fluorescence in situ hybridization. Mayo Clin Proc. 2002; 77:148–154.
33. Millar EK, Graham PH, McNeil CM, Browne L, O’Toole SA, Boulghourjian A, Kearsley JH, Papadatos G, Delaney G, Fox C, Nasser E, Capp A, Sutherland RL. Prediction of outcome of early ER+ breast cancer is improved using a biomarker panel, which includes Ki-67 and p53. Br J Cancer. 2011; 105:272–280.
34. Zhou WH, Tang F, Xu J, Wu X, Yang SB, Feng ZY, Ding YG, Wan XB, Guan Z, Li HG, Lin DJ, Shao CK, Liu Q. Low expression of Beclin 1, associated with high Bcl-xL, predicts a malignant phenotype and poor prognosis of gastric cancer. Autophagy. 2012; 8:389–400.
35. Zlobec I, Steele R, Terracciano L, Jass JR, Lugli A. Selecting immunohistochemical cut-off scores for novel biomarkers of progression and survival in colorectal cancer. J Clin Pathol. 2007; 60:1112–1116.