
INTRODUCTION
Increased use of imaging technique has led to frequent diagnosis of incidental renal masses, especially small ones. For patients who consider active surveillance or non-surgical treatments, renal mass biopsy (RMB) is often recommended to determine the pathological type of renal mass and guide treatment options. The accuracy of RMB depends on multiple factors, including interpretive skill of pathologists, the amount of specimens acquired, inherent sampling error, etc. According to previous studies, the accuracy could fluctuate from 79 to 100% [1–3], and non-diagnostic findings such as fibrosis or necrosis were found to be present in 15–22% cases [4–6]. Besides, RMB has limited accuracy when it comes to tumor grade classification- only 43 to 75% [7]. Thus, a technique that can provide objective evaluation of renal biopsy specimen is urgently needed.
Raman spectroscopy (RS) is a non-destructive optical technique, it relies on the inelastic scattering of photons derived from molecular bond vibrations [8]. When photons interact with molecular bonds, a part of them would change their frequencies to create a process called “Raman shift”. RS is able to reveal the chemical components and molecular structures of materials, and translate the information into a two-dimensional Raman spectrum. And it needs no sample pre-treatment or external labeling, and requires only a few seconds. Previous publications have presented the use of RS to detect the whole mass of renal tumor [9, 10], but no study on Raman’s investigation of biopsy specimen was ever reported. In this context, we mimicked pre-operative RMB by collecting biopsy specimen from surgical removed kidney to determine whether RS is able to distinguish malignant and benign renal tumors, and serve as a complementary diagnostic tool in the future.
RESULTS
Clinical and pathological statistics of the patients were displayed in Table 1. The final pathology included 42 clear cell renal cell carcinomas (RCC), 4 papillary RCC, 4 chromophobe RCC, 7 angiomyolipoma (AML) and 6 oncocytoma (RO). We obtained a total of 388 Raman spectra, 5 spectra were excluded from analysis due to strong fluorescent influence. Thus 383 spectra were eventually sent to Discriminant analysis (DA) (136 normal tissue, 165 clear cell RCC, 14 chromophobe RCC, 16 papillary RCC, 28 AML, 24 RO).
Table 1: Clinical and pathological statistics of patients
Variable |
Value |
|---|---|
No. of specimens |
63 |
Patient gender: |
|
Male |
41 |
Female |
22 |
Patient age, mean, (yr) |
64 (38–82) |
Tumor size, mean, (cm) |
5.2 (2–12) |
Pathology: |
|
Benign, No |
13 |
Angiomyolipoma |
7 |
Oncocytoma |
6 |
Malignant, No |
50 |
Clear-cell |
42 |
Papillary |
4 |
Chromophobe |
4 |
Tumor stage, No. |
|
pT1 |
35 |
pT2 |
15 |
pT3 |
0 |
Nodal invasion, No. |
|
N0 |
48 |
N1 |
2 |
Distant metastases, No. |
|
M0 |
50 |
M1 |
0 |
Tumor grade, No. |
|
1–2 |
45 |
3–4 |
5 |
Characteristic Raman spectra were obtained for different types of renal tissues (Figures 1, 2, 3). The normal renal tissue presented a smooth wave with weak peaks were identified at 1,003 and 1,550 cm−1. RO, papillary RCC and chromophobe had similar spectral profile, but discrepancies existed: RO had no obvious peaks; chromophobe had small peaks at 1,003 and 1,170 cm−1, and three adjacent peaks at 1,500, 1,585, 1,639 cm−1; papillary RCC had similar peaks at 1,003, 1,500, 1,585 and 1,636 cm−1 (not 1,639 cm−1 as that of chromophobe), but a different peak at 1,155 cm−1 was identified. Clear cell RCC and AML both had significantly intensified peaks around 1,003, 1,155 and 1,515 cm−1 (1,518 cm−1 for AML), but clear cell RCC had 4 typical peaks at 2,155, 2,304, 2,512 and 2,658 cm−1, while AML had peaks at 1,303, 1,441, 1,665, 2,853 cm−1 and a flat peak around 2,896 cm−1. The assignments of Raman peaks were displayed in Table 2 [8, 11–15].
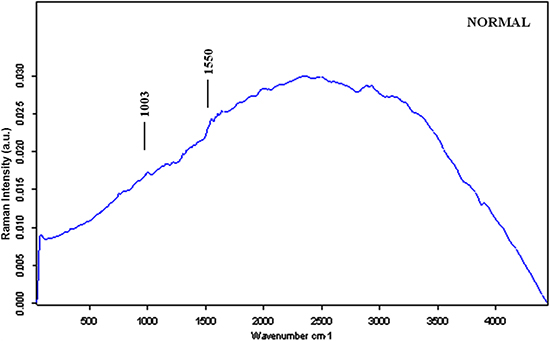
Figure 1: The mean Raman spectra of normal renal tissue.
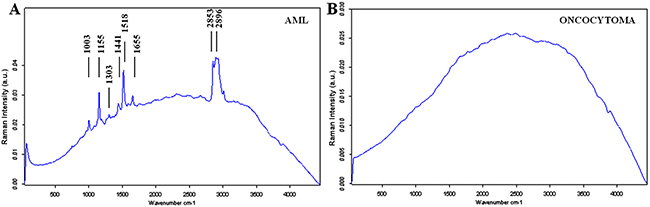
Figure 2: The mean Raman spectra of benign renal tumors. (A) AML; (B) Oncocytoma.
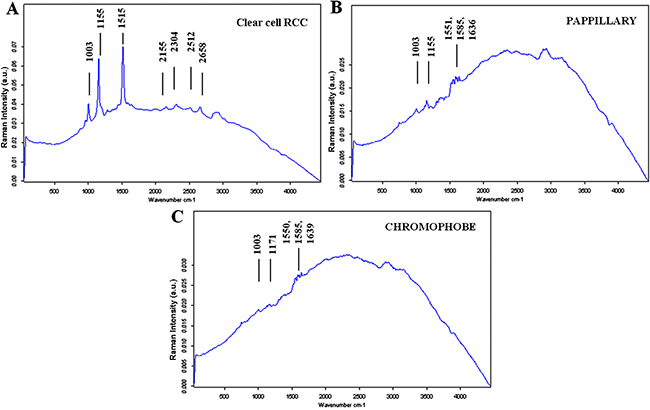
Figure 3: The mean Raman spectra of malignant renal tumors. (A) Clear cell RCC; (B) Papillary RCC; (C) Chromophobe.
Table 2: Raman frequencies and their assignments
Peak position (cm−1) |
Assignments |
|---|---|
1003 |
Protein: Phenylalanine ring breath |
1155~ |
Protein: C-C; C-N Stretching |
1171~ |
Protein: C-H bend |
1303~ |
Lipid, protein, nucleic acid |
1441 |
Lipid: C-H2 deformation |
1515 |
Protein: ß-Carotene C-C Stretching |
1550,1551~ |
Protein: C = C; CN Stretching |
1585 |
Phenylalanine C = C olefinic Stretching |
1636 |
Fatty acid |
1639~ |
Fatty acid |
1665 |
Protein: Amide I |
2155 |
/ |
2304 |
/ |
2512 |
/ |
2658 |
/ |
2854~ |
Lipid |
2896 |
Lipid |
Peaks at 2155, 2304, 2512 and 2658 cm−1 were undefined according to previous studies. One potential explanation would be the “fundamental, combination and overtone mode” [15]. Assuming 1003, 1155 and 1515 cm−1 of clear cell RCC were set as fundamentals U1, U2, U3, then 2155 ≈ 1003 + 1155 (combination U1 + U2), 2304 ≈ 2 × 1155 (overtone 2U2), 2512 ≈ 1003 + 1515 (combination U1 + U3), 2658 ≈ 1155 + 1515 (combination U2 + U3).
DA could identify tumoral and normal renal tissues with an accuracy of 82.53% (sensitivity of 87.85% and specificity of 77.21%): malignant tumors could be distinguished with normal tissues with an accuracy of 84.37% (sensitivity of 81.62% and specificity of 87.11%), and benign tumors could be distinguished with normal tissues with an accuracy of 89.59% (sensitivity of 92.65% and specificity of 86.54%). DA could separate malignant and benign tumors with an accuracy of 81.47% (sensitivity of 91.79% and specificity of 71.15%).
Clear cell RCC as the most common malignant renal tumor could be discriminated with normal tissues with an accuracy of 92.87% (sensitivity of 94.55% and specificity of 91.18%), and be separated with RO and AML with accuracy of 100% (sensitivity/specificity of 100%) and 89.25% (sensitivity of 96.36% and specificity of 82.14%), respectively.
Histological subtypes of RCC (defined as clear cell vs. papillary, chromophobe) were distinguished with an accuracy of 93.48% (sensitivity of 96.95% and specificity of 90.00%).
Low-grade and high-grade tumors could be distinguished with an accuracy of 86.98% (sensitivity of 96.19% and specificity of 77.78%).
Finally, among the 11 cases of missed diagnosis by biopsy, Raman was able to correctly identify 7 of them (Table 3).
Table 3: Raman’s judgment on the “missed” biopsy diagnosis
Final pathology |
Biopsy Diagnosis |
Raman |
|
|---|---|---|---|
1 |
Clear cell RCC |
Fibrosis |
Clear cell RCC |
2 |
Clear cell RCC |
Fibrovascular tissue |
/ |
3 |
Chromophobe |
Fibrosis |
/ |
4 |
Clear cell RCC |
Degenerated tissue |
/ |
5 |
Clear cell RCC |
Degenerated tissue |
Clear cell RCC |
6 |
Clear cell RCC |
Fibrovascular tissue |
Clear cell RCC |
7 |
Clear cell RCC |
Degenerated tissue |
Clear cell RCC |
8 |
Clear cell RCC |
Fibrosis |
Clear cell RCC |
9 |
Clear cell RCC |
Blood Coagulum |
/ |
10 |
Clear cell RCC |
Fibrosis |
Clear cell RCC |
11 |
Clear cell RCC |
Fibrovascular tissue |
Clear cell RCC |
Among the 11 cases of missed diagnosis, fibrosis, fibrovascular and degenerated tissue were mostly reported. Raman was able to correctly identify 7 of them.
DISCUSSION
RS was initially applied in chemistry and gradually evolved to a scientific tool for investigating pathological tissues, it has advantage of providing rapid, non-invasive and even non-contact detection. The first use of RS in urology was documented in 1995 when Feld and his colleagues found that bladder cancer has denser nucleic acid and lower lipid content than normal bladder urothelium [16]. By far, RS has been utilized in detecting renal and prostatic cancers, urinary calculi and malignant cells [17–20]. In the current study, we demonstrated the availability of RS to distinguish different pathological types of renal tumors using biopsy specimens. The results were highlighted by Raman’s ability to discriminate clear cell RCC and RO/AML. RO is the most common benign renal neoplasm which accounts for 3%–7% of all renal lesions [21], its differential diagnosis from clear cell RCC is sometimes hard because their imaging features can overlap on computed tomography [22, 23]. But our study proved that clear cell RCC and RO can be clearly separated by RS. AML was found to have typical peaks at 1,303, 1,441, 2,854 and 2,896 cm−1 corresponding to lipids [8], it complies with the fact that AML has abundant amounts of fat. Besides, it was promising to find that Raman correctly identified 7 of 11 missed diagnoses by biopsy, the reason may have to do with Raman’s high special resolution and sensitivity which enable it to draw information from very tiny amount of tissues, which could hardly be realized by biopsy.
Another advantage of RS resides in its ability to provide chemical components and molecular structures of cells and tissues. Compared to previous studies [9, 10], we first provided characteristic Raman spectrum for each type of renal tumor. These spectra could potentially serve as chemical “fingerprints” and be used for pre-operative diagnosis. Besides, study of materials corresponding to these Raman peaks may provide new insights to the mechanisms of renal tumors.
However, several design limitations existed in our study. First, we collected specimen from surgical removed kidney, this was mainly due to limited cases of RMB performed, and pathological analysis takes priority over laboratory study. Secondly, we used distal renal parenchyma as control group, the reason had to do with the difficulty of getting approval from Institutional Review Board for using normal men’s tissue. Thirdly, the study had a limited population, especially papillary and chromophobe RCC, and we did not further separate fat-poor AML. The population should be expanded in the future to ensure that the findings are reproducible.
This study was performed ex vivo. We are also working on Raman endoscopy system that connects Raman spectroscopy with a probe via optical fiber cable. This probe can pass down the instrument channel of endoscope and allows for real-time intra-operative analysis. We could use it for both pathological diagnosis and resection margin determination. But, the safety of RS still needs strict investigation before final clinical use. Though Raman is deemed as a non-invasive detective method, further studies must be done to ensure that Raman scanning will not cause any DNA damage to normal renal tissues.
In conclusion, this study was the first to evaluate renal biopsy specimen using Raman spectroscopy, and provided characteristic Raman spectrum for each type of tumor. Raman is able to distinguish malignant and benign tumors at a high accuracy without adding external labeling, and the spectra have potential to be used as “biomarkers” for pre-operative analysis. Raman may become a novel diagnostic approach and complements to RMB in the future to improve diagnostic accuracy.
MATERIALS AND METHODS
Specimens
This study was approved by Institutional Review Board (IRB) of Huashan Hospital, Fudan University. All patients were informed of the aim of this study, and signed the consent form. Between March and July 2015, 63 renal operations were performed in our urological center, including 34 radical nephrectomies and 29 partial nephrectomies. The surgeries were completed with an open access in 12 patients and laparoscopically in 51 patients. After removal of kidneys, renal masses suspicious of cancers were collected using an 18-gauge biopsy needle (GALLINI S.R.L., Italy), distal renal parenchymas from radical nephrectomies were collected as control group. The samples were stored at −80°C until RS analysis.
Raman instrumentation
Raman spectroscopy (Senterra, Bruker Optics) was used to interrogate renal tissues (Figure 4), the system was described before [24]. Briefly, it was comprised of two components: (1) a spectrometer that equipped with lasers of three different excitation wavelengths and a thermoelectrically cooled, charge-coupled device (CCD) detector; (2) a microscope (model-BX51, Olympus) that equipped with a digital video camera capable of visualizing samples on a motorized sample stage. Under working condition, the laser was coupled into the microscope via an optical fiber and focused onto the samples. Then, the Raman signal was captured by the CCD detector, translated into Raman spectra and displayed on a personal computer.
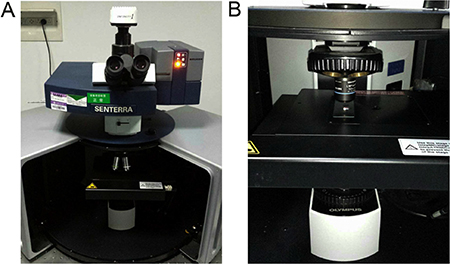
Figure 4: Actual setup of Raman spectroscopy. (A) Overview of the Raman system; (B) Under working condition, the biopsy was placed on the sample stage with the laser focused onto it.
Raman measurements
Specimens were brought to Raman analysis at room temperature. Raman spectra were acquired by focusing the laser onto the surface of the renal tissues. Four spectra were collected per specimen from different locations. The laser used in this study was 532 nm in wavelength and 10 mW in power, and the acquisition period of each spectrum was 10s, with a 4 cm−1 spectral resolution over a 45–4450 cm−1 Raman shift range. After analysis, the biopsy samples were sent to pathological diagnosis, and the results were given by two independent skilled uropathologists at our hospital.
OPUS software 7.2 was used to record Raman spectra. To ensure all Raman spectra were comparable, several data processing steps were performed before analysis: (1) spectral calibration using the known spectra of silicon slice; (2) correction of spectral response of system using a tungsten white light source diffusely scattered by a reflectance standard BaSO4; (3) fluorescence background removal using a fifth order polynomial fitting; (4) baseline correction using a stretched rubber band between the spectrum endpoints that follows the spectrum minima; (5) data normalization by dividing each spectral point by the area of the total intensity of the spectrum. The Raman spectra were corresponded to the final surgical pathology.
Statistical analysis
Our objective was to generate a diagnostic algorithm using RS capable of distinguishing (1) renal tumors and normal parenchyma; (2) malignant and benign tumors; (3) different pathological types of renal cell carcinoma (RCC); (4) high-grade (Fuhrman III–IV) and low-grade (Fuhrman I–II) tumors. For that purpose, Discriminant Analysis (DA) was used to generate this diagnostic algorithm, then a standard ‘leave-one spectrum out’ cross-validation was used to test the predictive capability of RS [25]. In that procedure, all spectra except one were used to test the DA and the remaining spectrum was left for continuing testing. The procedure was repeated with alternation of spectra. At the end, a cross-validation score that represented the capability of a single Raman spectrum to classify assessed biological sample was acquired. All analysis was performed in Matlab® Software (Mathworks Inc., USA).
Authors’ contributions
Yufei Liu performed the study and prepared the manuscript; Zhebin Du helped to gather the specimens; Haowen Jiang and Jin Zhang designed and funded the study.
ACKNOWLEDGMENTS
The authors thank Professor Yuan-fang Zhang at Huashan Hospital for helpful suggestions.
CONFLICTS OF INTEREST
The authors state that there are no conflicts of interest.
GRANT SUPPORT
This study was supported by National Natural Science Foundation of China (Grant No. 81502189).
REFERENCES
1. Lane BR, Samplaski MK, Herts BR, Zhou M, Novick AC, Campbell SC. Renal mass biopsy—a renaissance? J Urol. 2008; 179:20–27.
2. Rybicki FJ, Shu KM, Cibas ES, Fielding JR, vanSonnenberg E, Silverman SG. Percutaneous biopsy of renal masses: sensitivity and negative predictive value stratified by clinical setting and size of masses. AJR Am J Roentgenol. 2003; 180:1281–1287.
3. Volpe A, Kachura JR, Geddie WR, Evans AJ, Gharajeh A, Saravanan A, Jewett MA. Techniques, safety and accuracy of sampling of renal tumors by fine needle aspiration and core biopsy. J Urol. 2007; 178:379–386.
4. Shannon BA, Cohen RJ, de Bruto H, Davies RJ. The value of preoperative needle core biopsy for diagnosing benign lesions among small, incidentally detected renal masses. J Urol. 2008; 180:1257–1261.
5. Prince J, Bultman E, Hinshaw L, Drewry A, Blute M, Best S, Lee FT Jr, Ziemlewicz T, Lubner M, Shi F, Nakada SY, Abel EJ. Patient and tumor characteristics can predict nondiagnostic renal mass biopsy findings. J Urol. 2015; 193:1899–1904.
6. Leveridge MJ, Finelli A, Kachura JR, Evans A, Chung H, Shiff DA, Fernandes K, Jewett MA. Outcomes of small renal mass needle core biopsy, nondiagnostic percutaneous biopsy, and the role of repeat biopsy. Eur Urol. 2011; 60:578–584.
7. Tomaszewski JJ, Uzzo RG, Smaldone MC. Heterogeneity and renal mass biopsy: a review of its role and reliability. Cancer Biol Med. 2014; 11:162–172.
8. Huang WE, Li M, Jarvis RM, Goodacre R, Banwart SA. Shining light on the microbial world the application of Raman microspectroscopy. Adv Appl Microbiol. 2010; 70:153–186.
9. Bensalah K, Fleureau J, Rolland D, Lavastre O, Rioux-Leclercq N, Guille F, Patard JJ, Senhadji L, de Crevoisier R. Raman spectroscopy: a novel experimental approach to evaluating renal tumours. Eur Urol. 2010; 58:602–608.
10. Couapel JP, Senhadji L, Rioux-Leclercq N, Verhoest G, Lavastre O, de Crevoisier R, Bensalah K. Optical spectroscopy techniques can accurately distinguish benign and malignant renal tumours. BJU Int. 2013; 111:865–871.
11. Maquelin K, Kirschner C, Choo-Smith LP, van den Braak N, Endtz HP, Naumann D, Puppels GJ. Identification of medically relevant microorganisms by vibrational spectroscopy. J Microbiol Methods. 2002; 51:255–271.
12. Chan JW, Taylor DS, Zwerdling T, Lane SM, Ihara K, Huser T. Micro-Raman spectroscopy detects individual neoplastic and normal hematopoietic cells. Biophys J. 2006; 90:648–656.
13. Kunapareddy N, Freyer JP, Mourant JR. Raman spectroscopic characterization of necrotic cell death. J Biomed Opt. 2008; 13:054002.
14. Hugh JB, Ganesh DS, Nick S. Raman Microscopy: Complement or Competitor?. RSC Analytical Spectroscopy Series. 2011:105–142.
15. Liu T, Xu S, Li Z, Wang M, Sun C. Temperature induced changes in resonance Raman spectra intensity of all-trans-beta-carotene: changes in the fundamental, combination and overtone modes. Spectrochim Acta A Mol Biomol Spectrosc. 2014; 131:153–157.
16. Feld MS, Manoharan R, Salenius J. Detection and characterization of human tissue lesions with near infrared Raman spectroscopy. Advances in Fluorescence Sensing Technology. 1995; II:99–102.
17. Crow P, Stone N, Kendall CA, Uff JS, Farmer JA, Barr H, Wright MP. The use of Raman spectroscopy to identify and grade prostatic adenocarcinoma in vitro. Br J Cancer. 2003; 89:106–108.
18. Miernik A, Eilers Y, Bolwien C, Lambrecht A, Hauschke D, Rebentisch G, Lossin PS, Hesse A, Rassweiler JJ, Wetterauer U, Schoenthaler M. Automated analysis of urinary stone composition using Raman spectroscopy: pilot study for the development of a compact portable system for immediate postoperative ex vivo application. J Urol. 2013; 190:1895–1900.
19. Shapiro A, Gofrit ON, Pizov G, Cohen JK, Maier J. Raman molecular imaging: a novel spectroscopic technique for diagnosis of bladder cancer in urine specimens. Eur Urol. 2011; 59:106–112.
20. Del Mistro G, Cervo S, Mansutti E, Spizzo R, Colombatti A, Belmonte P, Zucconelli R, Steffan A, Sergo V, Bonifacio A. Surface-enhanced Raman spectroscopy of urine for prostate cancer detection: a preliminary study. Anal Bioanal Chem. 2015; 407:3271–3275.
21. Dechet CB, Bostwick DG, Blute ML, Bryant SC, Zincke H. Renal oncocytoma: multifocality, bilateralism, metachronous tumor development and coexistent renal cell carcinoma. J Urol. 1999; 162:40–42.
22. Jasinski RW, Amendola MA, Glazer GM, Bree RL, Gikas PW. Computed tomography of renal oncocytomas. Comput Radiol. 1985; 9:307–314.
23. Davidson AJ, Hayes WS, Hartman DS, McCarthy WF, Davis CJ Jr. Renal oncocytoma and carcinoma: failure of differentiation with CT. Radiology. 1993; 186:693–696.
24. Liu Y, Zhu Y, Di L, Osterberg EC, Liu F, He L, Hu H, Huang Y, Li PS, Li Z. Raman spectroscopy as an ex vivo noninvasive approach to distinguish complete and incomplete spermatogenesis within human seminiferous tubules. Fertil Steril. 2014; 102:54–60 e52.
25. Huleihel M, Shufan E, Zeiri L, Salman A. Detection of Vero Cells Infected with Herpes Simplex Types 1 and 2 and Varicella Zoster Viruses Using Raman Spectroscopy and Advanced Statistical Methods. PloS one. 2016; 11:e0153599.