
INTRODUCTION
Pancreatic ductal adenocarcinoma (PDAC) is the most common and the deadliest form of pancreatic cancer, comprising 85% of all cases, with a five-year survival rate of just 6.7% [1, 2]. PDAC commonly arises from precancerous lesions called pancreatic intraepithelial neoplasias (PanINs) [3]. These lesions are characterized by very high occurrence of mutations in the KRAS oncogene that are also maintained throughout disease progression and found in over 90% of PDAC cases [4]. These findings indicate that KRAS could be a robust therapeutic target in PDAC. Indeed, murine pancreatic cancers with activated KRAS (e.g. KRASG12D and KRASG12V) exhibit oncogene addiction, whereby suppression of KRAS activity induces cell death in advanced tumors and regression of early PanINs [5–7]. However, efforts to directly inhibit KRAS activity in human tumors have thus far been unsuccessful [8]. Moreover, clinical and preclinical studies have demonstrated the complexities of inhibiting the well-characterized downstream RAF/MEK/ERK and PI3K/AKT pathways [9–14]. These findings highlight the complexity of the signaling networks downstream of activated KRAS and suggest potential roles for post-transcriptional mechanisms that may buffer signaling downstream of KRAS. Therefore, a deeper understanding of the factors that influence KRAS-driven tumor initiation and progression in the pancreas is greatly needed.
MicroRNAs (miRNAs) are highly conserved short non-coding RNAs that influence gene expression post-transcriptionally and regulate development, normal physiology and disease [15]. MiRNAs have been demonstrated to regulate the initiation and progression of many malignancies by controlling oncogenic and tumor suppressive pathways [16]. Among the earliest described oncogenic miRNAs were members of the mir-17~92 cluster [17, 18]. mir-17~92 has been implicated in a variety of cancer contexts [19], and inhibition of members of this cluster has been shown to impair tumor growth and survival [20, 21]. Profiling of human pancreatic tumors and pancreatic cancer cell lines has shown that miRNAs encoded by the mir-17~92 cluster and its paralogs–mir-106b~25 and mir-106a~363–are upregulated in tumors compared to normal pancreatic tissue or chronic pancreatitis [22, 23]. In addition, mir-17~92-encoded miRNAs are induced in precursor PanIN lesions, implicating them in early stages of PDAC development [24], and miR-17 overexpression has been associated with reduced pancreatic cancer patient survival [25]. The mir-17~92 cluster was initially identified as oncogenic over a decade ago [18, 26]. Subsequent studies have demonstrated critical roles for this microRNA cluster in several malignancies including B-cell lymphoma, retinoblastoma, medulloblastoma, hepatocellular carcinoma and neuroblastoma [20, 21, 27–34]. Individual miRNAs within the cluster have been associated with specific tumorigenic properties. Of note, the miR-19 microRNAs have been associated with tumor cell invasion and metastasis in gastric cancer [35], lung cancer [36] and colon cancer [37].
Studies in pancreatic cancer cell lines additionally demonstrated roles for the mir-17~92 cluster in PDAC cell proliferation, transformation and invasion [25, 38, 39]. However, to date no studies have been performed to evaluate the role of the cluster in vivo during pancreatic tumor initiation and progression. Given the upregulation of these miRNAs in human pancreatic cancers and their validated role as oncogenes in a variety of contexts, we hypothesized that they contribute to KRAS-induced pancreatic tumorigenesis. Therefore, we experimentally tested the requirement for mir-17~92 in a mouse model of pancreatic cancer.
We find that deletion of mir-17~92 impairs MEK/ERK signaling in PanIN lesions and this correlates with the presence of fewer PanINs, as well as their regression over time. In addition, we find that mir-17~92 miRNAs, in particular miR-19 family miRNAs, promote PDAC cell invasion by regulating the formation of extracellular matrix-degrading invadopodia rosettes. Together, these findings illustrate important roles for mir-17~92 miRNAs during multiple phases of PDAC development and progression.
RESULTS
mir-17~92 loss does not impact normal pancreas development
Prior miRNA expression profiling studies of human PDAC specimens demonstrated elevated expression of components of the mir-17~92 cluster in PDAC. However, the results from these studies were somewhat inconsistent, potentially reflecting the significant stromal and immune cell component of pancreatic tumors. To ascertain whether mir-17~92 miRNAs have elevated expression in PDAC cells, we profiled a panel of PDAC cell lines as well as the immortalized pancreatic epithelial cell line HPNE. We find that mir-17~92 miRNAs are consistently overexpressed in PDAC cell lines (Supplementary Figure 1). Thus, we set out to identify the role of this microRNA cluster in pancreatic tumorigenesis in vivo in genetically engineered mouse models.
To determine the effect of mir-17~92 loss on pancreatic development, we induced pancreas-specific deletion of the mir-17~92 cluster using the conditional mir-17~92flox allele and the recombination driver Ptf1a-Cre [40, 41]. qRT-PCR of RNA from whole pancreata showed a strong reduction in the levels of mir-17~92 constituent miRNAs in compound mir-17~92flox/flox, Ptf1a-Cre mice (Supplementary Figure 2A). The observed residual mir-17~92 expression is likely from endocrine cells, many of which are derived from a PTF1A-independent lineage [40, 42], as well as a small population of acinar and ductal cells that have avoided recombination due to the fact that Cre drivers are not 100% efficient [43]. Expression from the paralogous mir-106b~25 cluster is unaffected (Supplementary Figure 2A). Despite efficient depletion of mir-17~92 miRNAs from the pancreas, organ size and exocrine and endocrine architecture and composition were unperturbed (Supplementary Figure 2B). These findings demonstrate that mir-17~92 is not required for normal pancreas development.
mir-17~92 loss promotes PanIN loss and exocrine recovery
To assess the impact of mir-17~92 deletion on the development and progression of precursor precancerous PanIN lesions, we crossed mir-17~92flox/flox, Ptf1a-Cre mice onto the LSL-KrasG12D background [44]. Breeding pairs were designed to cross mir-17~92flox/wt, LSL-KrasG12D mice with mir-17~92flox/wt, Ptf1a-Cre mice in order to generate littermate mir-17~92wt/wt, LSL-KrasG12D, Ptf1a-Cre and mir-17~92flox/flox, LSL-KrasG12D, Ptf1a-Cre mice (hereafter ‘KC’ and ‘17KC’). Littermate KC and 17KC animals were maintained until four or nine months of age and subsequently euthanized to obtain pancreata for histological analysis. At four months of age, the tissue area occupied by PanIN lesions was not significantly different between the two groups as illustrated by hematoxylin and eosin staining and quadchrome staining (Figure 1A–1D, 1I). However, the extent of normal acinar tissue was significantly greater in the pancreata of 17KC mice (Figure 1I). Nine month-old KC mice displayed higher PanIN burdens compared to younger KC mice and nine month-old 17KC littermates (Figure 1E–1I). In contrast to the trend observed in KC mice, we observed that the pancreata of nine month-old 17KC mice exhibited less PanIN tissue and more healthy acinar tissue by area than four month-old 17KC mice (Figure 1F, 1H, 1I). Of note, PanIN lesions in KC and 17KC pancreata demonstrate no significant differences in proliferation or apoptosis markers and no differences were observed in the proliferative rate of adjacent acinar tissue (Supplementary Figure 3). Together, these data suggest that loss of mir-17~92 impairs the maintenance of PanIN lesions.
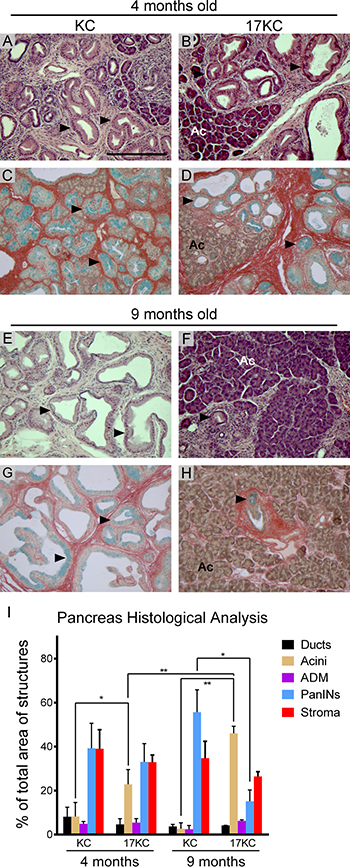
Figure 1: mir-17~92 null PanINs regress with age. Histological evaluation of PanIN lesions in pancreata from 4-month old (A–D) and 9-month old (E-H) KC and 17KC mice. Representative images from hematoxylin and eosin (A, B ,E, F) and quadchrome (simultaneous Alcian Blue and Sirius Red staining; C, D, G, H ) stains are shown. (I) Quantification of normal and neoplastic cell types as a percentage of total tissue area. The quadchrome stain marks collagen red, mucin blue, cytoplasm yellow-brown, and nucleic acids black. Arrowheads identify examples of PanIN lesions. Ac = Acinar tissue. Number of organs (n) analyzed for each group were 4 mo KC (4), 4 mo 17KC (7), 9 mo KC (3), 9 mo 17KC (2). Scale bar = 0.25 mm. p values by Student’s t test: * < 0.05, ** < 0.01. Error bars represent standard deviation from the mean.
Recent work suggested that inhibition of MEK/ERK signaling promotes the regression of PanIN lesions [45]. As determined by immunohistochemical staining for phosphorylated ERK, we observed that 17KC PanINs display marked reduction in MAPK signaling (Figure 2A–2D). In contrast to the difference in phosphorylated ERK, phosphorylation of the upstream kinase MEK was not different between the two genotypes, suggesting that signaling through the MEK/ERK cascade is impacted at the level of ERK but not further upstream (Figure 2E–2H). Moreover, ectopic mir-17~92 expression in murine PanIN cell lines [46, 47] increased p-ERK levels under both serum replete and serum starved conditions (Figure 3A, 3B), confirming that mir-17~92-encoded miRNAs regulate this pathway.
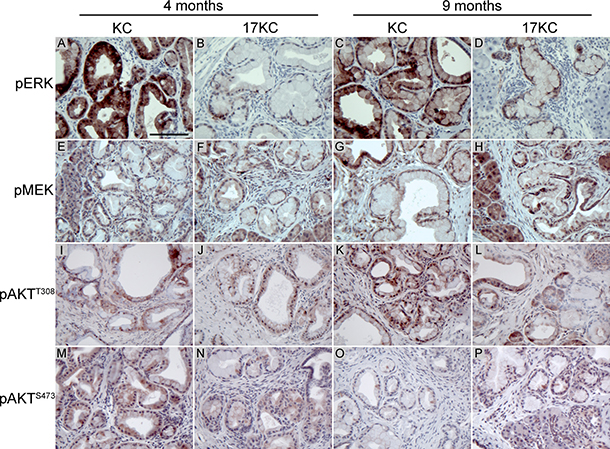
Figure 2: mir-17~92 null PanINs display reduced MEK/ERK pathway activation. Immunostaining of PanIN lesions identified in 4- and 9-month old KC and 17KC mice for phosphorylated ERK (A–D), phosphorylated MEK (E–H), AKT phosphorylated at Thr308 (I–L), and AKT phosphorylated at Ser473 (M–P). Scale bar = 0.1 mm.
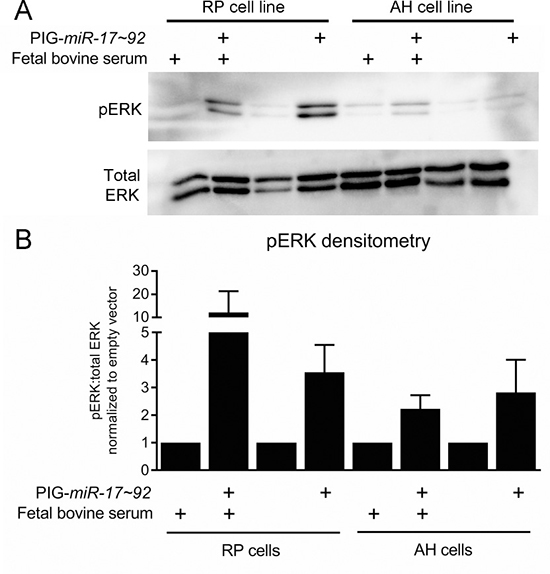
Figure 3: ERK signaling is increased by mir-17~92 overexpression in PanIN cell lines. (A) Representative immunoblot for pERK and total ERK in the PanIN cell lines RP2294 and AH2375 stably infected with PIG-mir-17~92 or empty vector. (B) Average densitometry for three experiments performed in (A). Error bars represent standard deviation from the mean.
Analysis of the phosphorylation status of AKT at the Thr308 and Ser473 sites that are phosphorylated by PDK1 and mTORC2 also did not show any differences between genotypes (Figure 2I–2P). Taken together with the phosphorylation of MEK, these data suggest that the alterations in ERK phosphorylation do not reflect an overall reduction in KRAS signaling, and further suggest that mir-17~92 regulates PanIN maintenance by specifically influencing ERK pathway activity downstream of KRASG12D and MEK.
We utilized the TargetScan database [48] to identify known and putative mRNA targets of mir-17~92 that are implicated in the regulation of ERK phosphorylation. We identified the dual specificity phosphatases DUSP2, DUSP7 and DUSP10, which are known to regulate MAP kinase phosphorylation, as potential targets of cluster-encoded miRNAs [49, 50]. However, immunostaining of PanIN lesions with antibodies against these phosphatases did not show any differences between mir-17~92 wild type and deficient PanINs (data not shown). Moreover, the enhanced ERK phosphorylation observed in PanIN cell lines following ectopic mir-17~92 expression was not associated with changes in DUSP7 or DUSP10 protein levels (Supplementary Figure 4). DUSP2 was undetectable by immunoblotting or qRT-PCR in these cell lines (data not shown). Thus, the detailed mechanisms regulating ERK phosphorylation in PanINs downstream of mir-17~92 remain unknown.
mir-17~92-deficient tumors display a delayed invasion phenotype
To assess whether mir-17~92 deletion impairs progression to carcinoma, we accelerated the KC model by including conditional loss of one copy of Trp53 (LSL-KrasG12D, Trp53flox/wt, Ptf1a-Cre and mir-17~92flox/flox, LSL-KrasG12D, Trp53flox/wt, Ptf1a-Cre; hereafter “KPC” and “17KPC” mice). We observed that KPC and 17KPC mice display similar overall survival and tumor size (Figure 4A, 4B). Rates of liver metastasis are also equivalent between groups (Supplementary Figure 5A, 5B). The carcinomas identified in mice of both genotypes displayed a mixture of glandular and undifferentiated histology; no difference in the relative frequencies of the histologic types was identified between the two groups (Supplementary Figure 5C–5E). Histological evidence of invasion was also equally prevalent in both groups, and variously involved the stomach/duodenum, liver, colon, and spleen (Supplementary Figure 5F–5J). The histopathology findings are summarized in Supplementary Table 1. Additionally, tumors across both groups exhibited similar rates of proliferation and apoptosis as demonstrated by Ki67 and cleaved caspase 3 (CC3) staining (Supplementary Figure 6). Moreover, KPC and 17KPC tumors display equivalent MEK/ERK pathway activation as measured by immunostaining for phosphorylated ERK (Supplementary Figure 7A, 7B). Further, cell lines derived from KPC and 17KPC tumors display similar levels of ERK phosphorylation and similar levels of DUSP7 and DUSP10 expression (Supplementary Figure 7C, 7D). Together, these findings suggest that heterozygous deletion of Trp53 compensates for the loss of mir-17~92 and promotes disease progression in mir-17~92 deficient animals.
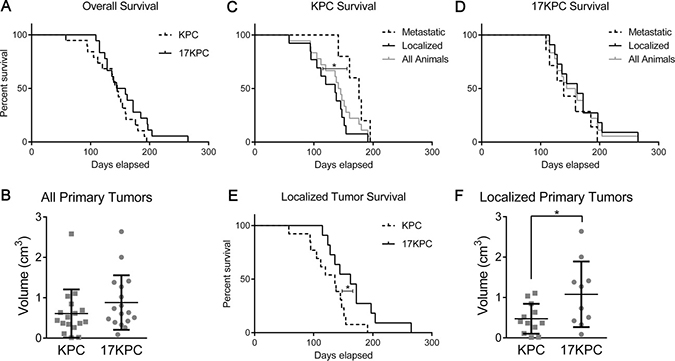
Figure 4: Loss of mir-17~92 prolongs survival in mice without metastases. (A) Kaplan-Meier survival plot for KPC and 17KPC mice. (B) Primary tumor burden identified in these mice upon euthanasia. (C) Kaplan-Meier survival plot comparing metastatic and localized KPC mice. (D) Kaplan-Meier survival plot comparing metastatic and localized 17KPC mice. (E) Kaplan-Meier survival plot comparing localized KPC and localized 17KPC mice. (F) Total primary tumor burden of localized mice. Number of animals (n) for each group were as follows: KPC (18), 17KPC (18), metastatic/localized KPC (5/13), metastatic/localized 17KPC (7/11), female/male KPC (7/11), female/male 17KPC (10/8). p values: * < 0.05. Error bars represent standard deviation from the mean.
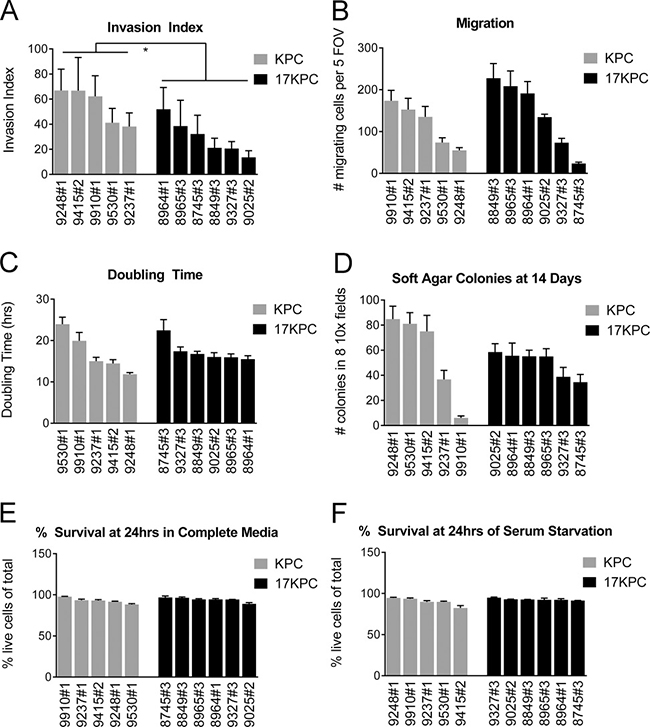
Figure 5: mir-17~92 null PDAC cell lines have reduced invasive capacity in vitro. Characterization of in vitro phenotypes of PDAC cell lines derived from KPC and 17KPC tumors. (A) Invasion activity in transwell assays, displayed as invasion index [(number of invading cells/number of migrating cells) × 100]. (B) Migration activity in transwell assays. (C) Proliferation rate. (D) Colony formation in a soft agar. (E) Cell survival in serum-replete medium. (F) Cell survival in serum-free medium. Cell line nomenclature is noted as cage#animal# (e.g. 9025#2 is the cell line derived from the primary tumor of mouse #2 from cage #9025). All error bars represent SD. p value: * < 0.05.
In the KPC mouse model, mice reliably generate aggressive primary tumors that invade adjacent tissues and sporadically metastasize: thus, morbidity and euthanasia result from the effects of either the primary tumor or its metastases. To ascertain whether mir-17~92 deletion differentially impacted primary versus metastatic disease processes, we stratified survival data based on the presence or absence of grossly visible metastases at euthanasia. The majority of KPC mice lacked metastases and were sacrificed at relatively young ages due to effects of the primary tumor (“localized” mice), whereas a minority presented later with metastatic disease (“metastatic mice”) (Figure 4C), suggesting that primary KPC tumors cause significant morbidity prior to the development of metastases. However, this was not observed in 17KPC mice, where localized and metastatic mice display similar survival curves (Figure 4D). Indeed, the survival of metastatic mice is not significantly different between KPC and 17KPC mice (data not shown), but the survival of localized KPC mice was significantly worse than that of localized 17KPC mice (Figure 4E). Moreover, localized 17KPC mice also possessed larger tumors than localized KPC mice (Figure 4F). Together, these data suggest that mir-17~92 contributes to the morbidity and mortality caused by primary KPC tumors and does not impact time to metastasis.
The observed differences in survival among animals with localized disease could be the result of reduced or delayed invasive potential of 17KPC primary tumors. Thorough histological step sectioning of all primary tumors and adjacent tissues obtained in the study demonstrated equivalent evidence of invasion between KPC and 17KPC animals at the time of euthanasia (data not shown). This suggests that local invasion is a common endpoint in our survival study, but requires more time to develop in 17KPC mice, resulting in the longer survival and larger tumors of localized 17KPC mice compared to localized KPC mice. Localized pancreatic cancer in mice can cause morbidity with biliary obstruction and jaundice (evident in the ears, footpads, or pancreas) or gastrointestinal (GI) obstruction, as seen by gross abdominal distension and GI lumen distension upstream of an adhesion with the absence of downstream luminal contents on necropsy. While these features were commonly observed in KPC mice, 17KPC mice never presented with any form of GI or biliary obstruction (Supplementary Figure 8). Other characteristics of tumor presentation such as the presence of adhesions to adjacent organs, intraperitoneal bleeding, jaundice or ascites demonstrated no significant differences between KPC and 17KPC mice (Supplementary Figure 8). Together, these in vivo findings suggest that loss of the mir-17~92 cluster may impact PDAC cell invasion, a feature associated with later stages of disease.
mir-17~92-deficient cell lines are less invasive in vitro
To better understand the biology of mir-17~92 deficient pancreatic cancer cells, we generated a collection of cell lines from KPC and 17KPC tumors. Evaluation of cell invasion in transwell assays demonstrated that 17KPC cell lines have reduced ability to invade through Matrigel relative to KPC cell lines (Figure 5A). However, no differences were observed between the two genotypes in their ability to migrate across uncoated membranes (Figure 5B). Additionally, there were no significant differences in the proliferation, anchorage independent growth, or survival phenotypes of KPC and 17KPC cell lines (Figure 5C–5F). These data agree with the suggestion that 17KPC tumors display delayed invasion in vivo, and suggest a specific defect in the ability of tumor cells to manipulate extracellular matrix.
In cancer cells, invasion activity is associated with the presence of specific matrix-degrading, cell adhesion structures called invadopodia [51, 52]. Invadopodia can be identified by the organization of their core cytoskeletal protein components–actin and cortactin–into punctate or rosette-shaped structures that are functionally associated with localized sites of elevated metalloproteinase activity [51, 53–55]. To better understand the nature of the invasive defect that we observed in 17KPC cell lines, we analyzed invadopodia formation by immunofluorescence. We found that invadopodia in KPC and 17KPC cell lines take the form of rosettes and that KPC cell lines display significantly higher rates of invadopodia rosette formation than 17KPC lines (Figure 6A–6I). In agreement with reduced invadopodia numbers, 17KPC cell lines also degrade less FITC-labeled gelatin matrix than KPC lines (Figure 6J–6N). These data suggest that loss of mir-17~92 decreases invasion, at least in part, as a result of reduced matrix-degrading capacity.
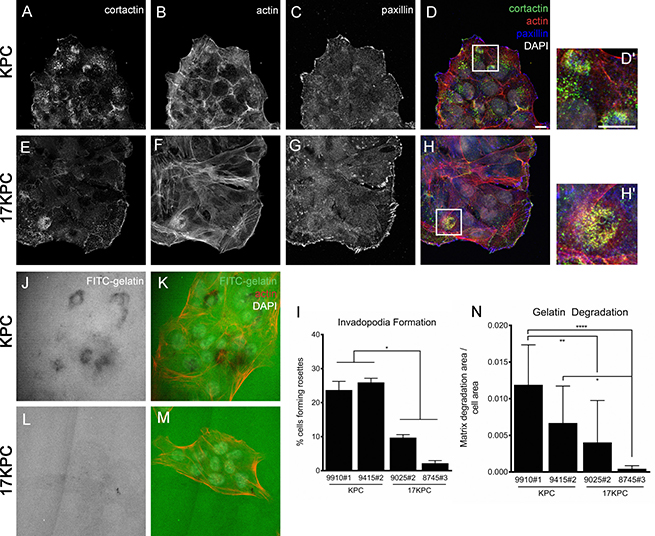
Figure 6: mir-17~92 null PDAC cell lines form fewer invadopodia rosettes. Immunofluorescence staining for the invadopodia constituent proteins cortactin (A, E), actin (B, F) and paxillin (C, G) in representative KPC and 17KPC cell lines. Merged images are shown in (D) and (H). D′ and H′ are higher magnification views of panels D and H. Scale bar = 10 um. Quantification of invadopodia rosettes is shown in (I). n = 3 for each cell line. Areas of FITC-gelatin degradation, identified as dark regions, are shown for representative KPC and 17KPC cell lines (J, L). (K, M) Co-staining for actin and DNA (DAPI). (N) Quantification of gelatin degradation. n = 3 for each cell line. Error bars represent standard error of the mean. p values: * < 0.05, ** < 0.01, **** < 0.0001.
miR-19 promotes invadopodia formation and the invasiveness of pancreatic cancer cell lines
The mir-17~92 cluster encodes six miRNAs encompassing four miRNA seed families (Figure 7A), implicating thousands of predicted mRNA targets as downstream effectors of the cluster’s invasive program. To aid in our determination of which miRNA families may be most important in the invasive phenotype, we evaluated nine KPC and nine 17KPC cell lines for their expression of miR-17, -18, -19, and -92 family miRNAs across the three cluster paralogs: mir-17~92, mir-106b~25, and mir-106a~363. Quantitative RT-PCR demonstrated that 17KPC cell lines are indeed null for miRNAs from mir-17~92, however they retain robust expression from mir-106b~25 (Figure 7B, 7C). In fact, the mir-106b~25 locus is sufficient to drive expression of miRNAs for the miR-17 and miR-92 families to levels close to those observed in KPC lines, suggesting that loss of the miR-17 and -92 families may not be primarily responsible for the invasive defect of 17KPC cell lines. In contrast, miR-19 family miRNAs can only be expressed from the mir-17~92 and mir-106a~363 clusters, and 17KPC lines were found to completely lack expression of this miRNA family (Figure 7E). Based on the partial residual expression of the miR-17 and miR-92 families (Figure 7B, 7C), and the generally very low expression of the miR-18 family (Figure 7D, note y axis units), we hypothesized that loss of the miR-19 family was responsible for the defective invasion of 17KPC cell lines.
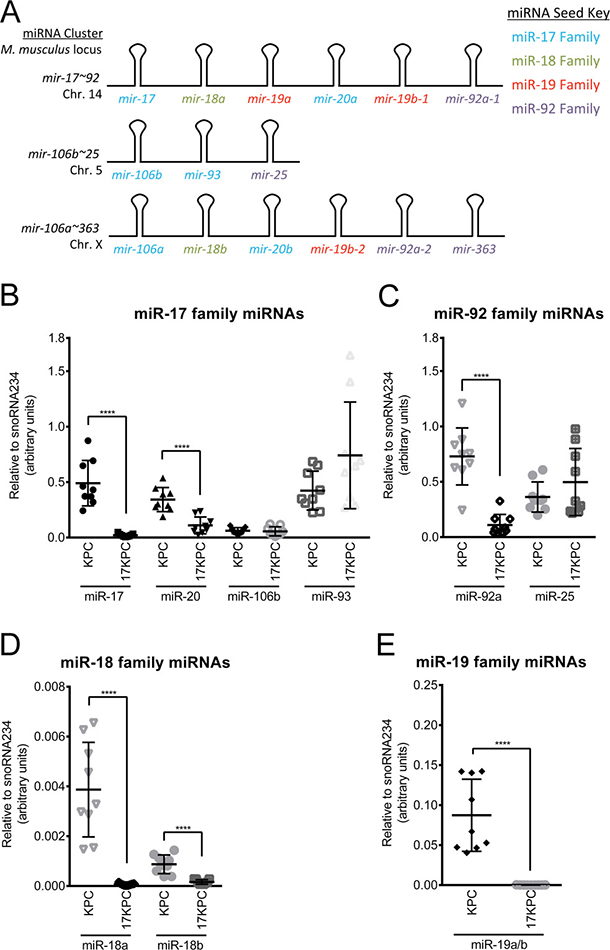
Figure 7: miR-19 family expression is absent in 17KPC cell lines. (A) Schematic representation of the mir-17~92 cluster and its paralogs mir-106b~25 and mir-106a~363. Constituent miRNAs are color-coded according to their seed families. (B–E) Quantitative RT-PCR measurement of mature miRNA expression across eighteen cell lines derived from primary KPC and 17KPC tumors. Some miRNAs share sufficient sequence similarity that standard oligonucleotides amplify both species equally (e.g. miR-19a and miR-19b), and therefore not all miRNAs are individually plotted. p values: **** < 0.0001. Error bars represent standard deviation from the mean.
To validate that miR-19 family miRNAs play an important role in invasion, we utilized antagomirs–short oligonucleotides that bind and inactivate miRNAs–to specifically knock down miR-19 function in KPC lines with high invasive capacity and varying levels of miR-19 expression [56]. We first confirmed miR-19 antagomir activity using a β-galactosidase (β-Gal) reporter containing multiple miR-19 binding sites within the 3’UTR that allow translational suppression in the presence of miR-19. Pooled antagomirs against miR-19a and miR-19b enhanced reporter activity in a KPC cell line, but not in a 17KPC cell line (Supplementary Figure 9).
MiR-19 antagomirs significantly inhibited KPC cell line invasion, but not migration, consistent with an invasion-specific effect for miR-19 family miRNAs (Figure 8A, 8B). This response inversely correlated with the level of endogenous miR-19 family expression, suggesting a dosage response (Figure 8C). Indeed, the cell line with the highest expression of miR-19, 9415#2, was resistant to antagomirs at a concentration of 50 nM, but responded when treated with antagomirs at 100 nM (Figure 8A, 8C). We next ascertained whether miR-19 regulates invasion in human PDAC cells. The human pancreatic cancer cell lines MIA Paca-2 and PANC-1 are also invasive and express relatively high levels of miR-19 (Figure 8F). Treatment of these lines with miR-19 antagomirs reduced their invasive capacity in a transwell assay without affecting their migration ability (Figure 8D, 8E). Furthermore, treatment with miR-19 antagomirs was sufficient to reduce the number of invadopodia rosettes formed in KPC cells (Figure 8G, Supplementary Figure 10) and also decreased the gelatin degradation capacity of these cell lines (Figure 8H, Supplementary Figure 11). These data demonstrate that miR-19 miRNAs regulate PDAC cell invasion.
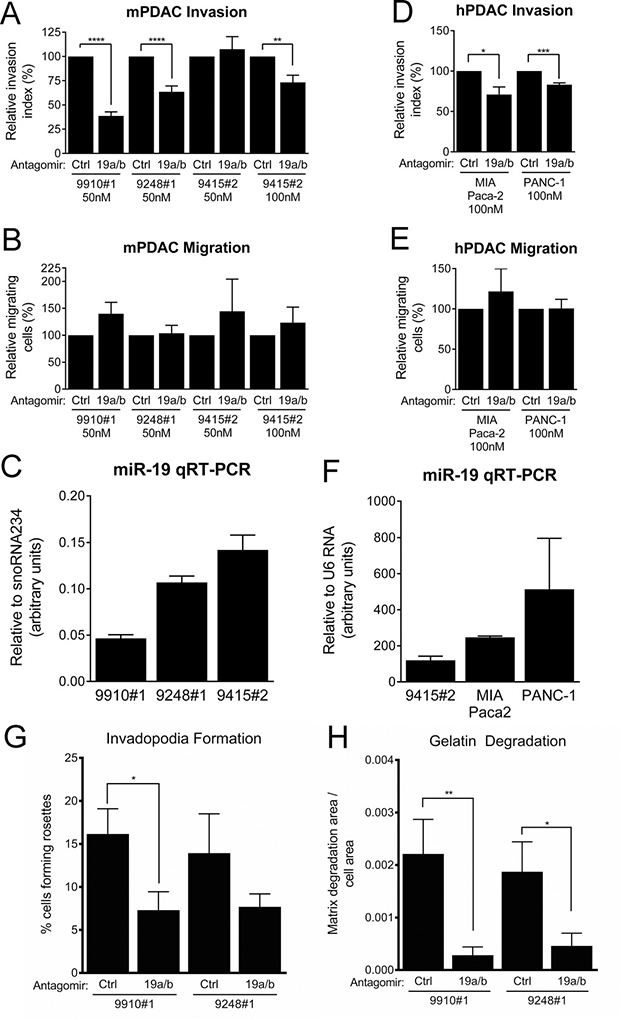
Figure 8: PDAC cell line invasion and invadopodia formation is suppressed by miR-19 antagomirs. (A) Transwell invasion through Matrigel of KPC cell lines treated with control or miR-19-targeting antagomirs at the indicated concentrations. (B) Transwell migration activity of the cell lines shown in (A). (C) Quantitative RT-PCR measurement of baseline mature miR-19 levels in KPC cell lines. (D) Transwell invasion through Matrigel of the human PDAC cell lines MIA Paca-2 and PANC-1 treated with control or miR-19-targeting antagomirs at the indicated concentrations. (E) Transwell migration of activity of the cell lines shown in (D). (F) Quantitative RT-PCR measurement of baseline mature miR-19 levels in MIA Paca-2 and PANC-1 cells; miR-19 levels in the KPC cell line 9415#2 are shown for comparison. Invadopodia rosette formation (G) and FITC-gelatin degradation (H) in the KPC cell lines 9910#1 and 9248#1 treated with control or miR-19-targeting antagomirs. n = 3 for each cell line. p values: * < 0.05, ** < 0.01, *** < 0.001, **** < 0.0001. (A–F) Error bars represent standard deviation from the mean. (G, H) Error bars represent standard error of the mean.
DISCUSSION
Given its rate of mutational activation in PDAC and past observations of oncogene addiction, KRAS and components of its downstream signaling pathways represent robust therapeutic targets in this devastating malignancy. To date, efforts to directly inhibit KRAS function have been unsuccessful [8]; thus efforts in the field have turned to targeting key downstream pathways [9–11]. However, a deeper understanding of the mechanisms responsible for the transforming effect of KRAS could inform more effective therapeutic strategies. Several microRNAs, including those in the mir-17~92 cluster, display increased expression in PDAC as well as precursor PanIN lesions [22–24], suggesting that these miRNAs may play a role in tumorigenesis. However, to date, the functional importance of these miRNAs has not been evaluated in vivo.
Here we report that deletion of the mir-17~92 miRNA cluster results in the regression of KRASG12D-driven PanIN lesions and the expansion of normal acinar tissue in place of neoplastic cells over time. In addition, we observe that mir-17~92-null PanIN lesions have reduced ERK phosphorylation, and PanIN cell lines with ectopic mir-17~92 expression display elevated p-ERK levels. However, mir-17~92-null PanIN lesions display no changes in MEK phosphorylation or PI3K/AKT signaling, suggesting a specific impact of mir-17~92 on ERK activation. Importantly, apoptotic rates are not increased in mir-17~92-null PanINs, suggesting that these lesions are not lost by apoptosis. Moreover, the proliferation rate is unchanged in the adjacent acinar tissue of 17KC mice compared to that of KC mice, indicating that exocrine recovery is not due to the expansion of residual acinar cells in these animals. Together, these findings suggest that mir-17~92 loss promotes the redifferentiation of PanINs into acinar cells. While sophisticated lineage tracing experiments will be required to validate this hypothesis, our data are in agreement with recently published data demonstrating that ERK pathway activity downstream of KRASG12D is critical for PanIN maintenance, and loss of ERK signaling triggers PanIN regression into normally differentiated exocrine tissue [45]. Importantly, the effects of miRNAs on signaling pathway output are generally smaller in magnitude than those observed with small molecule inhibitors, which potentially explains the extended timeline of PanIN regression in 17KC mice compared to the rapid regression described by Collins, et al. using MEK inhibitors [45].
The mechanisms underlying the regulation of ERK activity by mir-17~92 are unknown. We explored the possibility that mir-17~92 increases ERK activation via suppression of dual-specificity phosphatases (DUSPs), which are well-known regulators of numerous MAPK family proteins, including ERK [57]. In particular, DUSP2, DUSP7 and DUSP10 suppress ERK activity and are demonstrated or predicted targets of mir-17~92 miRNAs [48, 58–60]. Interestingly, a recent publication linked miR-92 and DUSP10 to PDAC cell proliferation in vitro, suggesting that there may indeed be an important role for this regulatory axis in pancreatic tumorigenesis [61]. However, immunohistochemical staining of DUSP2, DUSP7 and DUSP10 failed to demonstrate any difference between KC and 17KC PanIN lesions, and modulation of mir-17~92 levels in PanIN cell lines also failed to change the levels of these phosphatases. Thus, the precise mechanisms through which mir-17~92 regulates ERK phosphorylation remain unknown. Additional studies using inducible expression or repression of mir-17~92 miRNAs, coupled to mRNA and proteomic profiling approaches, will aid in elucidating the mechanisms by which this cluster regulates ERK phosphorylation in the early stages of pancreatic tumorigenesis.
We observed similar overall survival, rates of metastasis, and histological prevalence of invasion at sacrifice between KPC and 17KPC mice, suggesting that Trp53 loss can compensate for mir-17~92 deletion. In the KPC model, mice typically develop aggressive PDAC, characterized by local invasion, obstructive symptoms involving the gastrointestinal or biliary systems, and metastasis, which we observe in the KPC animals of this study. In contrast, we find that 17KPC mice exhibit less aggressive primary disease, as demonstrated by longer survival with larger primary tumors in the absence of metastases, and the absence of obstructive gastrointestinal or biliary symptoms. These data suggest that mir-17~92 plays a role in PDAC invasiveness. However, we cannot exclude the possibility that the absence of obstructive disease in the 17KPC mice reflects a difference in the initial anatomical site of these primary tumors compared to KPC tumors. Perhaps the tumors in 17KPC mice arise in the tail of the pancreas, allowing them to reach greater size before obstructing the duodenum or bile duct; whereas tumors occurring in KPC animals predominantly occur in the head of the pancreas, predisposing those animals to early obstructive phenomena. Additional studies analyzing tumors at earlier stages and smaller sizes will be needed in order to clarify whether KPC and 17KPC tumors arise in different locations within the pancreas.
Analysis of a panel of tumor-derived cell lines demonstrated that 17KPC cells are specifically defective in their ability to form invadopodia rosettes and invade through Matrigel in a transwell assay, providing a potential link to our in vivo observations. Using antagomirs against miR-19, we demonstrated that miR-19 family miRNAs are key drivers of invadopodia formation and the invasive capacity of human and murine pancreatic cancer cells. Thus, we have identified a novel role for miR-19 in pancreatic cancer cells. In fact, few studies exist that link miR-19 to cancer cell invasion in any tumor type [36, 37]. Future studies will be required to validate the significance of miR-19 family miRNAs in the invasive phenotype of PDAC in vivo. In addition, expression profiling and proteomic studies will be required to identify the mechanisms through which miR-19 miRNAs regulate invadopodia formation and function. TIMP2, CST3, and TGM2 are all predicted targets of miR-19 that are also suppressors of invasion [37, 39, 62, 63] and could potentially explain the reduced invasiveness of 17KPC cell lines. Indeed, TGM2 is linked to miR-19-mediated invasion in colorectal cancer cells [37]. However, immunoblotting and qRT-PCR experiments failed to detect any difference in expression between KPC and 17KPC cell lines (data not shown). Matrix metalloproteinases are also key drivers of invasion [64], and a survey of MMP-2, -7, -9, and MT1-MMP by qRT-PCR demonstrated no difference between KPC and 17KPC cell lines (data not shown). Given that our data point to a major effect of miR-19 on invadopodia formation and/or stability, and since none of the above factors are known to influence invadopodia, these negative findings are perhaps not surprising. Instead, they highlight the importance of the unbiased approaches stated above for elucidating the mechanisms responsible for the observed phenotypes.
Importantly, our experiments do not preclude significant roles for the other miRNAs encoded within the mir-17~92 cluster in PDAC invasion. Indeed, other members of the cluster are computationally predicted to regulate genes previously implicated in cellular invasion. Thus, studies that confirm or exclude roles for these miRNAs in PDAC invasion will also be of importance.
Our studies reported here are potentially in conflict with the recently published work of Heeschen and colleagues [65, 66]. In their work, the authors report that ectopic mir-17~92 expression promotes the proliferation of pancreatic cancer stem cells, resulting in their premature depletion and consequent reduced cell transformation and tumorigenicity. In contrast, our studies demonstrate that ectopic mir-17~92 increases MEK/ERK signaling, a feature required for the maintenance of established PanIN lesions [6, 67], suggesting that elevated mir-17~92 levels should enhance pancreatic cancer development. However, we have not evaluated the self-renewal capacity of mir-17~92 expressing PanIN cell lines, nor have we tested their tumorigenic capacity upon implantation into recipient mice. Future experiments in genetically engineered PDAC mouse models with enhanced mir-17~92 expression may be required to resolve this discrepancy.
Together, our findings demonstrate important roles for mir-17~92-encoded miRNAs during early stages of pancreatic tumorigenesis, as well as tumor progression and invasion. These findings provide functional support for the observed elevated expression of these miRNAs in precursor PanIN lesions and invasive PDAC. Further dissection of the cluster to identify the roles played by individual miRNAs during PanIN maintenance and PDAC invasion will be required in order to identify the critical target genes and pathways regulated by this miRNA cluster during pancreatic tumorigenesis.
MATERIALS AND METHODS
Animal studies
The Ptf1a-Cre [40], mir-17~92flox [41], LSL-KrasG12D [44], and Trp53flox [68] mouse strains have been described previously. Health status of all animals was monitored at least three times per week, and animals were euthanized when they displayed signs of distress or high tumor burden. Animals were maintained in specific pathogen-free facilities with abundant food and water. Mice were randomly assigned to the studies. Group sizes were estimated based on investigators’ prior experience. Euthanized mice that did not have pancreatic tumors were censored from the analysis. Mice of both genders were used in all studies. The pathologist was blinded to mouse genotypes for quantification of histopathologic lesions. All animal experiments were reviewed and approved by the University of Massachusetts Medical School Institutional Animal Care and Use Committee.
Histological stains
Tissues were fixed in 10% neutral-buffered formalin. Five-micrometer sections on charged glass slides were cleared through Xylenes (Fisher #X3P) to 100% ethanol and rehydrated through a graded alcohol series to distilled water. Immunostaining was performed as previously described [69]. A list of all antibodies used for immunohistochemical stains appears in Supplementary Table 2. Stains were developed using ABC (Vector Labs #PK-6101) and Nova Red (Vector Labs #SK-4800) kits according to manufacturer’s instructions.
Hematoxylin and eosin stains were performed according to field standards, and the quadchrome stain (consisting of a hybrid protocol derived from Sirius Red staining for collagen and Alcian Blue staining for mucin) was performed as recently described [47].
A licensed pathologist who was blinded to tissue genotypes performed quantification of tissue areas. Four images were quantified per section representing 1) the area of greatest neoplastic progression, 2) the area of lowest neoplastic progression, and 3,4) areas of the pancreas that were consistent with the average progression for that tissue section. Acini, ducts, PanINs, ADM lesions, and stromal tissue not including blood vessels were manually outlined using ImageJ software and are graphed as the percentage area of all areas quantified.
Cell culture experiments
All cell lines were maintained at subconfluent densities in high glucose DMEM (Life Technologies #11965) supplemented with 10% fetal bovine serum (Atlanta Biologicals #S11150) and 100U/ml penicillin/streptomycin (Pen/Strep: Life Technologies #15140) (herein ‘complete media’). Murine PDAC cell lines were generated in the Lewis lab. Murine PanIN cell lines were obtained from Nabeel Bardeesy (Massachusetts General Hospital). Human PDAC cell lines were obtained from ATCC, except for the Pa01c through Pa18C cell lines, which were obtained from Bert Vogelstein (Johns Hopkins University) [70]. Migration and invasion assays were performed as previously described using 8-micrometer-porous transwell inserts (Fisher #08-774-162) and Matrigel-coated inserts (Fisher #08-774-122) [71]. The invasion index was calculated as previously described [71]. Soft agar colony formation assays were performed as previously described [69]. Proliferation assays of adherent, subconfluent cells were performed by direct live cell counting after trypsin-mediated resuspension using trypan blue exclusion over a period of 48 hours. Counts were plotted as the log2 of the cell number over time, and the proliferative rate of each line was calculated as the inverse slope of a linear regression to the data (i.e. time/doubling). Data shown are the average of greater than four experiments. P-values were calculated using the Student’s t-test.
For antagomir experiments, miRCURY LNA Power Inhibitors (Exiqon #4101004-100, #4103258-100, and #199006-100) were transfected into 2.5 × 10⁵ cells per well of a 6-well plate using Superfect (Qiagen #301305) according to manufacturer’s specifications at a final antagomir concentration of either 50 or 100 nM.
Lentiviral infection of the human PanIN cell lines RP2294 and AH2375 was performed using viral vectors generously provided by Andrea Ventura, PhD [34].
Invadopodia and gelatin degradation analysis
Invadopodia rosette formation analysis and FITC-gelatin matrix degradation assays were performed as previously described [72]. Briefly, to visualize invadopodia rosette formation, cells were plated on fibronectin-coated slips (10μg/ml; Corning) for 24hrs, fixed, permeabilized and stained with anti-cortactin antibodies (1:200; Merck Millipore #05-180), anti-paxillin antibodies (1:200; Santa Cruz Biotechnology #sc-5574), TRITC-phalloidin (F-actin)(1:1000; Invitrogen #R415) and DAPI (nuclei) (1:1000; Sigma-Aldrich #D9542). A minimum of 150 cells per sample were scored for rosette formation, which were defined by cortactin and actin colocalization. n = 3.
For FITC-gelatin degradation analysis, coverslips were coated with 50μg/ml poly-L-lysine (Sigma-Aldrich #P8920) in PBS, and then incubated with 0.5% glutaraldehyde (Sigma-Aldrich #G6257) in PBS. The slips were coated with 1:40 fluorescent 488 gelatin (‘FITC-gelatin’) (Life Technologies #G13186) diluted with 0.2% unlabeled gelatin (Sigma-Aldrich) in PBS for 30 min. at 37°C. Cells were plated for 24 hours, fixed and stained as above. For quantitation of matrix degradation, nine random fields (20x objective) were imaged from each sample (n = 3). ImageJ software was used to threshold the cell area as well as areas of matrix degradation (black areas in FITC-gelatin) and to calculate a ratio of matrix degradation to cell area. Statistical analyses were performed using a one-way ANOVA with a Tukey correction.
qRT-PCR
Quantitative RT-PCR for miRNAs was performed as previously described [73]. After RNA isolation with TRIzol reagent (Invitrogen #15596), genomic contaminants were removed using DNAse (Life Technologies #AM1907). DNA-free RNA was then polyadenylated (New England Biolabs #M0276) and subsequently reverse transcribed (Invitrogen #18080) using a pool of specially designed primers at a concentration of 50 uM to generate cDNA copies of polyadenylated miRNAs. A complete list of primer sequences appears in Supplementary Table 3. All subsequent steps of the cDNA synthesis were conducted according to kit directions.
PCR for miRNAs was performed as follows: 1) denaturation at 94°C for 15 seconds, 2) annealing at 55°C for 30 seconds, and 3) extension at 70°C for 34 seconds, for a total of 40 cycles. The reverse primer for all miRNA reactions was the sequence of the universal tag present in all 12 RT primers. The forward primer for each miRNA was the mature miRNA sequence given by miRBase [74]. PCR reactions were carried out on an ABI Step One Plus machine in 10ul volumes using SYBR Green (VWR #95072).
CT values were calculated for all miRNA PCR reactions at a uniform threshold of absorbance across all experiments and controlled to CT values for the endogenous reference (snoRNA234 in mouse-only experiments, U6 in human and cross-species comparisons). The expression of individual miRNAs is presented as relative snoRNA234 units in order to convert the ΔCT value for each miRNA into a relative molar measure (calculated as 2ΔCT).
Abbreviations
PDAC: pancreatic ductal adenocarcinoma; PanIN: pancreatic intraepithelial neoplasia; ERK: extracellular regulated mitogen activated protein kinase; MEK: mitogen activated protein kinase kinase; PI3K: phosphatidylinositol 3-kinase.
Authors’ contributions
BJQ: Design of experiments, acquisition of data, analysis of data, writing manuscript; AG: Design of experiments, acquisition of data, analysis of data, writing manuscript; DRD: Design of experiments, acquisition of data, analysis of data; MS: Acquisition of data, analysis of data; DSK: Analysis of data; CET: Design of experiments, analysis of data, writing manuscript, study supervision; BCL: Design of experiments, analysis of data, writing manuscript, study supervision.
ACKNOWLEDGMENTS
The authors thank Guangping Gao for the miR-19 reporter plasmid, Corey Smith and Paul Kaufman for their assistance with the β-galactosidase reporter assays, Nabeel Bardeesy for PanIN cell lines, Bert Vogelstein for human pancreatic cancer cell lines, Andrea Ventura for the PIG-mir-17~92 expression constructs, and members of the Lewis lab for helpful discussion.
CONFLICTS OF INTEREST
The authors report no conflicts of interest.
FUNDING
This work was supported by grant 09-60-25-LEWI from the American Association for Cancer Research and the Pancreatic Cancer Action Network (to BCL) and NIH grant R01 CA163296 (to CET). BJQ was supported by NIH award F30CA168063.
REFERENCES
1. Alexakis N, Halloran C, Raraty M, Ghaneh P, Sutton R, Neoptolemos JP. Current standards of surgery for pancreatic cancer. Br J Surg. 2004; 91:1410–1427.
2. Howlader N, Noone A, Krapcho M, Garshell J, Miller D, Altekruse S, Kosary C, Yu M, Ruhl J, Tatalovich Z, Mariotto A, Lewis D, Chen H, et al. SEER Cancer Statistics Review, 1975–2011, National Cancer Institute. Bethesda, MD, http://seer.cancer.gov/csr/1975_2011/, based on November 2013 SEER data submission, posted to the SEER web site, April 2014).
3. Distler M, Aust D, Weitz J, Pilarsky C, Grutzmann R. Precursor lesions for sporadic pancreatic cancer: PanIN, IPMN, and MCN. Biomed Res Int. 2014; 2014:474905.
4. Biankin AV, Waddell N, Kassahn KS, Gingras MC, Muthuswamy LB, Johns AL, Miller DK, Wilson PJ, Patch AM, Wu J, Chang DK, Cowley MJ, Gardiner BB, et al. Pancreatic cancer genomes reveal aberrations in axon guidance pathway genes. Nature. 2012; 491:399–405.
5. Collins MA, Brisset JC, Zhang Y, Bednar F, Pierre J, Heist KA, Galban CJ, Galban S and di Magliano MP. Metastatic pancreatic cancer is dependent on oncogenic Kras in mice. PLoS One. 2012; 7:e49707.
6. Collins MA, Bednar F, Zhang Y, Brisset JC, Galban S, Galban CJ, Rakshit S, Flannagan KS, Adsay NV, Pasca di Magliano M. Oncogenic Kras is required for both the initiation and maintenance of pancreatic cancer in mice. J Clin Invest. 2012; 122:639–653.
7. Ying H, Kimmelman AC, Lyssiotis CA, Hua S, Chu GC, Fletcher-Sananikone E, Locasale JW, Son J, Zhang H, Coloff JL, Yan H, Wang W, Chen S, et al. Oncogenic Kras maintains pancreatic tumors through regulation of anabolic glucose metabolism. Cell. 2012; 149:656–670.
8. Baines AT, Xu D, Der CJ. Inhibition of Ras for cancer treatment: the search continues. Future Med Chem. 2011; 3:1787–1808.
9. Alagesan B, Contino G, Guimaraes AR, Corcoran RB, Deshpande V, Wojtkiewicz GR, Hezel AF, Wong KK, Loda M, Weissleder R, Benes C, Engelman JA, Bardeesy N. Combined MEK and PI3K inhibition in a mouse model of pancreatic cancer. Clin Cancer Res. 2015; 21:396–404.
10. Infante JR, Somer BG, Park JO, Li CP, Scheulen ME, Kasubhai SM, Oh DY, Liu Y, Redhu S, Steplewski K, Le N. A randomised, double-blind, placebo-controlled trial of trametinib, an oral MEK inhibitor, in combination with gemcitabine for patients with untreated metastatic adenocarcinoma of the pancreas. Eur J Cancer. 2014; 50:2072–2081.
11. Junttila MR, Devasthali V, Cheng JH, Castillo J, Metcalfe C, Clermont AC, Otter DD, Chan E, Bou-Reslan H, Cao T, Forrest W, Nannini MA, French D, et al. Modeling targeted inhibition of MEK and PI3 kinase in human pancreatic cancer. Mol Cancer Ther. 2015; 14:40–47.
12. Dickson B, Sprenger F, Morrison D, Hafen E. Raf functions downstream of Ras1 in the Sevenless signal transduction pathway. Nature. 1992; 360:600–603.
13. Moodie SA, Willumsen BM, Weber MJ, Wolfman A. Complexes of Ras.GTP with Raf-1 and mitogen-activated protein kinase kinase. Science. 1993; 260:1658–1661.
14. Marte BM, Downward J. PKB/Akt: connecting phosphoinositide 3-kinase to cell survival and beyond. Trends Biochem Sci. 1997; 22:355–358.
15. Vidigal JA, Ventura A. The biological functions of miRNAs: lessons from in vivo studies. Trends Cell Biol. 2015; 25:137–147.
16. Hata A, Lieberman J. Dysregulation of microRNA biogenesis and gene silencing in cancer. Sci Signal. 2015; 8:re3.
17. Kort EJ, Farber L, Tretiakova M, Petillo D, Furge KA, Yang XJ, Cornelius A, Teh BT. The E2F3-Oncomir-1 axis is activated in Wilms’ tumor. Cancer Res. 2008; 68:4034–4038.
18. He L, Thomson JM, Hemann MT, Hernando-Monge E, Mu D, Goodson S, Powers S, Cordon-Cardo C, Lowe SW, Hannon GJ, Hammond SM. A microRNA polycistron as a potential human oncogene. Nature. 2005; 435:828–833.
19. Olive V, Jiang I, He L. mir-17–92, a cluster of miRNAs in the midst of the cancer network. Int J Biochem Cell Biol. 2010; 42:1348–1354.
20. Murphy BL, Obad S, Bihannic L, Ayrault O, Zindy F, Kauppinen S, Roussel MF. Silencing of the miR-17~92 cluster family inhibits medulloblastoma progression. Cancer Res. 2013; 73:7068–7078.
21. Olive V, Bennett MJ, Walker JC, Ma C, Jiang I, Cordon-Cardo C, Li QJ, Lowe SW, Hannon GJ, He L. miR-19 is a key oncogenic component of mir-17–92. Genes Dev. 2009; 23:2839–2849.
22. Volinia S, Calin GA, Liu CG, Ambs S, Cimmino A, Petrocca F, Visone R, Iorio M, Roldo C, Ferracin M, Prueitt RL, Yanaihara N, Lanza G, et al. A microRNA expression signature of human solid tumors defines cancer gene targets. Proc Natl Acad Sci USA. 2006; 103:2257–2261.
23. Szafranska AE, Davison TS, John J, Cannon T, Sipos B, Maghnouj A, Labourier E, Hahn SA. MicroRNA expression alterations are linked to tumorigenesis and non-neoplastic processes in pancreatic ductal adenocarcinoma. Oncogene. 2007; 26:4442–4452.
24. Yu J, Li A, Hong SM, Hruban RH, Goggins M. MicroRNA alterations of pancreatic intraepithelial neoplasias. Clin Cancer Res. 2012; 18:981–992.
25. Yu J, Ohuchida K, Mizumoto K, Fujita H, Nakata K, Tanaka M. MicroRNA miR-17–5p is overexpressed in pancreatic cancer, associated with a poor prognosis, and involved in cancer cell proliferation and invasion. Cancer Biol Ther. 2010; 10:748–757.
26. O’Donnell KA, Wentzel EA, Zeller KI, Dang CV, Mendell JT. c-Myc-regulated microRNAs modulate E2F1 expression. Nature. 2005; 435:839–843.
27. Conkrite K, Sundby M, Mukai S, Thomson JM, Mu D, Hammond SM, MacPherson D. miR-17~92 cooperates with RB pathway mutations to promote retinoblastoma. Genes Dev. 2011; 25:1734–1745.
28. Guinot A, Oeztuerk-Winder F, Ventura JJ. miR-17–92/p38alpha Dysregulation Enhances Wnt Signaling and Selects Lgr6+ Cancer Stem-like Cells during Lung Adenocarcinoma Progression. Cancer Res. 2016; 76:4012–4022.
29. Jin HY, Oda H, Lai M, Skalsky RL, Bethel K, Shepherd J, Kang SG, Liu WH, Sabouri-Ghomi M, Cullen BR, Rajewsky K, Xiao C. MicroRNA-17~92 plays a causative role in lymphomagenesis by coordinating multiple oncogenic pathways. EMBO J. 2013; 32:2377–2391.
30. Li Y, Choi PS, Casey SC, Dill DL, Felsher DW. MYC through miR-17–92 suppresses specific target genes to maintain survival, autonomous proliferation, and a neoplastic state. Cancer Cell. 2014; 26:262–272.
31. Uziel T, Karginov FV, Xie S, Parker JS, Wang YD, Gajjar A, He L, Ellison D, Gilbertson RJ, Hannon G, Roussel MF. The miR-17~92 cluster collaborates with the Sonic Hedgehog pathway in medulloblastoma. Proc Natl Acad Sci USA. 2009; 106:2812–2817.
32. Zhu H, Han C, Wu T. MiR-17–92 cluster promotes hepatocarcinogenesis. Carcinogenesis. 2015; 36:1213–1222.
33. Zindy F, Kawauchi D, Lee Y, Ayrault O, Ben Merzoug L, McKinnon PJ, Ventura A, Roussel MF. Role of the miR-17 approximately 92 cluster family in cerebellar and medulloblastoma development. Biol Open. 2014; 3:597–605.
34. Mu P, Han YC, Betel D, Yao E, Squatrito M, Ogrodowski P, de Stanchina E, D’Andrea A, Sander C, Ventura A. Genetic dissection of the miR-17~92 cluster of microRNAs in Myc-induced B-cell lymphomas. Genes Dev. 2009; 23:2806–2811.
35. Wu Q, Yang Z, An Y, Hu H, Yin J, Zhang P, Nie Y, Wu K, Shi Y, Fan D. MiR-19a/b modulate the metastasis of gastric cancer cells by targeting the tumour suppressor MXD1. Cell Death Dis. 2014; 5:e1144.
36. Li J, Yang S, Yan W, Yang J, Qin YJ, Lin XL, Xie RY, Wang SC, Jin W, Gao F, Shi JW, Zhao WT, Jia JS, et al. MicroRNA-19 triggers epithelial-mesenchymal transition of lung cancer cells accompanied by growth inhibition. Lab Invest. 2015; 95:1056–1070.
37. Cellura D, Pickard K, Quaratino S, Parker H, Strefford JC, Thomas GJ, Mitter R, Mirnezami AH, Peake NJ. miR-19-Mediated Inhibition of Transglutaminase-2 Leads to Enhanced Invasion and Metastasis in Colorectal Cancer. Mol Cancer Res. 2015; 13:1095–1105.
38. Kent OA, Mullendore M, Wentzel EA, Lopez-Romero P, Tan AC, Alvarez H, West K, Ochs MF, Hidalgo M, Arking DE, Maitra A, Mendell JT. A resource for analysis of microRNA expression and function in pancreatic ductal adenocarcinoma cells. Cancer Biol Ther. 2009; 8:2013–2024.
39. Li P, Xu Q, Zhang D, Li X, Han L, Lei J, Duan W, Ma Q, Wu Z, Wang Z. Upregulated miR-106a plays an oncogenic role in pancreatic cancer. FEBS Lett. 2014; 588:705–712.
40. Kawaguchi Y, Cooper B, Gannon M, Ray M, MacDonald RJ, Wright CV. The role of the transcriptional regulator Ptf1a in converting intestinal to pancreatic progenitors. Nat Genet. 2002; 32:128–134.
41. Ventura A, Young AG, Winslow MM, Lintault L, Meissner A, Erkeland SJ, Newman J, Bronson RT, Crowley D, Stone JR, Jaenisch R, Sharp PA, Jacks T. Targeted deletion reveals essential and overlapping functions of the miR-17 through 92 family of miRNA clusters. Cell. 2008; 132:875–886.
42. Krapp A, Knofler M, Ledermann B, Burki K, Berney C, Zoerkler N, Hagenbuchle O, Wellauer PK. The bHLH protein PTF1-p48 is essential for the formation of the exocrine and the correct spatial organization of the endocrine pancreas. Genes Dev. 1998; 12:3752–3763.
43. Magnuson MA, Osipovich AB. Pancreas-specific Cre driver lines and considerations for their prudent use. Cell Metab. 2013; 18:9–20.
44. Jackson EL, Willis N, Mercer K, Bronson RT, Crowley D, Montoya R, Jacks T, Tuveson DA. Analysis of lung tumor initiation and progression using conditional expression of oncogenic K-ras. Genes Dev. 2001; 15:3243–3248.
45. Collins MA, Yan W, Sebolt-Leopold JS, Pasca di Magliano M. MAPK signaling is required for dedifferentiation of acinar cells and development of pancreatic intraepithelial neoplasia in mice. Gastroenterology. 2014; 146:822–834.e827.
46. Corcoran RB, Contino G, Deshpande V, Tzatsos A, Conrad C, Benes CH, Levy DE, Settleman J, Engelman JA, Bardeesy N. STAT3 plays a critical role in KRAS-induced pancreatic tumorigenesis. Cancer Res. 2011; 71:5020–5029.
47. Driscoll DR, Karim SA, Sano M, Gay DM, Jacob W, Yu J, Mizukami Y, Gopinathan A, Jodrell DI, Evans TR, Bardeesy N, Hall MN, Quattrochi BJ, et al. mTORC2 Signaling Drives the Development and Progression of Pancreatic Cancer. Cancer Res. 2016; 76:6911–6923.
48. Friedman RC, Farh KK, Burge CB, Bartel DP. Most mammalian mRNAs are conserved targets of microRNAs. Genome Res. 2009; 19:92–105.
49. Finch AR, Caunt CJ, Perrett RM, Tsaneva-Atanasova K, McArdle CA. Dual specificity phosphatases 10 and 16 are positive regulators of EGF-stimulated ERK activity: indirect regulation of ERK signals by JNK/p38 selective MAPK phosphatases. Cell Signal. 2012; 24:1002–1011.
50. Chappell J, Sun Y, Singh A, Dalton S. MYC/MAX control ERK signaling and pluripotency by regulation of dual-specificity phosphatases 2 and 7. Genes Dev. 2013; 27:725–733.
51. Chen WT, Chen JM, Parsons SJ, Parsons JT. Local degradation of fibronectin at sites of expression of the transforming gene product pp60src. Nature. 1985; 316:156–158.
52. Murphy DA, Courtneidge SA. The ‘ins’ and ‘outs’ of podosomes and invadopodia: characteristics, formation and function. Nat Rev Mol Cell Biol. 2011; 12:413–426.
53. Linder S, Aepfelbacher M. Podosomes: adhesion hot-spots of invasive cells. Trends Cell Biol. 2003; 13:376–385.
54. Chen WT. Proteolytic activity of specialized surface protrusions formed at rosette contact sites of transformed cells. J Exp Zool. 1989; 251:167–185.
55. Beaty BT, Condeelis J. Digging a little deeper: the stages of invadopodium formation and maturation. Eur J Cell Biol. 2014; 93:438–444.
56. Hudson RS, Yi M, Esposito D, Glynn SA, Starks AM, Yang Y, Schetter AJ, Watkins SK, Hurwitz AA, Dorsey TH, Stephens RM, Croce CM, Ambs S. MicroRNA-106b-25 cluster expression is associated with early disease recurrence and targets caspase-7 and focal adhesion in human prostate cancer. Oncogene. 2013; 32:4139–4147.
57. Rios P, Nunes-Xavier CE, Tabernero L, Kohn M, Pulido R. Dual-specificity phosphatases as molecular targets for inhibition in human disease. Antioxid Redox Signal. 2014; 20:2251–2273.
58. Lin SC, Wang CC, Wu MH, Yang SH, Li YH, Tsai SJ. Hypoxia-induced microRNA-20a expression increases ERK phosphorylation and angiogenic gene expression in endometriotic stromal cells. J Clin Endocrinol Metab. 2012; 97:E1515–1523.
59. Keyse SM. Dual-specificity MAP kinase phosphatases (MKPs) and cancer. Cancer Metastasis Rev. 2008; 27:253–261.
60. Nomura M, Shiiba K, Katagiri C, Kasugai I, Masuda K, Sato I, Sato M, Kakugawa Y, Nomura E, Hayashi K, Nakamura Y, Nagata T, Otsuka T, et al. Novel function of MKP-5/DUSP10, a phosphatase of stress-activated kinases, on ERK-dependent gene expression, and upregulation of its gene expression in colon carcinomas. Oncol Rep. 2012; 28:931–936.
61. He G, Zhang L, Li Q, Yang L. miR-92a/DUSP10/JNK signalling axis promotes human pancreatic cancer cells proliferation. Biomedicine & pharmacotherapy = Biomedecine & pharmacotherapie. 2014; 68:25–30.
62. Wegiel B, Jiborn T, Abrahamson M, Helczynski L, Otterbein L, Persson JL, Bjartell A. Cystatin C is downregulated in prostate cancer and modulates invasion of prostate cancer cells via MAPK/Erk and androgen receptor pathways. PLoS One. 2009; 4:e7953.
63. Rigg AS, Lemoine NR. Adenoviral delivery of TIMP1 or TIMP2 can modify the invasive behavior of pancreatic cancer and can have a significant antitumor effect in vivo. Cancer Gene Ther. 2001; 8:869–878.
64. Jacob A, Prekeris R. The regulation of MMP targeting to invadopodia during cancer metastasis. Front Cell Dev Biol. 2015; 3:4.
65. Cioffi M, Trabulo SM, Sanchez-Ripoll Y, Miranda-Lorenzo I, Lonardo E, Dorado J, Reis Vieira C, Ramirez JC, Hidalgo M, Aicher A, Hahn S, Sainz B Jr, Heeschen C. The miR-17–92 cluster counteracts quiescence and chemoresistance in a distinct subpopulation of pancreatic cancer stem cells. Gut. 2015; 64:1936–1948.
66. Zagorac S, Alcala S, Fernandez Bayon G, Bou Kheir T, Schoenhals M, Gonzalez-Neira A, Fernandez Fraga M, Aicher A, Heeschen C, Sainz B Jr. DNMT1 Inhibition Reprograms Pancreatic Cancer Stem Cells via Upregulation of the miR-17–92 Cluster. Cancer Res. 2016; 76:4546–4558.
67. Collins MA, Yan W, Sebolt-Leopold JS, Pasca di Magliano M. MAPK signaling is required for dedifferentiation of acinar cells and development of pancreatic intraepithelial neoplasia in mice. Gastroenterology. 2014; 146:822–834 e827.
68. Jonkers J, Meuwissen R, van der Gulden H, Peterse H, van der Valk M, Berns A. Synergistic tumor suppressor activity of BRCA2 and p53 in a conditional mouse model for breast cancer. Nat Genet. 2001; 29:418–425.
69. Ahronian LG, Driscoll DR, Klimstra DS, Lewis BC. The p53R172H Mutant Does Not Enhance Hepatocellular Carcinoma Development and Progression. PLoS One. 2015; 10:e0123816.
70. Jones S, Zhang X, Parsons DW, Lin JC, Leary RJ, Angenendt P, Mankoo P, Carter H, Kamiyama H, Jimeno A, Hong SM, Fu B, Lin MT, et al. Core signaling pathways in human pancreatic cancers revealed by global genomic analyses. Science. 2008; 321:1801–1806.
71. Chen YW, Klimstra DS, Mongeau ME, Tatem JL, Boyartchuk V, Lewis BC. Loss of p53 and Ink4a/Arf cooperate in a cell autonomous fashion to induce metastasis of hepatocellular carcinoma cells. Cancer Res. 2007; 67:7589–7596.
72. Pignatelli J, Tumbarello DA, Schmidt RP, Turner CE. Hic-5 promotes invadopodia formation and invasion during TGF-beta-induced epithelial-mesenchymal transition. J Cell Biol. 2012; 197:421–437.
73. Fiedler SD, Carletti MZ, Christenson LK. Quantitative RT-PCR methods for mature microRNA expression analysis. Methods Mol Biol. 2010; 630:49–64.
74. Kozomara A, Griffiths-Jones S. miRBase: annotating high confidence microRNAs using deep sequencing data. Nucleic Acids Res. 2014; 42:D68–73.