
INTRODUCTION
Breast cancer is one of the most common cancers and the fifth leading cause of cancer-related deaths among women worldwide [1]. The clinical diagnostic methods for breast cancer include physical examinations, mammography and histopathology. In order to avoid poor prognosis and increase long-term survival, it is important to make an accurate diagnose as early as possible. However, a major factor that contributes to poor prognosis is the fact that diagnosis is often delayed due to limitation in the conventional diagnostic screening methods [2]. Although several tissue biomarkers have been identified, biopsy cannot be frequently repeated. Therefore, new sensitive and noninvasive biomarkers are still urgently needed to improve early detection rates of breast cancer.
Metabolomics, as the downstream of transcriptomics, genomics, and proteomics, is an emerging research field for detection, identification and quantification of low-molecular-weight metabolites that are involved in the metabolism in an organism at a specified time under specific environmental conditions [3]. Metabonomics can provide complementary information that cannot be obtained directly from the genotype, geneexpression profiles, or even the proteome of an organism [4]. In addition, it can identify early signals/biomarkers of cellular abnormalities that occur before the changes of gross phenotype [5]. Currently, metabolomics has been widely used in biomarker detection, disease diagnosis and evaluation of treatment and prognosis [6].
Among the various techniques of metabolic profiling, nuclear magnetic resonance(NMR) spectroscopy has been widely applied in metabolite identification and quantification as a reproductive, non-targeted and non-destructive method that requires minimal sample preparation [7]. Proton nuclear magnetic resonance (1H NMR) spectroscopy is especially sensitive because protons are present in virtually all metabolites [8]. Bioinformatics methods, such as the unsupervised (principal component analysis, PCA) and supervised (partial leastsquares- discriminant analysis, PLS-DA and orthogonal partial least-squares-discriminant anlaysis, OPLS-DA) methods are commonly applied to metabolomics data [9].
Currently, cancer metabolomics is gradually becoming a hot topic. Metabolomics methods could be used to monitor changes of specific metabolism in process of tumor development, to predict tumor progression, to monitor tumor response to intervention, to determining a characteristic metabolic pattern for cancer patients, to identify tumor associated biomarkers and to provide helps for early diagnosis, prognosis evaluation and efficacy analysis for cancer patients. Metabolomics has been successfully applied to biomarkers screening for many cancers, such as bladder [10], colon [11], lung [12] and prostate cancers [13]. However, metabolomics studies on breast cancer is rarely reported. Hence, serum and urine metabolomic profiles from breast cancer patients and healthy controls were obtained using 1H-NMR spectroscopy coupled with pattern recognition. The aim is to tap the potential biomarkers for early diognosis for breast cancer and to try to enhance understanding of the pathobiology of the disease.
RESULTS
1H-NMR spectrum of serum and urine
1H-NMR CPMG of serum and urine samples of group A and B are depicted in Figure 1. More than30 different metabolites were identified and quantified according to their chemical shifts and signal multiplicity. The main different peaks between the two groups are concentrated in the area of 0.5–5.5 and 6.5–9.0 ppm for serum samples and 0.5–9.0ppm for urine samples (Figure 1 and Figure 2). To conduct an overview of discrimination between group A and B, further analysis was applied.
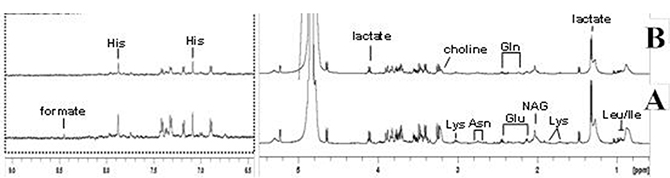
Figure 1: 1H NMR spectra (δ0.5-5.5 and δ6.5-9.0) of serum samples obtained from group (A and B). Keys: Asn: asparaginate; Gln: Glutamine; Glu: Glutamate; His: histidine; Ile: Isoleucine; Lys: Lysine; NAG: glucosaminidase.
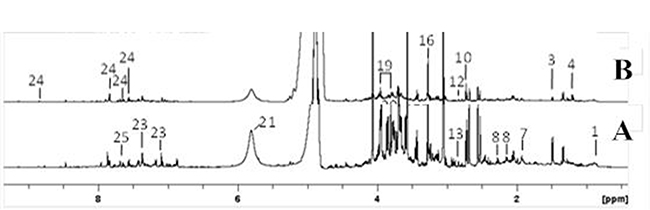
Figure 2: 1H NMR spectra (δ0.5-9.0) of urine samples obtained from group (A and B). Keys: 1: octanoate; 3: alanine; 4: 4-ethylphenol; 7,acetate, 8,N-acetylglutamate; 10,dimethylamine; 12,N,N-dimethylglycine; 13,sarcosine; 16, trimethylamine N-oxide; 19,phenylacetylglycine; 21,urea; 23,p-cresol glucuronide; 24,hippurate; 25,pseudouridine.
PCA
The PCA was first carried out and the score plot was obtained as in Figure 3. As can be seen from Figure 3, serum and urine samples in group A and B both have a tendency to separate, and specific biological information will be analyzed further.
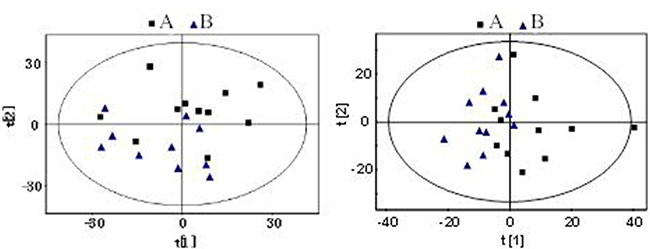
Figure 3: PCA scores plot based on 1H NMR spectra of serum and urine sample of groups (A and B). Serum and urine samples in group A and B both have a tendency to separate.
PLS-DA
Supervised analysis techniques were then used, including PLS-DA and OPLS-DA. Based on the PLS-DA models for serum samples, group A and group B were discriminated with an R2X of 0.39 and a Q2of 0.75(Figure 4), while the R2X and Q2 in PLS-DA model for urine samples of the two groups was 0.37 and 0.64 respectively (Figure 5). The models for serum and urine samples of group A and B were both valid, indicating that there were significant differences of metabolome for serum and urine samples between the two groups.
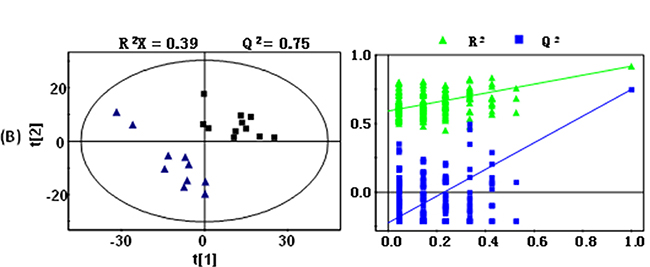
Figure 4: PLS-DA scores plots (left panel) derived from 1H NMR spectra of serum samples obtained from group (A and group B) and cross validation (right panel) by permutation test. Note: group A: black box (■); group B: blue triangle (▲).
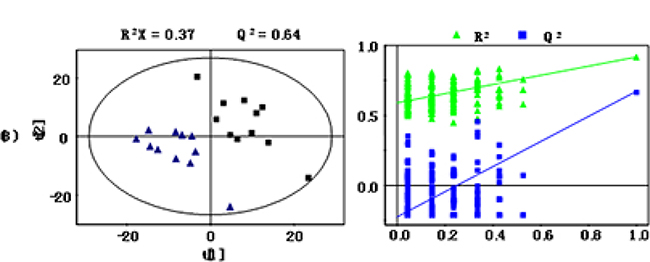
Figure 5: PLS-DA scores plots (left panel) derived from 1H NMR spectra of urine samples obtained from group (A and group B) and cross validation (right panel) by permutation test. Note: group A: black box (■); group B: blue triangle (▲).
OPLS-DA
The OPLS-DA model was constructed subsequent to PLS-DA analysis using the first principal component and the second orthogonal component as Figure 6 and Figure 7. The quality of the models was described by the cross-validation parameters R2X and Q2, which represented the total variation for the X matrix, and the values are tabulated in Table 1. In OPLS-DA score plots of serum sample, a significant biochemical distinction between groups A and B was identified with R2X = 0.39 and Q2 = 0.75 (Figure 6). In addition, some degree of separation for urine samples between groups A and B could also be visualized with R2X = 0.37 and Q2 = 0.58 (Figure 7).
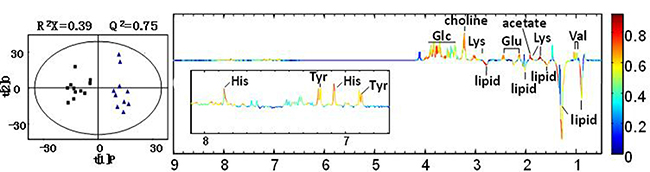
Figure 6: OPLS-DA scores plots (left panel) and corresponding coefficient loading plots (right panel) for serum samples of group (A and group B). The color map shows the significance of metabolites variations between the two classes. Peaks in the positive direction indicate metabolites that are more abundant in the groups in the positive direction of first principal component. Note: group A: black box (■); group B: blue triangle (▲).
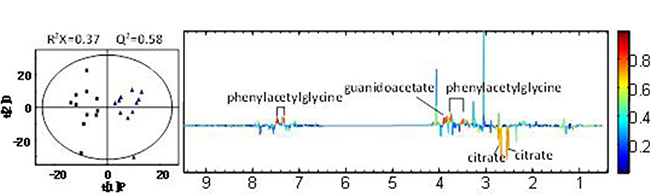
Figure 7: OPLS-DA scores plots (left panel) and corresponding coefficient loading plots (right panel) for urine samples of group (A and group B). Note: group A: black box (■); group B: blue triangle (▲).
Table 1: Clinical information of participants
Clinical features |
Group A |
Group B |
t |
P |
|---|---|---|---|---|
No. of women |
11 |
11 |
||
Age |
1.298 |
0.379 |
||
Median(years) |
58 |
59 |
||
Range |
45–72 |
46–70 |
||
BMI(kg/m2) |
21.3 ± 1.9 |
22.0 ± 1.2 |
1.560 |
0.204 |
Pathologic grade |
||||
I |
3 |
|||
II |
4 |
|||
III |
4 |
|||
Disease stage |
||||
I |
2 |
|||
II |
5 |
|||
III |
3 |
|||
IV |
1 |
|||
Lymph node metastasis |
||||
N0 |
5 |
|||
N1 |
6 |
Metabolites statistics for serum and urine
Metabolites with statistical significance were further summarized by analyzing the correlative coefficient derived from OPLS-DA. The correlation coefficient is then compared with the cut-off value table to obtain metabolites that cause differences between groups. Nine metabolites were detected at significantly different levels in serum samples between groups A and B as in Table 2. Compared with group B, the level of choline, glucose, histidine, valine, lysine, acetate, tyrosine and glutamic was significantly lower, while the level of lipid was significantly higher in serum samples of group A. In urine samples, the level of phenylacetylglycine and guanidoacetate was significantly lower, while the level of citrate was significantly higher in group A relative to group B (Table 3).
Table 2: OPLS-DA coefficients derived from the NMR data of different metabolites in serum
Metabolites |
ra |
|---|---|
Choline |
0.70 |
Glucose |
0.67 |
Histidine |
0.65 |
Valine |
0.69 |
Lipid |
−0.71 |
Lysine |
0.82 |
Acetate |
0.83 |
Tyrosine |
0.63 |
Glutamic |
0.74 |
aCorrelation coefficients, positive and negative signs indicate positive and negative correlation in the concentrations, respectively. The correlation coefficient of│r│> 0.602 was used as the cutoff value for the statistical significance based on the discrimination significance at the level of P = 0.05 and df(degree of freedom) = 9.
Table 3: OPLS-DA coefficients derived from the NMR data of different metabolites in urine
Metabolites |
ra |
|---|---|
Citrate |
−0.63 |
Phenylacetylglycine |
0.82 |
Guanidoacetate |
0.79 |
aCorrelation coefficients, positive and negative signs indicate positive and negative correlation in the concentrations, respectively. The correlation coefficient of│r│> 0.576 was used as the cutoff value for the statistical significance based on the discrimination significance at the level of P = 0.05 and df(degree of freedom) = 10.
DISCUSSION
As a heterogeneous disease, every kind of cancer has its own metabolic characteristics [14]. As we all know, the metabolic state of malignant tumor tissue than the normal tissue is more robust. Due to various factors inside and outside the body, the synthesis activity of DNA and RNase increased, while protein anabolism and catabolism are enhanced, and anabolism is more powerful than catabolism [15]. Even the decomposition products of normal tissue proteins are used to synthesize the nutrients needed by tumor tissue. Therefore, the occurrence and development of tumor are closely related to metabolic changes in the body [16]. Although metabolomics studies have been widely used in a variety of tumors, there are few reports using metabonomics to study biomarkers of breast cancer [17].
This study used an NMR-based metabonomics approach to develop a metabolic profile of patients with breast cancer. We demonstrate distinct differences in the spectra acquired between breast cancer patients and healthy controls. Based on statistical models, the technique has the potential to serve as a diagnostic tool for breast cancer and to identify metabolic features of the disease. In the present study, more than 30 metabolites were detected in the serum and urine samples of breast cancer patients and healthy controls based on the results of 1H-NMR. Nine metabolites were detected at significantly different levels in serum samples, while three metabolites were also detected in urine samples between breast cancer patients and healthy controls.
The process of amino acid metabolism is complex and involves a series of metabolites. Amino acids are raw materials of protein synthesis and catabolism products in vivo. The changes of amino acids composition and concentration can reflect the metabolic status of patients. Characteristics of amino acid metabolism in cancer patients include the following two points [18–19]: (1) uptake of amino acids is faster in tumor cells compared to normal cells, resulting in certain amino acids reducing in host body; (2) to meet the needs of growth and metabolism, tumor tissue with a nitrogen atom trap function, can take the initiative to compete with the host for nitrogen compounds and constantly ingest a variety of essential amino acids and non-essential amino acids for cells proliferation. In this study, there were significant differences in the contents of five amino acids in the serum between breast cancer patients and healthy controls. The serum levels of histidine, valine, lysine, tyrosine and glutamate in breast cancer patients were significantly lower than those in healthy controls. Among them, valine and lysine are essential amino acids, while histidine is a semi-essential amino acid.
In addition, a decrease of amino acids in cancer patients is closely related to malnutrition. It is reported that 40% to 80% of cancer patients are combined to malnutrition and weight loss in 15% of patients within 6 months from diagnosis is more than 10% [20]. In this study, the average BMI of 11 patients with breast cancer was 20.41 ± 1.35, which is lower than the normal population. Malnutrition would decrease the tolerance of cancer patients on surgery, chemotherapy, radiotherapy and other anti-tumor treatment and increase incidence of adverse reactions [21]. Therefore, doctors should pay attention to amino acid supplements for tumor patients.
It has been reported that amino acid metabolism of different kind of cancers has specificity [22]. Serum amino acid levels between esophageal cancer, osteosarcoma, lymphoma and soft tissue sarcoma showed inconsistencies. Experiments in vitro showed that the consumption of arginine, threonine, taurine and glutamine in liver cancer cells increased significantly [23]. Ye et al. [24] confirmed that serum concentration of tyrosine, glycine, glutamine, alanine, valine and isoleucine in cervical cancer patients was significantly lower than those in healthy controls. The results of this study showed that the consumption of histidine, valine, lysine, tyrosine and glutamate significantly increased in breast cancer patients. In addition, tumor stage may also affect the body’s amino acid levels. It was reported that the concentration of tyrosine, methionine and phenylalanine in patients with hepatocellular carcinoma increased with tumor stage [25]. However, due to the small sample size of this study, we did not carry out the study of staging and amino acid metabolism.
This study also showed that serum levels of choline and glucose in breast cancer patients were significantly lower than those in healthy controls. We speculate that this may also be due to the high consumption state. Serum levels of serum lipid in breast cancer patients were higher than healthy controls, indicating that the patient’s serum lipid metabolism was in a disorder state. In the urine sample, the content of phenylacetylglycine and guanidoacetate in serum of patients with breast cancer was significantly lower than that of healthy controls, while citrate content was significantly higher than that of healthy controls. All of these indicate that breast cancer patients are in high metabolic and high consumption state.
In conclusion, this study illustrates the successful application of 1H-NMR spectroscopy-based metabolomics for investigating the metabolic changes in serum and urine of patients with breast cancer. Our results indicate significant dysregulation of metabolic pathways in breast cancer patients. Specifically, we found that breast cancer was associated with metabolism disorder of amino acid, lipid and organic acids.
MATERIALS AND METHODS
Patients
This study was approved by the Ethics Committee of Shaanxi provincial people's hospital. All study participants provided written informed consent before participation. Eleven patients with pathological diagnose of breast cancer were recruited to this study as group A between September 2015 and November 2015, while 11 cases of healthy volunteers were from physical examination center of our hospital as group B during the same period. All the participants did not suffer from other tumors, diabetes and cardiovascular diseases. The clinical information of participants was summarized in Table 1. Age and BMI between the two groups has no significant difference(both P > 0.05).
Sample collection and storage
After fasting and avoiding alcohol and medicine for 12 hours, each participant was collected serum and urine in the early morning before undergoing any treatment. Venous blood samples were collected into plastic serum tubes (5 ml) and allowed to clot by standing tubes vertically at room temperature for 60 min. Serum was obtained after centrifugation at 3000 rpm for 10 min, and samples were stored at −80°C until analysis. Morning urine of all participants were collected and immediately frozen at −80°C until for analysis.
Instruments, reagents and software
Instruments used were as follows: NMR Varian Inova 600MHz configured with ultra-low temperature probe(Varian, Palo Alto, USA); Heraeus sepatech TGL-16B (Anting Scientific Instrument Factory, Shanghai, China); ultra cold storage freezer of −80°C (SANYO Electric Biomedical co.,Ltd, JP). All the reagents were purchased from Sigma–Aldrich(St Louis, MO, USA), unless stated otherwise. Software used were as follows: MestReNova software (V7.0, USA) TOPSPIN(V2.1, GER); AMIX software (V3.9.11, GER); SIMCA-P+ software package (soft independent modeling of class analog, V11.0, Umetrics AB, Umea, SWE).
Specimen preparation for 1H-NMR analysis
Serum and urine samples were thawed at room temperature and homogenized using a vortex mixer. Then 170 μl D2O and 30 μl PB solution(600 mmol/L) were added to 400 ml serum. After centrifugation at 12000 rpm for 10 min at 4°C, 550 μl of the supernatants was transferred into 5-mm NMR tubes and stored at 4°C until analysis. 100 μl PB solution(600 mmol/L) including TSP was added to 500 μl urine. 500 μl of the supernatants was dispensed into 5-mm NMR tubes for analysis after mixing, 5 min in room temperature and 12000 rpm for 10 min at 4°C.
1H-NMR analysis
All NMR data were recorded using a Varian Unity INOVA 600 MHz AVANCE II spectrometer equipped with a 5 mm triple resonance inverse cryoprobe and a z-gradient system at 599.92 MHz. The temperature of the samples was controlled at 25°C during measurement. Prior to data acquisition, tuning and matching of the probe head followed by shimming and proton pulse calibration were performed automatically for each sample. For each sample, 1H Carr-Purcell-Meiboom-Gill (CPMG; 80 ms spin-lock eliminating the broad resonance lines of high molecular weight compounds in the serum specimens) sequence was applied to transverse relaxation weighted experiment to filter out signals belonging to proteins and other macromolecules, and then one-dimensional (1D) 1H NOESY (RD-90°-t1-90°-tm-90°-ACQ) spectra were recorded. For each spectrum of serum samples, 96 scans were accumulated with 2.1 s relaxation delay, a spectral width of 8000 Hz, 100ms total echo time and 1.0 s direct acquisition time, while for urine samples 64 scans were accumulated with 2.1 s relaxation delay, a spectral width of 8384.9 Hz, 100 ms total echo time and 0.9541 s direct acquisition time.
1H-NMR spectral data processing
To reduce the complexity of the NMR data and facilitate the pattern recognition, the raw NMR data were manually Fourier transformed using MestReNova V7.0 software before data processing. The 1H-NMR spectra of all samples were phase adjusted and baseline corrected using Topspin software V2.1. The serum samples were scaled referencing to lactate bimodal resonance at 1.33 ppm, while the urine samples was scaled referencing to TSP at 0.0 ppm. The spectra ranging from 0.5 to 9.0 ppm was subsequently divided into 1700 integral segments corresponding to 0.005 ppm using AMIX software V3.9.11. The regions of 4.2–6.5 ppm were removed to eliminate the influence of the water and urea peak. In addition, the integrated data were normalized before pattern recognition analysis to eliminate the dilution or bulk mass differences among samples by the total area normalization way.
Multivariate statistics
The standardized data were import to SIMCA-P + package for multivariate analysis, including principal component analysis(PCA) and partial least squares-discriminate analysis(PLS-DA). The first and second principal component were taken for PCA, PLS-DA and orthogonal partial least-squares discriminant analysis(OPLS-DA). The results of PCA was displayed by score plot to observe the main cluster sampling and abnormal outliers. Then PCA and PLS-DA analysis were conducted again for further verification between different comparison groups. Standardization of PLS-DA was done by unit variance scaling, the results was also displayed by score plot, and the accuracy of the model was verified by cross-validation and permutations experiment. A 20-fold cross-validation was employed to obtain Q2 and R2 values, which represent the predictive ability of the model and the explained variance, respectively. To further validate the quality of the PLS-DA model, permutation tests consisting of a randomly permuting class membership and running 200 iterations were carried out. The verified model was further analyzed using OPLS-DA displayed by score plot according to which the significantly changed metabolites were extracted. Loading diagram showed the significantly changed metabolites and their contribution(correlation coefficient of r value represented the contribution of different metabolites). The sensitivity, specificity, and classification rate(percentage of samples correctly classified) of OPLS-DA models were then depicted. Significant differences were detected by Pearson correlation coefficient to determine significantly changed metabolites and to give them reasonable biological explanation.
Consent
Written informed consent was obtained from patients and healthy controls for the publication of this report and any accompanying images.
ACKNOWLEDGEMENTS
We are grateful to the participants in this study.
CONFLICTS OF INTEREST
None to declare.
REFERENCES
1. Bhandari PM, Thapa K, Dhakal S, Bhochhibhoya S, Deuja R, Acharya P, Mishra SR. Breast cancer literacy among higher secondary students: results from a cross-sectional study in Western Nepal. BMC Cancer. 2016; 16:119.
2. Lomakina ME, Lallemand F, Vacher S, Molinie N, Dang I, Cacheux W, Chipysheva TA, Ermilova VD, de Koning L, Dubois T, Bièche I, Alexandrova AY, Gautreau A. Arpin downregulation in breast cancer is associated with poor prognosis. Br J Cancer. 2016; 114:545–53.
3. Lin Y, Ma C, Liu C, Wang Z, Yang J, Liu X, Shen Z, Wu R. NMR-based fecal metabolomics fingerprinting as predictors of earlier diagnosis in patients with colorectal cancer. Oncotarget. 2016; 7:29454–64. doi: 10.18632/oncotarget.8762.
4. Chai Y, Wang J, Wang T, Yang Y, Su J, Shi F, Wang J, Zhou X, He B, Ma H, Liu Z. Application of 1H NMR spectroscopy-based metabonomics to feces of cervical cancer patients with radiation-induced acute intestinal symptoms. Radiother Oncol. 2015; 117:294–301.
5. Wang H, Wang L, Zhang H, Deng P, Chen J, Zhou B, Hu J, Zou J, Lu W, Xiang P, Wu T, Shao X, Li Y, et al. 1H NMR-based metabolic profiling of human rectal cancer tissue. Mol Cancer. 2013; 12:1–12.
6. Harris T, Degani H, Frydman L. Hyperpolarized 13C NMR studies of glucose metabolism in living breast cancer cell cultures. NMR Biomed. 2013; 26:1831–43.
7. DeFeo EM, Wu CL, McDougal WS, Cheng LL. A decade in prostate cancer: from NMR to metabolomics. Nat Rev Urol. 2011; 8:301–11.
8. Garcia E, Andrews C, Hua J, Kim HL, Sukumaran DK, Szyperski T, Odunsi K. Diagnosis of early stage ovarian cancer by 1H NMR metabonomics of serum explored by use of a microflow NMR probe. J Proteome Res. 2011; 10:1765–71.
9. Hasim A, Ma H, Mamtimin B, Abudula A, Niyaz M, Zhang LW, Anwer J, Sheyhidin I. Revealing the metabonomic variation of EC using ¹H-NMR spectroscopy and its association with the clinicopathological characteristics. Mol Biol Rep. 2012; 39:8955–64.
10. Putluri N, Shojaie A, Vasu VT, Vareed SK, Nalluri S, Putluri V, Thangjam GS, Panzitt K, Tallman CT, Butler C, Sana TR, Fischer SM, Sica G, et al. Metabolomic profiling reveals potential markers and bioprocesses altered in bladder cancer progression. Cancer Res. 2011; 71:7376–86.
11. Nishiumi S, Kobayashi T, Ikeda A, Yoshie T, Kibi M, Izumi Y, Okuno T, Hayashi N, Kawano S, Takenawa T, Azuma T, Yoshida M. A novel serum metabolomics-based diagnostic approach for colorectal cancer. PLoS One. 2012; 7:e40459–40459.
12. Deja S, Porebska I, Kowal A, Zabek A, Barg W, Pawelczyk K, Stanimirova I, Daszykowski M, Korzeniewska A, Jankowska R, Mlynarz P. Metabolomics provide new insights on lung cancer staging and discrimination from chronic obstructive pulmonary disease. J Pharm Biomed Anal. 2014; 100:369–80.
13. Sreekumar A, Poisson LM, Rajendiran TM, Khan AP, Cao Q, Yu J, Laxman B, Mehra R, Lonigro RJ, Li Y, Nyati MK, Ahsan A, Kalyana-Sundaram S, et al. Corrigendum: metabolomic profiles delineate potential role for sarcosine in prostate cancer progression. Nature. 2013; 499:504.
14. Lee DS, Kim SJ, Jang HS, Yoo IR, Park KR, Na SJ, Lee KY, Hong SH, Kang JH, Kim YK, Kim YS. Clinical Correlation Between Tumor Maximal Standardized Uptake Value in Metabolic Imaging and Metastatic Tumor Characteristics in Advanced Non-small Cell Lung Cancer. Medicine (Baltimore). 2015; 94:e1304.
15. Morandi A, Chiarugi P. Metabolic implication of tumor:stroma crosstalk in breast cancer. J Mol Med (Berl). 2014; 92:117–26.
16. Giskeødegård GF, Grinde MT, Sitter B, Axelson DE, Lundgren S, Fjøsne HE, Dahl S, Gribbestad IS, Bathen TF. Multivariate modeling and prediction of breast cancer prognostic factors using MR metabolomics. J Proteome Res. 2010; 9:972–79.
17. Weljie AM, Bondareva A, Zang P, Jirik FR. (1)H NMR metabolomics identification of markers of hypoxia-induced metabolic shifts in a breast cancer model system. J Biomol NMR. 2011; 49:185–93.
18. Li Z, Zhang H. Reprogramming of glucose, fatty acid and amino acid metabolism for cancer progression. Cell Mol Life Sci. 2016; 73:377–92.
19. Geck RC, Toker A. Nonessential amino acid metabolism in breast cancer. Adv Biol Regul. 2016; 62:11–17.
20. Ananieva E. Targeting amino acid metabolism in cancer growth and anti-tumor immune response. World J Biol Chem. 2015; 6:281–89.
21. Kabata P, Jastrzębski T, Kąkol M, Król K, Bobowicz M, Kosowska A, Jaśkiewicz J. Preoperative nutritional support in cancer patients with no clinical signs of malnutrition—prospective randomized controlled trial. Support Care Cancer. 2015; 23:365–70.
22. Martin E, González-Horta C, Rager J, Bailey KA, Sánchez-Ramírez B, Ballinas-Casarrubias L, Ishida MC, Gutiérrez-Torres DS, Hernández Cerón R, Viniegra Morales D, Baeza Terrazas FA, Saunders RJ, Drobná Z, et al. Metabolomic characteristics of arsenic-associated diabetes in a prospective cohort in Chihuahua, Mexico. Toxicol Sci. 2015; 144:338–46.
23. Lake AD, Novak P, Shipkova P, Aranibar N, Robertson DG, Reily MD, Lehman-McKeeman LD, Vaillancourt RR, Cherrington NJ. Branched chain amino acid metabolism profiles in progressive human nonalcoholic fatty liver disease. Amino Acids. 2015; 47:603–15.
24. Ye N, Liu C, Shi P. Metabolomics analysis of cervical cancer, cervical intraepithelial neoplasia and chronic cervicitis by 1H NMR spectroscopy. Eur J Gynaecol Oncol. 2015; 36:174–80.
25. Musialik J, Jonderko K, Kasicka-Jonderko A, Buschhaus M. (13)CO2 breath tests in non-invasive hepatological diagnosis. Prz Gastroenterol. 2015; 10:1–6.