
INTRODUCTION
Facial features and expressions are key elements of non-verbal communication and mutual identification, and show significant particularities and differences between individuals. Facial morphological characteristics are related to the expression of several genes [1–5], and closely linked to the activity of several signaling pathways, including BMP, SHH, FGF, ENPP1 and Wnt/β-catenin [6–9]. Notwithstanding, our current understanding of the development of facial morphology comes mainly from anatomical research, and the possible influence of single base DNA mutations (single-nucleotide polymorphisms, SNPs) remains scantily explored. In recent years, however, the possible association between gene polymorphisms and facial morphology, related in particular to differences in facial features among ethnic groups, has become an attractive research topic.
A few studies have addressed the genetic regulation of facial morphogenesis and put forward a series of candidate genes. IRF6 (interferon regulatory factor 6) is a key factor in the growth and development of keratinocytes. Peng et al. [10] found that there was a significant correlation between the expression of IRF6 and the morphology of the mouth in Chinese Han women. ENPP1 (ectonucleotide pyrophosphatase/phosphodiesterase 1) encodes an enzyme that negatively regulates bone mineralization. When mutated at 5′UTR and 3′UTR, it leads to a change in the height of the upper face [11]. The GHR (growth hormone receptor) gene affects the normal growth and development of the human body. Two GHR genetic variants, Pro561Thr (rs6184) and I526L (rs6180), have been shown to alter mandible height in an East Asian population [11]. FGFR1 (fibroblast growth factor receptor 1) affects normal facial morphology development in humans, and is associated with the cephalic index in multiple populations [11].
The Kashi area is located in the southwest of the Xinjiang Uygur Autonomous Region in northwest China, where the Uygur people are the largest ethnic minority group. The Uygur population presents a Mongolian and Caucasian mixed ancestry, and their facial features, especially the orbital contours resembling Caucasian and European ethnic populations, contribute to the characteristic Uygur facial physiognomy. Guo et al. [12] analyzed high-resolution 3D images of soft-tissue facial forms in four Eurasian populations, including Han Chinese, Tibetans, Uygur and Europeans. Their results showed that among-population differentiation was higher for soft-tissue facial forms than for genome-wide genetic loci. High-resolution data analysis showed that Europeans and Han people had significant differences in the nose, eyebrows region, and cheeks. Thus, we used a high-resolution 3D image acquisition system to study the effect of SNPs on facial morphology in a sample of the Uygur population.
RESULTS
Hardy-Weinberg equilibrium analysis. Hardy-Weinberg equilibrium (HWE) tests were performed using the exact test to assess the representativity of the population. Through SNP analyses, we found that ENPP1 rs7773292 did not meet the HW equilibrium, while all other mutation sites did. Linkage disequilibrium (LD) analysis was done in 578 individuals. For the ENPP1 gene, ENPP1 rs7773292 was cut off at 5% HWE p level, so 3 SNP loci were included in the LD analysis, namely rs6925433, rs6569759, and rs7754561. The D’ values of rs6925433 and rs6569759, rs6569759 and rs7754561, and rs6925433 and rs7754561 were 0.14, 0.14, and 0.07, respectively, denoting a low degree of linkage disequilibrium. For the GHR gene, the D’ value of rs6180 and rs6184 was close to 1, denoting a high level of LD between the sites. Thus, rs6180 and rs6184 sites may be closely linked. For the FGFR1 gene, the D’ value of rs4647905 and rs3213849 was 0.67 (low LD). For the IRF6 gene, the D’ value of rs642961 and rs2236907 was 0.93 (high LD).
Correlation between SNPs and facial landmark distances
The distance between pairs of facial landmarks on 3D images was measured and contrasted with matched SNP genotyping data from study subjects.
ENPP1 SNPs
Through analysis of variance, we found a significant association between the ENPP1 rs7754561 polymorphism and the linear distance of both RAla-RLipCn (p = 0.044) and RLipCn-Sbn (p = 0.012). This SNP also influenced the curve distance of RLipCn-Stm (p = 0.042) (Table 1). The linear distance of RAla-RLipCn was longer (31.14 ± 2.86 mm) in individuals carrying the GA genotype than in those with the GG (30.88 ± 2.44 mm) or AA (30.13 ± 1.99 mm) genotypes. The linear distance of RLipCn-Sbn was also longer for the GA genotype (37.80 ± 3.06 mm), compared with GG (36.77 ± 3.49 mm) and AA (36.61 ± 3.16 mm) genotypes. A similar trend was observed the curve distance of RLipCn-Stm, where the GA genotype was associated with a longer inter-landmark distance (27.68 ± 5.13 mm) than that measured for the GG (26.30 ± 2.87 mm) and AA (26.73 ± 2.86 mm) genotypes (Table 1). In all cases, significant differences were detected between the GA and the AA genotypes.
Table 1: Association between rs7754561 in the ENPP1 gene and facial landmark pairs distances
SNP |
Landmark distance (mm) |
||
|---|---|---|---|
RAla-RLipCn(s) |
RLipCn-Sbn(s) |
RLipCn-Stm(c) |
|
G/G |
30.88 ± 2.44 |
36.77 ± 3.49 |
26.30 ± 2.87 |
G/A |
31.14 ± 2.86 |
37.80 ± 3.06 |
27.68 ± 5.13 |
A/A |
30.13 ± 1.99 |
36.61 ± 3.16 |
26.73 ± 2.86 |
F |
3.14 |
4.47 |
3.20 |
P |
0.044 |
0.012 |
0.042 |
s: straight-line distance; c: curve distance.
p < 0.05 indicates statistical significance.
FGFR1 SNPs
An association was found between the FGFR1 rs4647905 polymorphism and the linear distance of LLipCn-Nsn (p = 0.042; Table 2). Distances for this landmark pair were 78.02 ± 6.36 mm for the GG genotype, 79.59 ± 5.08 mm for the CG genotype, and 77.77 ± 6.01 mm for the CC genotype; the mean inter-landmark distance of individuals carrying the CG genotype was significantly longer than for those carrying the CC genotype.
Table 2: Association between rs4647905 in the FGFR1 gene and facial landmark pairs distances
SNP |
Landmark distance |
|---|---|
LLipCn-Nsn(s) |
|
G/G |
78.02 ± 6.36 |
C/G |
79.59 ± 5.08 |
C/C |
77.77 ± 6.01 |
F |
3.21 |
P |
0.042 |
s: straight-line distance.
p < 0.05 indicates statistical significance.
GHR SNPs
A significant association was detected between the GHR rs6180 polymorphism and the linear distance of RLipCn-Stm (p = 0.04; Table 3). Distances were 28.34 ± 7.2 mm for the AA genotype, 26.98 ± 3.2 for the CA genotype, and 26.59 ± 3.1 mm for the CC genotype, and the mean distance in the AA genotype was significantly longer than that of the CC genotype. GHR rs6180 was also associated with the curve distance of RLipCn-Stm, i.e. 27.27 ± 7.07 mm for the AA genotype, 25.88 ± 2.95 mm for the CA genotype, and 25.64 ± 2.92 mm for the CC genotype; the mean distance for the AA genotype was significantly longer than that of the CC genotype (Table 3).
Table 3: Association between rs6180 and rs6184 in the GHR gene and facial landmark pairs distances
SNP |
Landmark distance |
SNP |
Landmark distance |
|
|---|---|---|---|---|
RLipCn-Stm(s) |
RLipCn-Stm(c) |
RLipCn-ULipP(c) |
||
A/A |
28.34 ± 7.2 |
27.27 ± 7.07 |
C/C |
31.01 ± 3.22 |
C/A |
26.98 ± 3.2 |
25.88 ± 2.95 |
C/A |
32.27 ± 2.88 |
C/C |
26.59 ± 3.1 |
25.64 ± 2.92 |
A/A |
28.76 |
F |
3.25 |
3.25 |
F |
3.09 |
P |
0.04 |
0.04 |
p |
0.047 |
s: straight-line distance; c: curve distance.
p < 0.05 indicates statistical significance.
Lastly, a significant association was found between the GHR rs6184 polymorphism and the curve distance of RLipCn-ULipP (p = 0.047). Mean curve distance was 31.01 ± 3.22 mm in the CC genotype, 32.27 ± 72.88 mm in the CA genotype, and 28.76 mm in the AA genotype.
DISCUSSION
Facial morphology is one of the most easily recognizable features of human beings. While the main genetic pathways defining craniofacial morphogenesis have been elucidated, the extent to which small genetic variations influence facial physiognomy is largely unknown. This study collected SNP genotyping data and 3D facial images from 578 Uygur volunteers (220 males and 358 females, 18 to 25 years old) from the Kashi area of Xinjiang, China, to analyze the relationship between gene polymorphisms and facial morphology. Our results showed that rs7754561 in the ENPP1 gene, rs4647905 in the FGFR1 gene, and rs6180 and rs6184 in the GHR gene are associated with morphometric facial features.
ENPP1 polymorphisms
Ectonucleotide pyrophosphatase/phosphodiesterase 1 (ENPP1), a membrane-bound ectoenzyme, is one of the key enzymes controlling bone mineralization through its modulation of Pi/PPi levels. The activity of this enzyme leads to production of PPi by catalyzing the hydrolysis of the phosphodiester I bond of nucleoside triphosphates [13]. ENPP1 expression correlates with osteoblast differentiation, and osteoblast cultures overexpressing ENPP1 contain elevated amounts of PPi and show reduced mineral formation [14]. Ermakov et al. [11] investigated the association of polymorphisms in the ENPP1 locus with normal variability of craniofacial phenotypes in 1,042 Western Eurasian individuals, and found that ENPP1 gene polymorphisms were associated with upper facial height. Additionally, associations were detected between head breadth and lower face height, and markers residing in or close to the promoter and 3′UTR of the ENPP1 gene.
In our research, there was a significant difference in the linear distance between RAla-RLipCn for the ENPP1 rs7754561 polymorphism. When the AA, instead of the GA, genotype was present, the linear distance between the nose and the mouth became shorter. As the distance between the sides of the middle nose to the lips is shortened, the distance from the nose to the lips is also shortened, thus locally influencing lower anterior face height. We found also a significant association between rs7754561 and the linear distance of RLipCn-Sbn. Individuals with GG or AA, rather than GA genotypes, showed a shorter linear distance from the nasal floor to the right mouth corner; in the lower anterior face, the distance from the nasal floor to the upper lip is shortened, making the philtrum shorter, increasing the upper lip height, and shortening the width of the lips. The ENPP1 rs7754561 polymorphism was also correlated with the curve distance of RLipCn-Stm when the genotype was GA, making the distance from the right lip corner to the stomion longer. Consequently, the width between the two lips’ corners, and the width of the stomion, becomes longer. Thus, the ENPP1 rs7754561 polymorphism was associated with variations in the lower anterior face landmarks such as the distance of the subnasale point to the chin, the distance from the subnasale to the lips, and the width of the lips. Based on these observations, we hypothesize that the putative functional genetic variant in this region, most likely in the 3′UTR, affects the stability of ENPP1 mRNA, which in turn influences the local Pi/PPi levels and bone mineralization. This likely cause generalized effects on skeletal development, affecting facial morphological features.
FGFR1 polymorphisms
Fibroblast growth factors play important roles in the differential growth of the skull, brain, and facial prominences. Gómezvaldés et al. [15] evaluated the relationships between FGFR1 polymorphisms and cephalometric measurements and indices in one Mexican Native and two mestizo Mexican populations, and found a tendency for a decrease in cephalic index in individuals homozygous for the allele rs4647905C; when General Linear Model analyses were performed, a statistically significant association was found between four SNPs in FGFR1 and head length in the mestizo population. In our research, we found that there was a significant association between the FGFR1 rs4647905 polymorphism and the linear distance of LLipCn-Nsn, affecting the middle anterior face height, and the distance of the upper lip to the subnasale. We surmised that when mutated, this allele shortens the distance from the right lip corner to the nasion. Thus, the middle anterior face height will be reduced, affecting the height of the nasal dorsum and the distance between the upper lip and the nasal floor.
GHR polymorphisms
Bayram et al. [16] evaluated allelic and genotype frequencies of the P561T and C422F polymorphic sites of the GHR gene and their association with mandibular prognathism, and found that effective mandibular length (condylion-gnathion) and lower face height (anterior nasal spina-menton) were associated with the P561T variant. Zhou et al. [17], on the other hand, used quantitative trait locus mapping methods to evaluate the relationship between craniofacial morphology and SNPs in GHR in an unselected, healthy Chinese population. Their results showed that individuals with the genotype CC of polymorphism I526L had a significantly greater mandibular ramus length (condylion-gonion/articulare-gonion) than those with genotypes AC or AA. Our results indicated that rs6180 in the GHR gene influences the width of the oral fissure. GHR rs6184, in contrast, was associated with the height and width of the upper lip, and also influenced the protrusion of the lip.
3D facial imaging and morphometry
Three-dimensional grating facial scanning technology is a new non-contact scanning method, by which point cloud data can be converted into three-dimensional images that can be directly processed by specialized image analysis software. Optical scanning technology has many advantages, as it allows non-invasive, highly accurate and fast data acquisition, and is therefore considered a very promising facial image acquisition and measurement technology [18, 19]. Three-dimensional grating facial scanning technology is currently the preferred method for facial morphometric analysis.
In conclusion, this is the first study to assess the effect of gene polymorphisms on facial morphology in the Uygur population from the Kashi area of Xinjiang, China. The results revealed that ENPP1 and FGFR1 gene polymorphisms are associated with the lower anterior face height, the distance between the upper lip and nasal floor, and lip shape. FGFR1 SNPs may also influence the lower anterior face height, while GHR gene polymorphisms are associated with the length and width of the lips.
MATERIALS AND METHODS
Ethics statement
Sample collection in this study was carried out with the approval of the ethics committee of the First Affiliated Hospital of Xinjiang Medical University and in accordance with the standards of the Declaration of Helsinki. Written informed consent was obtained from every participant.
Sample collection
807 volunteers aged 18–25 years old from the Uygur population in the Xinjiang Kashi area participated in the study. We removed 177 individuals based on the exclusion criteria. 37 individuals were further excluded due to poor DNA sample quality. In addition, 15 subjects with a typing call rate <95% were excluded. Thus, 578 individuals (358 females, 220 males) were available for 3D imaging and successful genotyping of the 10 candidate SNPs. 3 ml of saliva was collected from each participant for DNA extraction.
Sample inclusion criteria included: 1) no dentition defects; 2) absence of dental caries caused by a dentition defect and altered jaw gum height; 3) no facial outgrowths or deformities. Exclusion criteria included: 1) Individuals with obvious health problems or any history of facial surgery; 2) Refined facial images after obvious distortions did not allow reconstruction of actual facial features.
DNA extraction and genotyping
Based on a new 3D face reconstruction method utilized by Peng et al., that enables subtle differences to be detected at high resolution in 3D images, we analyzed the associations of 10 candidate SNPs with common facial morphological variations [10]. The SNP analyzed were: ENPP1 gene, rs7773292, rs6925433, rs6569759, and rs7754561; GHR gene, rs6180 and rs6184; FGFRl gene, rs4647905 and rs3213849; IRF6 gene, rs642961 and rs2236907 (Table 4).
Table 4: Basic characteristics of selected variants
SNPs |
Gene |
Allele |
Chr |
Position |
HWE-p |
Reference |
|---|---|---|---|---|---|---|
rs7773292 |
ENPP1 |
C/T |
6 |
132099761 |
0.0439 |
[10] |
rs6925433 |
ENPP1 |
A/G |
6 |
132119366 |
0.9647 |
[10] |
rs6569759 |
ENPP1 |
A/G |
6 |
132133116 |
0.6407 |
[10] |
rs7754561 |
ENPP1 |
A/G |
6 |
132212694 |
1 |
[10] |
rs6180 |
GHR |
A/C |
5 |
42719239 |
0.3297 |
[10] |
rs6184 |
GHR |
A/C |
5 |
42719344 |
1 |
[10] |
rs4647905 |
FGFR1 |
C/G |
8 |
38272542 |
0.6102 |
[10] |
rs3213849 |
FGFR1 |
A/G |
8 |
38326046 |
0.7746 |
[10] |
rs642961 |
IRF6 |
A/G |
1 |
209989270 |
0.1457 |
[10] |
rs2236907 |
IRF6 |
A/C |
1 |
209971628 |
0.5128 |
[10] |
Genomic DNA was extracted from saliva following a modified SDS-based DNA extraction method. DNA concentration was measured with a NanoDrop spectrophotometer. Primers were designed using the web-based Primer3 software (Table 5). SNP genotyping was performed with the SNaPshot multiplex system on an ABI3130xl genetic analyzer (Applied Biosystems).
Table 5: Primer sequences of selected variants
SNP |
Primer Sequence |
|---|---|
rs2236907F |
CAACCCCCTACGGGAGATTTCA |
rs2236907R |
GGCTCTGGTTCTGGGTTGGTCT |
rs3213849F |
CAATGCGCTACGAGGGGTCTC |
rs3213849R |
CGCGGCTGGGGAACTACAAG |
rs4647905F |
CACCCATGCAACTAGCCGACTT |
rs4647905R |
GTAAGGGCTGGCCTGGTTTGAG |
rs6180_rs6184F |
AATGTGACATGCACCCGGAAAT |
rs6180_rs6184R |
GAGGCCCTGTGGGGACTGTACT |
rs642961F |
GTCATGAAGGGGAACCTGAGGA |
rs642961R |
TGCTCTGAGCCTGAGCGAAACT |
rs6569759F |
GAGGGAATGAGATGGGCAGAAGTA |
rs6569759R |
CGCTGCTCTGTCCCCTTATTTTT |
rs6925433F |
ATTGAGGATCCAGCCCCTTCTT |
rs6925433R |
GGTGTACCAGTTATGTCTGCAAAGGAT |
rs7754561F |
ACATGCCACCAATCACCTCACA |
rs7754561R |
AAGTCTTTGCAGCTGGCCCTTA |
rs7773292F |
CCCTTCCCCTTCATCCCTCTCT |
rs7773292R |
GGCACAGAAGCTGATGGCATTT |
High density 3D facial image collection and registration
Facial 3D data was acquired using Geomagic’s non-contact facial three-dimensional raster scanner (3D Systems, SC, USA). The subjects were in a sitting position and the scanning distance was 1.2 m. Both men and women were instructed to have their foreheads exposed, a relaxed and neutral facial expression, and to look at the top of the scanner’s three-point objective lens. Face scanning precision was set to 0.02 mm, capturing 50,000 points per second. Upon completion of the scan, the subject’s face CAD model was exported in STL format.
Data processing of 3D scanned images
3D facial scanned images were imported into Geomagic studio software. Images were refined, missing parts of the scan were filled, and image outlines were defined to create accurate point objects. The software automatically recognizes 15 salient facial landmarks: Pronasale (Prn); Nasion point (Nsn); Subnasale (Sbn); Chin point (ChiP); Left external canthus (LExtCan); Left internal canthus (LIntCan); Right internal canthus (RIntCan); Right external canthus (RExtCan); Left Alare (LAla); Right Alare (RAla); Right lip corner (RLipCn); Left lip corner (LLipCn); Stomion (Stm); Upper lip point (ULipP); and Lower lip point (LLipP) (Figure 1). Geomagic studio analysis tool was used to measure the distance between two landmarks (Figure 2), namely RAla-RLipCn, RLipCn-ULipP, RLipCn-Sbn, LAla-LLipP, ULipP-LLipP, LLipCn-Sbn, RLipCn-Prn, RLipCn-LLipP, RLipCn-Sbn, RLipCn-Chip, Chip-LAla, RLipCn-Nsn, LLipCn-Nsn, ULipP-RIntCan, ULipP-RExtCan, and RLipCn-Stm. Straight-line (linear) and curve distances were measured separately.
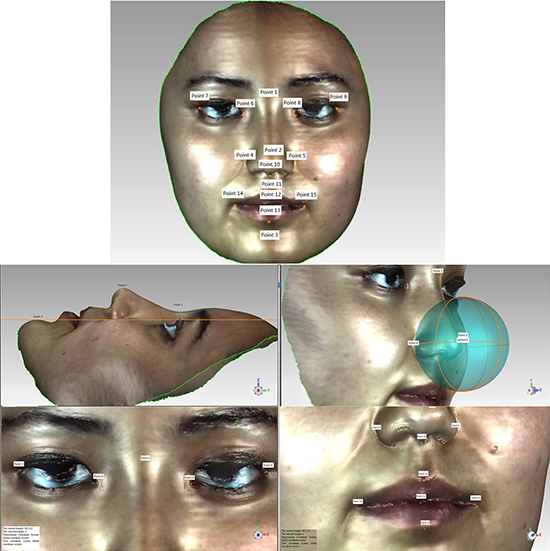
Figure 1: Facial landmarks extracted from 3D imaging. The 15 salient facial landmarks defined in 3D images were: 1, Nasion point (Nsn); 2, Pronasale (Prn); 3, Chin point (ChiP); 4, Left Alare (LAla); 5, Right Alare (RAla); 6, Left internal canthus (LIntCan); 7, Left external canthus (LExtCan); 8, Right internal canthus (RIntCan); 9, Right external canthus (RExtCan); 10, Subnasale (Sbn); 11, Upper lip point (ULipP) 12, Stomion (Stm); 13, Lower lip point (LLipP); 14, Left lip corner (LLipCn); 15, Right lip corner (RLipCn).
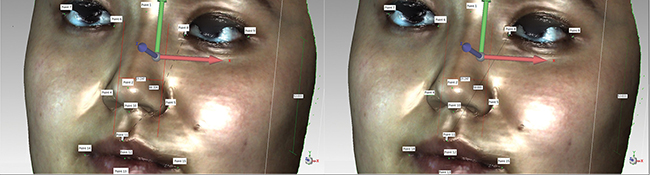
Figure 2: Distance measurements of 3D facial image landmarks.
Statistical analysis
Hardy-Weinberg equilibrium tests were performed using the exact test to assess the genetic variability of the population. p = 0.05 was set as the significance level threshold for the candidate gene strategy; p > 0.05 indicated that the population surveyed reached genetic balance.
All the data were analyzed by SPSS19.0 statistical software. Measurement data is represented by  ± SD. Comparison between groups was performed using analysis of variance, and two-pair comparisons were carried out using the LSD t test method. A p-value < 0.05 was considered statistically significant.
ACKNOWLEDGMENTS AND FUNDING
This work was supported by Autonomous Region Science and Technology Projects (No. 201591191). We are grateful to all the individuals in the study who made this work possible.
CONFLICTS OF INTEREST
The authors report no conflicts of interest.
REFERENCES
1. Liu F, van der Lijn F, Schurmann C, Zhu G, Chakravarty MM, Hysi PG, Wollstein A, Lao O, de Bruijne M, Ikram MA, van der Lugt A, Rivadeneira F, Uitterlinden AG, et al. A genome-wide association study identifies five loci influencing facial morphology in Europeans. PLoS Genet. 2012; 8:e1002932.
2. Abzhanov A, Kuo WP, Hartmann C, Grant BR, Grant PR, Tabin CJ. The calmodulin pathway and evolution of elongated beak morphology in Darwin’s finches. Nature. 2006; 442:9145–9152.
3. Hubbe M, Hanihara T, Harvati K. Climate signatures in the morphological differentiation of worldwide modern human populations. Anat Rec (Hoboken). 2009; 292:1720–1733.
4. Harvati K, Weaver TD. Human cranial anatomy and the differential preservation of population history and climate signatures. Anat Rec A Discov Mol Cell Evol Biol. 2006; 288:1225–1233.
5. Boehringer S, Van dLF, Liu F, Günther M, Sinigerova S, Nowak S, Ludwig KU, Herberz R, Klein S, Hofman A. Genetic determination of human facial morphology: links between cleft-lips and normal variation. Eur J Hum Genet. 2011; 19:1192–1197.
6. Buchtová M, Kuo WP, Nimmagadda S, Benson SL, Geetha-Loganathan P, Logan C, Au-Yeung T, Chiang E, Fu K, Richman JM. Whole genome microarray analysis of chicken embryo facial prominences. Dev Dyn. 2010; 239:574–591.
7. Cai J, Ash D, Kotch LE, Jabs EW, Attie-Bitach T, Auge J, Mattei G, Etchevers H, Vekemans M, Korshunova Y. Gene expression in pharyngeal arch 1 during human embryonic development. Hum Mol Genet. 2005; 14:903–912.
8. Chai Y, Jr MR. Recent advances in craniofacial morphogenesis. Dev Dyn. 2006; 235:2353–2375.
9. Feng W, Simoes-De-Souza F, Finger TE, Restrepo D, Williams T. Disorganized olfactory bulb lamination in mice deficient for transcription factor AP-2epsilon. Mol Cell Neurosci. 2009; 42:161–171.
10. Peng S, Tan J, Hu S, Zhou H, Guo J, Jin L, Tang K. Detecting genetic association of common human facial morphological variation using high density 3D image registration. PLoS Comput Biol. 2013; 9:e1003375.
11. Ermakov S, Rosenbaum MG, Malkin I, Livshits G. Family-based study of association between ENPP1 genetic variants and craniofacial morphology. Ann Hum Biol. 2010; 37:754–766.
12. Guo J, Tan J, Yang Y, Zhou H, Hu S, Hashan A, Bahaxar N, Xu S, Weaver TD, Jin L, Stoneking M, Tang K. Variation and signatures of selection on the human face. J Hum Evol. 2014; 75:143–152.
13. Chern CJ, Macdonald AB, Morris AJ. Purification and properties of a nucleoside triphosphate pyrophosphohydrolase from red cells of the rabbit. J Biol Chem. 1969; 244:5489–5495.
14. Johnson K, Moffa A, Chen Y, Pritzker K, Goding J, Terkeltaub R. Matrix vesicle plasma cell membrane glycoprotein-1 regulates mineralization by murine osteoblastic MC3T3 cells. J Bone Miner Res. 1999; 14:883–892.
15. Gómezvaldés JA, Hünemeier T, Contini V, Acuñaalonzo V, Macin G, Ballesterosromero M, Corral P, Ruizlinares A, Sánchezmejorada G, Canizalesquinteros S. Fibroblast growth factor receptor 1 (FGFR1) variants and craniofacial variation in Amerindians and related populations. Am J Hum Biol. 2013; 25:12–19.
16. Bayram S, Basciftci FA, Kurar E. Relationship between P561T and C422F polymorphisms in growth hormone receptor gene and mandibular prognathism. Angle Orthod. 2014; 84:803–809.
17. Zhou J, Lu Y, Gao XH, Chen YC, Lu JJ, Bai YX, Shen Y, Wang BK. The Growth Hormone Receptor Gene is Associated with Mandibular Height in a Chinese Population. J Dent Res. 2005; 84:1052–1056.
18. Sousa MV, Vasconcelos EC, Janson G, Garib D, Pinzan A. Accuracy and reproducibility of 3-dimensional digital model measurements. Am J Orthod Dentofacial Orthop. 2012; 142:269–273.
19. Seo H, Kim SJ, Cordier F, Choi J, Hong K. Estimating dynamic skin tension lines in vivo using 3D scans. Cad Computer Aided Design. 2013; 45:551–555.