
INTRODUCTION
Breast cancer (BC) metastasis is known to account for most cancer-associated deaths in women [1]. Although significant research has been conducted in the area of cancer metastasis, to date there is no available marker to predict metastasis nor is there any way to inhibit it once it has occurred. Evidently, there are still open questions regarding the exact mechanism involved, while it has been established that the extracellular matrix (ECM) and ECM-related adhesion proteins are key molecules in the process of metastasis. Indeed cell-ECM adhesion proteins can be greatly disrupted in cancer allowing tumor cells to detach from the original tumor mass [2–5], adhere to the endothelium and adjacent tissues, and invade through them [6]. Moreover, connection of cell-ECM adhesions to the actin cytoskeleton enables cells to respond to external stimuli by modulating their shape or by activating proper migration patterns.
Ras Suppressor-1 (RSU-1) was recently shown to localize to cell-ECM adhesion sites through its interaction with Particularly Interesting New Cysteine-Histidine rich protein (PINCH-1) [7], which in turn binds to Integrin-Linked Kinase (ILK), and alpha-parvin (PARVA) forming a stable ternary protein complex that promotes cell survival [8–10]. Although, RSU-1 was originally identified as suppressor of Ras-dependent oncogenic transformation [11], little is known regarding its expression and role in cancer. From the studies currently published on RSU-1 and cancer, there is consensus on the fact that RSU-1 has anti-tumorigenic effects suppressing cancer cell growth [11–14]. Regarding its expression in various precancerous or cancer tissues though, results are limited and sometimes contradictory. A study in familial adenomatous polyposis involving a small number of samples showed a reduction in RSU-1 protein expression in polyposis samples compared to normal colonic mucosa [15] while another study showed RSU-1 mRNA expression to be dramatically up-regulated in metastatic colon cancer samples compared to healthy controls as well as compared to primary colon cancer samples [16]. Furthermore, a somatic copy number variation (CNV) analysis in hepatocellular carcinoma samples showed that the Rsu-1 gene exhibited a high frequency of CNVs with 7 deletions and 3 amplifications [17] indicating that Rsu-1 is frequently deleted in human liver cancer. Moreover, it was recently shown that RSU-1 expression is significantly elevated both at the mRNA and protein level in BC samples compared to respective adjacent normal tissue with the increase being more obvious in metastatic samples compared to non-metastatic [18]. Consistent with this finding, RSU-1 was demonstrated to be significantly upregulated in the aggressive MDA-MB-231 breast cancer cells compared to less aggressive MCF-7 cells [18], as well as in the aggressive HepG2 hepatocellular carcinoma cells compared to the less invasive PLC/PRF/5 (Alexander) hepatoma cells [19]. Interestingly, an alternatively-spliced variant of rsu-1 was identified in 30% of high grade gliomas and 2/3 of oligodendrogliomas but not in other brain, bladder, colon tumors of normal tissue [20] while rare RSU-1 deletion were also identified in three cancer types from the Cancer Genome Atlas [21]. Hence, RSU-1 seems to have the potential of being both promising and clinically relevant novel marker and therapeutic target of cancer cell metastasis. Apart from the involvement of cell-ECM adhesion proteins, it has also been shown that mechanical cues can promote cancer metastasis [22, 23]. In fact, cancer tissues often contain a larger amount of ECM proteins than normal tissues and thus, are typically stiffer, expressed with a larger value of Young's modulus. Tumor stiffening is the only mechanical aspect that patients and clinicians can feel as in many cases tumors become stiffer compared to the surrounding tissue. Because of their increased ECM stiffness, cancer tissues restrict more the movement of cancer cells, exerting larger mechanical compressive forces on them. Thus, mechanical compression can, not only reduce cancer cell proliferation and induce apoptosis but it can also increase the invasive and metastatic potential of cancer cells [6, 22–30].
In the current study, we set out to investigate the role of cell-ECM adhesion proteins in relation to matrix stiffness with regard to cell invasion. Traditional two-dimensional (2D) monolayer cultures could not be used, as they cannot take into account the ECM stiffness of the tumor microenvironment [31]. Thus, in order to better approximate the real tumor setting in vitro, we used two approaches: a) we cultured BC cells in three dimensional (3D) collagen I gels of increasing concentration and stiffness [31] studying the expression of cell-ECM adhesion proteins including but not limited to RSU-1, and b) we generated cancer cell spheroids, embedded in 3D collagen gels of increasing stiffness and monitored their invasive capacity in the presence or absence of RSU-1.
RESULTS
Defining the 3D culture system of collagen I gels in terms of stiffness
We first set out to establish a 3D culture system that would allow cancer cells to grow in 3D and at the same time allow us to modulate the stiffness of the surrounding matrix, in an attempt to better approximate real tumor setting and the cell-ECM interactions in place. To that regard, we generated collagen I gels containing 0.5, 1.0 or 3.0 mg/ml collagen I. In order to characterize the generated gels in terms of structure and stiffness, we employed AFM, which can be used for imaging and characterization of the mechanical properties of collagen samples without destroying the fibrillar structure of collagen [32, 33]. As shown in Figure 1A, collagen gels consisted of fibers with 3D random orientations, confirming that the formed gels mimic collagen-rich tissues. Furthermore, the density of the fibers in the gels increased with collagen concentration. In order to characterize the stiffness of the gels, we performed AFM analysis under liquid conditions. Figure 1B depicts 3D structural images of collagen gels taken in PBS that were used to generate the stiffness graph in Figure 1C (normalized Young’s modulus values). As expected according to previous studies [34, 35], the stiffness measured by AFM increases with increasing collagen concentration. In particular, we measured an increase in stiffness of about 1.5 and 3.7 times (compared to the 0.5mg/ml condition), when the concentration was increased from 0.5 to 1.0 and 3.0 mg/ml, respectively.
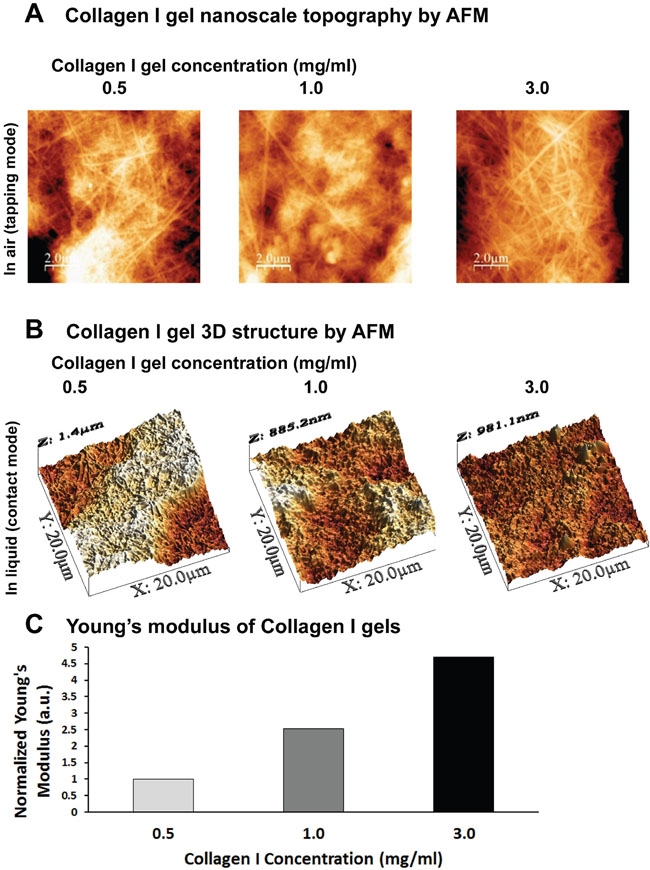
Figure 1: Defining the 3D culture system of Collagen I gels by AFM. (A) AFM Topography images of the nanosurface of collagen I gels (tapping mode in air, with Cypher ES, Asylum Research AFM system). (B-C) AFM 3D topography images in PBS and diagrammatic representation of normalized Young’s modulus of the gels (contact mode and force spectroscopy under liquid, with PicoPlus, Agilent AFM System).
BC cells grown in 3D collagen gels of increasing stiffness
Subsequently, we proceeded with cell culturing by embedding BC cells in the gels, according to previously published protocols [36, 37], allowing them to grow for 3 days. In all our experiments we used three BC cell lines of different metastatic potential; the non-invasive MCF-7 cells, the highly invasive MDA-MB-231 cells and the also highly invasive MDA-MB-231-LM2 cells, which were derived from MDA-MB-231 cells and were selected for their ability to metastasize to lung tissue in vivo [38]. As shown in Figure 2, MCF-7 (Figure 2A-2D), MDA-MB-231 (Figure 2E-2H) and MDA-MB-231-LM2 cells (Figure 2I-2L) were indeed embedded in the gels growing at different levels in all three dimensions within the 3D collagen matrix. The different levels of focus, seen in the pictures, involving cells grown in the gels confirm our observations (Figure 2B-2D, Figure 2F-2H, Figure 2J-2L).
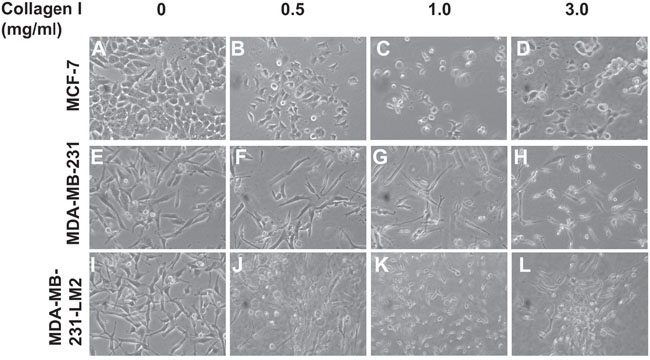
Figure 2: BC cells grown in 3D collagen gels in conditions of increasing matrix stiffness. (A-D) Morphology of MCF-7 cells grown in 2D culture (A), or embedded in Collagen gels of 0.5mg/ml (B), 1.0 mg/ml (C) and 3.0 mg/ml (D). (E-H) Morphology of MDA-MB-231 cells grown in 2D culture (E), or embedded in Collagen gels of 0.5 mg/ml (F), 1.0 mg/ml (G) and 3.0 mg/ml (H). (I-L) Morphology of MDA-MB-231-LM2 cells grown in 2D culture (I), or embedded in Collagen gels of 0.5mg/ml (J), 1.0 mg/ml (K) and 3.0 mg/ml (L). Pictures were taken using a Nicon Eclipse TS100 optical microscope equipped with digital camera.
BC cell spheroids’ invasion within collagen gels is increased at medium stiffness and decreased at high stiffness conditions
We then sought to find out how the metastatic potential of BC cells is affected by ECM stiffness. To better control invasion routes of cells and better recapitulate a breast tumor in vitro we generated BC cell spheroids using the hanging drop method [30, 39, 40], and implanted them in culture wells containing 0.5, 1.0 or 3.0 mg/ml collagen gels, considering the time of implantation as time zero. Pictures of the spheroids were taken at time zero, as well as at 2, 5 and 18h, and the spheroid size (mean of major and minor axis length) was compared to the initial size. As shown in Figure 3, in all three cell lines tested, BC cells invaded through 0.5 and 1.0 mg/ml collagen and the size of the spheroid was increased over time, although this was not the case for spheroids implanted in the 3.0 mg/ml collagen gel where the spheroids’ size showed significant decrease (Figure 3D-3F). This indicates that the relationship between cells’ invasive capacity and ECM stiffness is biphasic, with an optimum cell invasion occurring at intermediate stiffness conditions (i.e. 1.0 mg/ml collagen). It is worth noting that MCF-7 cell spheroids needed at least 18h to invade through surrounding matrix, while MDA-MB-231 spheroids reached double the size of MCF-7 spheroids in the same time period (compare Figure 3D and 3E). As expected, the highly metastatic MDA-MB-231-LM2 cell spheroids reached similar size at only 5h (Figure 3F).
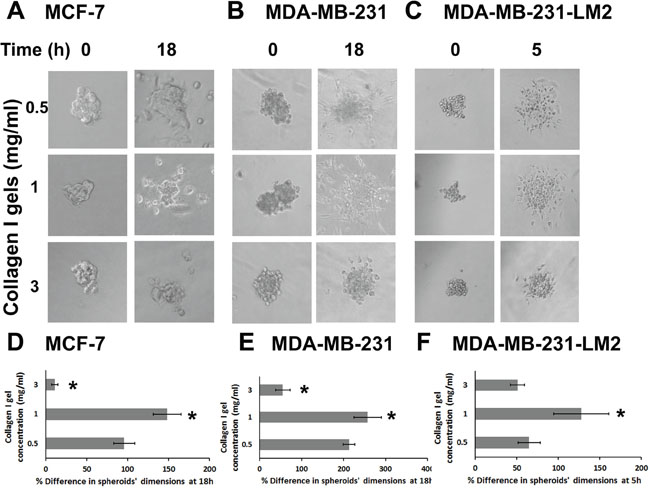
Figure 3: Cancer cell spheroids invasion through collagen gels is increased at medium stiffness and decreased at high stiffness conditions. (A-C) MCF-7, MDA-MB-231 and MDA-MB-231-LM2 cell spheroids embedded in collagen gels of 0.5, 1.0 or 3.0 mg/ml at time zero and at 18h, 18h and 5h post implantation, respectively. (D-F) Percentage (%) change in MCF-7, MDA-MB-231 and MDA-MB-231-LM2 spheroids’ dimensions (average of major and minor axis) within 18h, 18h and 5h post implantation, respectively. At least 8 spheroids were analyzed per condition and 3 independent experiments were performed. Asterisks indicate statistically significant changes (p value < 0.05) compared to the condition of 0.5 mg/ml.
Effect of 3D culture on cell-ECM adhesion gene expression
Following, we set out to investigate how proteins involved in cell-ECM interactions at cell-ECM adhesion sites are affected by 3D culture, as these are the first to receive the mechanical signals from the ECM and transmit them further to the interior of the cell enabling it to survive, reorganize its cytoskeleton and regulate its homeostasis. Hence, we tested the expression of cell-ECM adhesion components ILK, PARVA, migfilin, Vasodilator Stimulated Phosphoprotein (VASP), PINCH-1, and RSU-1. As shown in Supplementary Figure 1, ILK, PARVA, VASP and Migfilin mRNA and protein expression was not following a consistent trend in relation to increased collagen stiffness among the three cell lines tested. PINCH-1 protein expression also did not follow a specific pattern, although PINCH-1 mRNA expression was significantly reduced in increasing stiffness conditions in MCF-7 and MDA-MB-231 cells, but not in MDA-MB-231-LM2 cells (Supplementary Figure 2).
Interestingly however, RSU-1 was the only one, among cell-ECM adhesion components tested, to show a consistent differential response in expression in relation to increased collagen stiffness in all three BC cell lines. More specifically, RSU-1 expression was significantly elevated in cells grown in 1.0 or 3.0 mg/ml collagen gels, compared to cells grown in 0.5 mg/ml collagen gels, both at the mRNA (Figure 4A) and protein level (Figure 4B and 4C), indicating a potential connection between RSU-1 and ECM-originating mechanical cues.
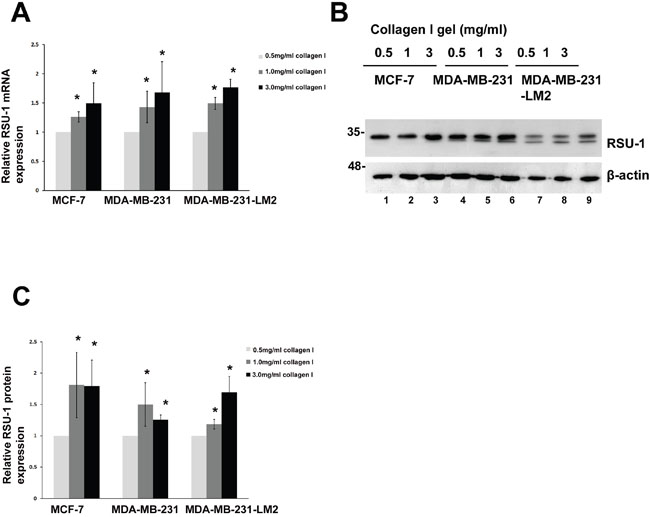
Figure 4: RSU-1 is upregulated in increased stiffness conditions in MCF-7, MDA-MB-231 and MDA-MB-231-LM2 cells. (A) Relative RSU-1 mRNA expression in MCF-7, MDA-MB-231 and MDA-MB-231-LM2 cells cultured in collagen gels of 0.5, 1.0 and 3.0 mg/ml. Seven (7) independent Real Time PCR experiments were performed, and data were analyzed using the ΔΔCt method and having 0.5mg/ml collagen gel as a calibrator. (B) Representative western blot showing RSU-1 protein expression in all stiffness conditions in all three BC cell lines. B-actin was utilized as loading control. (C) Graph representing quantification of RSU-1 protein expression normalized to the β-actin loading control using NIH Image J software. The mean intensity of RSU-1 protein bands from 7 different immunoblots was used for the quantification. Asterisks indicate statistically significant changes (p-value<0.05).
RSU-1 is upregulated in more aggressive BC cell lines
Taking into consideration the fact that RSU-1 is also linked to cancer as it was originally identified as suppressor of Ras-induced transformation [11] and it was recently associated with metastasis in BC patients [18], we wondered what would be its involvement in BC progression and metastasis and how it is affected by matrix stiffness. Thus, we first tested RSU-1 expression in 2D culture and found that RSU-1 is upregulated in the highly invasive MDA-MB-231 and MDA-MB-231-LM2 cells compared to the less aggressive MCF-7 cells both at the protein (Figure 5A and 5B) and mRNA (Figure 5C) level.
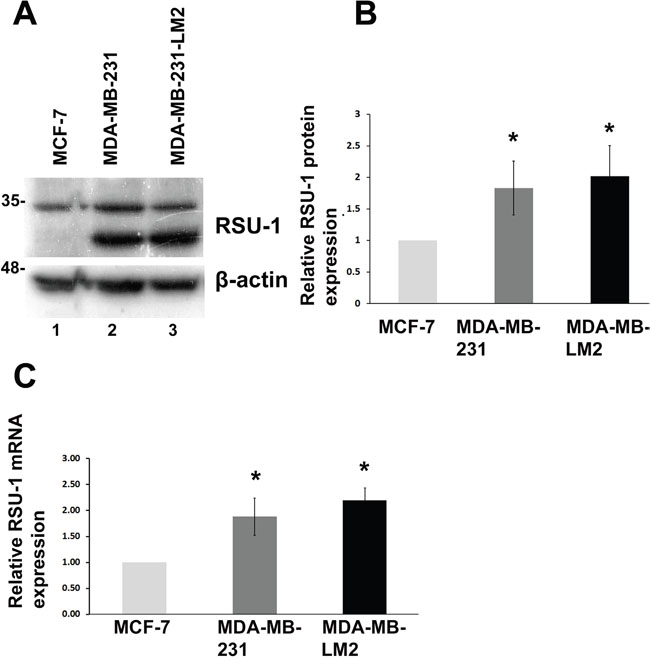
Figure 5: RSU-1 mRNA and protein expression is elevated in more aggressive BC cells compared to less aggressive. (A) Representative western blot showing RSU-1 protein expression in MCF-7, MDA-MB-231 and MDA-MB-231-LM2 cells. B-actin was utilized as loading control. (B) Graph representing quantification of RSU-1 protein expression normalized to the β-actin loading control using NIH Image J software. The mean intensity of RSU-1 protein bands from 6 different immunoblots was used for the quantification. (C) Relative RSU-1 mRNA expression in MCF-7, MDA-MB-231 and MDA-MB-231-LM2 cells cultured in traditional 2D culture conditions. Four independent Real Time PCR experiments were performed, and data were analyzed using the ΔΔCt method and having MCF-7 cell sample as calibrator. Asterisks indicate statistically significant changes (p-value<0.05).
RSU-1 is efficiently silenced in all three BC cell lines in 2D culture and its silencing leads to reduced UPA, and MMP-13 mRNA expression
In order to decipher the role of RSU-1 in BC cells in relation to metastasis, we first performed siRNA-mediated gene silencing in all three BC cell lines cultured in 2D. RSU-1 was significantly and effectively silenced both at the protein (Figure 6A and 6C) and mRNA (Figure 6B) level compared to cells being transfected with non-specific control (NSC) siRNA. A recent study has demonstrated that RSU-1 elimination from aggressive hepatocellular carcinoma cells inhibits cell invasion [19], although the molecular mechanism involved was not provided. Thus, we wanted to test whether RSU-1 silencing affects key molecules involved in matrix degradation. To that regard and following RSU-1 silencing, we tested the mRNA expression of Urokinase Plasminogen Activator (UPA), a known protease involved in cancer progression and metastasis, as well as that of metalloproteinase-13 (MMP-13) known to be involved in collagen I degradation. We found that both UPA (Figure 6D), and MMP-13 (Figure 6E) were significantly downregulated following RSU-1 silencing compared to NSC-treatment in all three BC cell lines, indicating a strong inhibitory effect of RSU-1 silencing on BC cell invasive potential.
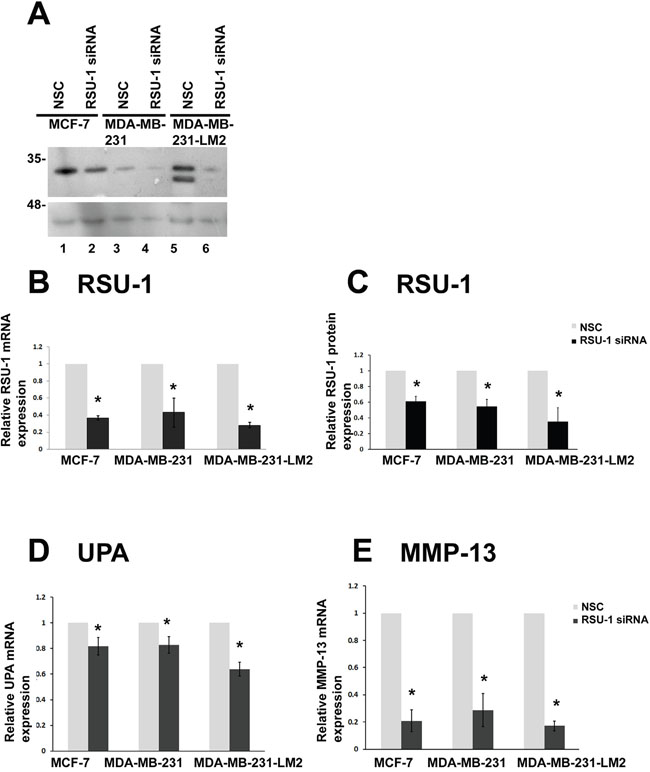
Figure 6: RSU-1 is effectively silenced in 2D conditions and its silencing leads to downregulation of UPA, and MMP-13 in all three BC cell lines. (A) Representative western blot showing RSU-1 protein expression in all MCF-7, MDA-MB-231 and MDA-MB-231-LM2 cells treated with NSC or RSU-1 siRNA for at least 48h. B-actin was utilized as loading control. (B) Relative mRNA expression of RSU-1 in MCF-7, MDA-MB-231 and MDA-MB-231-LM2 cells cultured in traditional 2D culture conditions and treated with NSC or RSU-1 siRNA for at least 48h. Seven independent Real Time PCR experiments were performed, and data were analyzed using the ΔΔCt method and having NSC-treated cells as calibrators. (C) Graph representing quantification of RSU-1 protein expression normalized to the β-actin loading control using NIH Image J software. The mean intensity of RSU-1 protein bands from 4 different immunoblots was used for the quantification. (D-E) Relative mRNA expression of UPA (D), and MMP-13 (E) in MCF-7, MDA-MB-231 and MDA-MB-231-LM2 cells cultured in traditional 2D culture conditions and treated with NSC or RSU-1 siRNA for at least 48h. At least 3 independent Real Time PCR experiments were performed, and data were analyzed using the ΔΔCt method and having NSC-treated cells as calibrators. Asterisks indicate statistically significant changes (p-value<0.05).
RSU-1 is efficiently silenced in all three BC cell lines in 3D collagen gels of increasing stiffness and its elimination leads to reduced UPA, and MMP-13 mRNA expression
Next, we performed siRNA-mediated RSU-1 silencing in all three BC cell lines prior to embedding them in 3D collagen gels, where they were allowed to grow for two additional days. Morphology of the cells grown in 3D conditions of increased stiffness following RSU-1 siRNA was not significantly altered by RSU-1 elimination (Supplementary Figure 3). RSU-1 was effectively silenced in all three cell lines treated with RSU-1 siRNA, and in all three collagen stiffness conditions compared to the respective NSC-treated cells both at the protein (Figure 7A-7C, 7E) and mRNA level (Figure 7D).
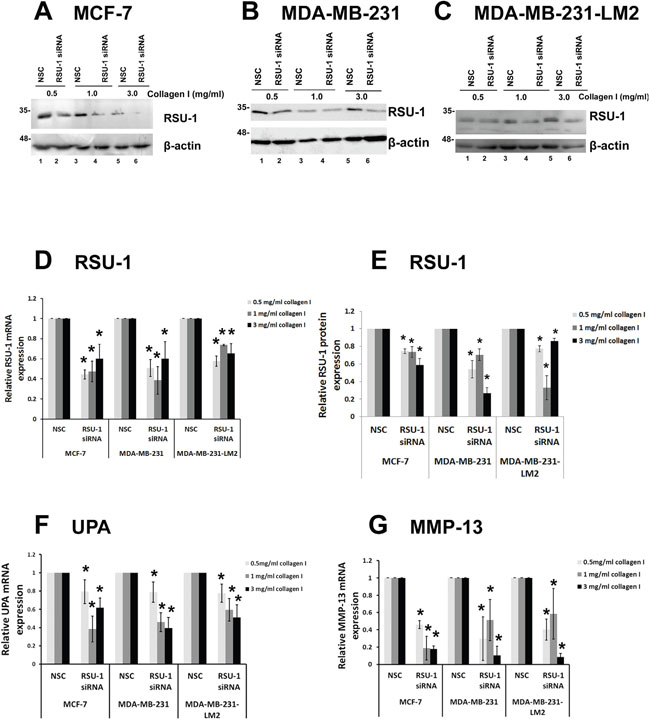
Figure 7: RSU-1 is effectively silenced in 3D conditions and its elimination downregulates UPA, and MMP-13 in all three BC cell lines. (A-C) Representative western blots showing RSU-1 protein expression in MCF-7 (A), MDA-MB-231 (B) and MDA-MB-231-LM2 (C) cells treated with NSC or RSU-1 siRNA for 72h being also embedded in collagen matrix of 0.5, 1.0 or 3.0 mg/ml. B-actin was utilized as loading control. (D) Relative mRNA expression of RSU-1 (D), in MCF-7, MDA-MB-231 and MDA-MB-231-LM2 cells treated with NSC or RSU-1 siRNA for 72h and being also embedded in collagen matrix of 0.5, 1.0 or 3.0 mg/ml. (E) Graph representing quantification of RSU-1 protein expression normalized to the β-actin loading control using NIH Image J software. The mean intensity of RSU-1 protein bands from three different immunoblots per cell line were used for the quantification. Asterisks indicate statistically significant changes (p-value<0.05). (F-G) UPA (F) and MMP-13 (G) relative mRNA expression in MCF-7, MDA-MB-231 and MDA-MB-231-LM2 cells treated with NSC or RSU-1 siRNA for 72h and being also embedded in collagen matrix of 0.5, 1.0 or 3.0 mg/ml. At least three independent Real Time PCR experiments were performed, and data were analyzed using the ΔΔCt method and having NSC-treated cells as calibrators in each stiffness condition. Asterisks indicate statistically significant changes (p-value <0.05).
To test whether RSU-1 silencing has the same effect in 3D collagen cultures as it has in 2D, we checked UPA and MMP-13 mRNA expression in all three cell lines and all three stiffness conditions after RSU-1 silencing. In accordance with findings from the 2D culture experiments (Figure 6), RSU-1 elimination also significantly inhibited the mRNA expression of UPA (Figure 7F) and MMP-13 (Figure 7G).
RSU-1 silencing in cancer cell spheroids implanted in 3D collagen gels leads to reduced cell invasion in a stiffness-independent manner
Having already shown that RSU-1 depletion leads to reduction in the mRNA expression of matrix degrading proteases UPA, and MMP-13 both in 2D and 3D cell culture conditions, we proceeded further to test the actual effect on invasiveness of BC cell spheroids. Thus, MCF-7, MDA-MB-231 and MDA-MB-231-LM2 cells were subjected to RSU-1 siRNA transfection and one day later were used to generate cancer cell spheroids that were subsequently implanted in collagen gels of increasing stiffness 24h later (48h post-siRNA transfection). Pictures were taken at the time of implantation (time zero) and at the optimum time for each cell line which was determined following pilot experiments and was 18h for MCF-7 cells, 6h for MDA-MB-231 cells and 5h for MDA-MB-231-LM2 cells. RSU-1 silencing in all three BC cell lines resulted in significant inhibition of BC cell spheroid invasion in 0.5, and 1.0 mg/ml collagen matrices but had no effect on spheroids embedded in 3.0 mg/ml collagen gels (Figure 8). In this concentration invasiveness is already low, even without silencing (Figure 3). Importantly, the effect of inhibition was more dramatic in the more aggressive and highly metastatic MDA-MB-231-LM2 cells (Figure 8C and 8F). Thus, our findings indicate that RSU-1 depletion inhibits BC cell invasion without any apparent dependence on matrix stiffness.
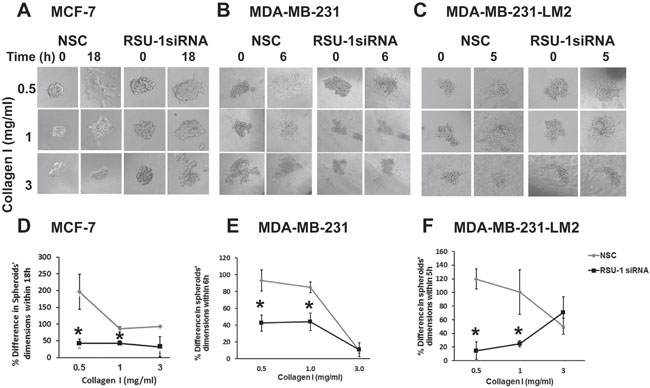
Figure 8: RSU-1 silencing in BC cell spheroids implanted in 3D collagen gels leads to reduced cell invasion in a stiffness-independent manner. (A-C) MCF-7, MDA-MB-231 and MDA-MB-231-LM2 cells treated with NSC or RSU-1 siRNA were used to generate BC cell spheroids that were subsequently embedded in collagen gels of 0.5, 1.0 or 3.0 mg/ml at time zero and left to grow for 18h, 6h and 5h post implantation, respectively. (D-F) Percentage (%) change in MCF-7, MDA-MB-231 and MDA-MB-231-LM2 spheroids’ dimensions (average of major and minor axis) within the specified times post implantation. At least 8 spheroids were analyzed per condition and 3 independent experiments were performed. Asterisks indicate statistically significant changes (p-value < 0.05).
High RSU-1 mRNA expression is associated with poor prognosis for distant metastasis-free survival (DMFS) and remission–free survival (RFS) in BC patients
To further validate our findings, we utilized the Kaplan Meier plotter, an in silico online tool which performs meta-analysis of Affymetrix microarray gene expression data. Meta-analysis involved multiple studies from BC patients [41, 42] to predict survival depending on the level of RSU-1 expression. We first analyzed the data using all the available information on 5,143 BC patients and found that high RSU-1 mRNA expression had no significant effect on overall survival (Figure 9A), but correlated with poor prognosis for distant metastasis-free survival (DMFS) (Figure 9B) as well as remission-free survival (RFS) (Figure 9C).
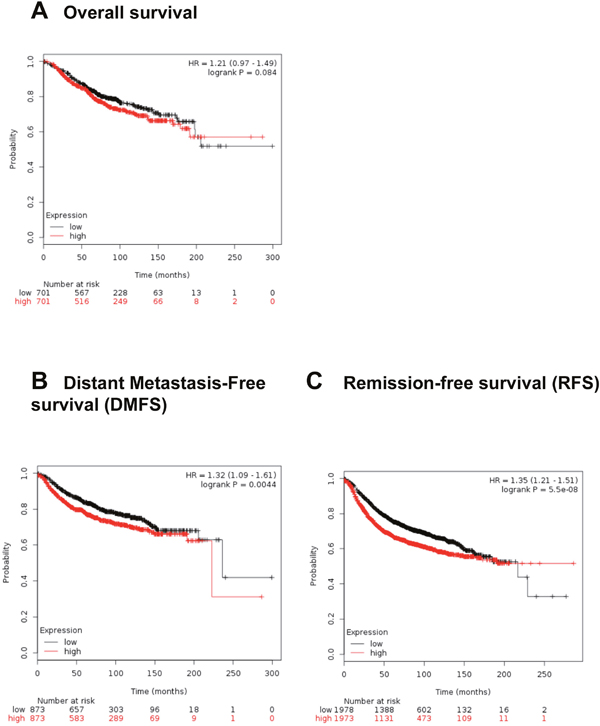
Figure 9: High RSU-1 mRNA expression is correlated with reduced distant metastasis-free survival and reduced remission –free survival in BC patients. Kaplan-Meier plotter was used to predict survival of BC patients depending on the level of RSU-1 expression. Overall survival (A), DMFS (B) and RFS (C) were estimated using the available information on a total of 5,143 BC patients in the database.
DISCUSSION
To better understand the importance of tumor stiffness and cell-ECM interactions in BC progression and metastasis, we recapitulated the actual tumor setting in vitro using three BC cell lines of different metastatic potential and two approaches; a) culture of BC cells in 3D collagen gels of increasing stiffness and b) BC cell spheroids, embedded in 3D collagen gels. Our results indicate that the relationship between cells’ invasive capacity and ECM stiffness is biphasic with an optimum invasion in the 1.0 mg/ml collagen gel and the lowest in the 3.0 mg/ml collagen gel, regardless of the aggressiveness of the cells, as it was true for all three cell lines tested (Figure 3). This is in accordance with previous studies showing that cells exhibit biphasic behavior with regard to migration, with an optimum migration velocity in matrices with intermediate-sized pores [43]. Moreover, a recent study by Acerbi et al. showed that there is an optimum range of ECM stiffness for tumor invasion, while ECM remodeling at the tumor invasive front is correlated with increased ECM stiffness [44]. Also, the fact that BC spheroid cell invasion was dramatically reduced in the stiffer matrix condition (Figure 3D-3F) suggests that a smaller pore size in the denser and stiffer 3D matrix may impede formation of cell protrusions, and hence block invasion [45].
Furthermore, we identified RSU-1 as the only one of the cell-ECM adhesion genes examined to respond to the increased stiffness conditions, as its expression was consistently elevated in cells embedded in collagen gels (Figure 4) in all three BC cell lines. In contrast, other cell-ECM adhesion proteins examined, namely ILK, PINCH-1, PARVA, VASP, and Migfilin did not exhibit a consistent pattern of expression in relation to stiffness and/or among the three cell lines (Supplementary Figure 1 and 2). It is worth mentioning however, that gene expression analysis in cells embedded in collagen gels was quite challenging especially at the protein level, and thus collagenase D treatment was selected to facilitate collagen digestion and cell harvesting. Although, it is known that collagenase digestion may interfere with sensitive signaling events such as phosphorylation [46], it did not affect more stable proteins such as cell-ECM adhesion proteins.
Further, RSU-1 was indeed shown to be upregulated in the highly metastatic MDA-MB-231 and MDA-MB-231-LM2 cells compared to the low invasiveness MCF-7 cells (Figure 5), indicating a potential role in aggressiveness. Interestingly, it is clear that RSU-1 is implicated in cell invasion, although its exact role may be cell type specific. More specifically, there are studies showing that RSU-1 promotes cell adhesion, spreading, migration [47], and invasion [19] while there is a study showing that RSU-1 inhibits cancer cell migration and invasion while its alternatively spliced truncated isoform enhances the process [48]. In the present study we show for the first time that RSU-1 silencing leads to reduced UPA, and MMP-13 expression (Figures 6 and 7), both of which are key matrix degradation proteases implicated in cell invasion, and thus metastasis. In fact, although the link between MMP activity, contractility and ECM stiffness has been demonstrated previously [49], RSU-1 has not been implicated in this process to date. Hence, since RSU-1 silencing downregulated UPA, and MMP-13, it is not surprising that RSU-1 depletion also dramatically reduced BC cell spheroid invasion through collagen gels (Figure 8) in all three BC cell lines tested. More importantly, our findings indicate that although RSU-1 is upregulated in increased stiffness conditions (Figure 4), its elimination by siRNA leads to inhibition of spheroid cell invasion regardless of matrix stiffness, suggesting a strong invasion-inhibitory capacity.
Our findings further corroborate recent work showing that RSU-1 depletion from hepatocellular carcinoma cells inhibits cell invasion [19], and additionally demonstrate that this holds true for BC cells as well. It should be noted however, that as RSU-1 has been shown to suppress growth of hepatocellular carcinoma cells [14] and induce apoptosis in breast cancer cells [18], it would be expected that its silencing would promote proliferation and tumor growth and thus perhaps contribute to increased cell migration and invasion. Nevertheless, the fact that RSU-1 depletion leads to such a significant decrease in cancer cell spheroid invasion regardless of collagen concentration or aggressiveness of the BC cell line (Figure 8) indicates that the effect of RSU-1 on invasion is a stronger determinant of the cancer cell phenotype.
Last but not least, analysis of the Kaplan Meier survival plots using the online Kaplan Meier plotter tool corroborated our findings as well as previous work showing RSU-1 correlation with metastasis [18] setting the foundations for its validation as a potential BC metastasis marker.
MATERIALS AND METHODS
Antibodies and reagents
Anti-ILK antibody was purchased from Cell Signaling Technology, anti-VASP antibody from Santa Cruz Biotechnology, and anti-β-actin antibody from Sigma-Aldrich. Anti-RSU-1 rabbit polyclonal antibody was kindly provided by Dr. Mary Lou Cutler, Professor at the Uniformed Services University of the Health Sciences, Bethesda USA. Anti-migfilin and anti-PARVA antibodies were a kind gift of Dr. Chuanyue Wu, Professor at the University of Pittsburgh Medical School, Pittsburgh, USA. Collagen I high concentration solution was purchased from Corning, while collagenase D and human insulin solution were obtained from Sigma-Aldrich.
BC cell lines
BC cell lines MCF-7, and MDA-MB-231 were purchased from ATCC, while MDA-MB-231-LM2 cells were kindly provided by Dr. Joan Massague, Memorial Sloan Kettering Cancer Center [50]. All cells were cultured in Dulbecco's Modified Eagle Medium supplemented with 10% Fetal Bovine Serum, 1% Glutamine and 1% Penicillin/Streptomycin, and incubated in a CO2-incubator at 37°C. All cell culture reagents were purchased from Invitrogen.
Culture of cells in 3D collagen I gels
To increase the stiffness of 3D collagen gels, we increased their concentration [34, 35]. We utilized the high concentration collagen I solution (Corning 354249) and adjusted the pH using a modification of previously published protocols [37]. More specifically, we added the desired amount of collagen I so as to get a final collagen concentration of 0.5, 1.0 or 3.0 mg/ml, in a solution containing 10% 10x Minimal Essential Medium, 1% human insulin solution (Sigma-Aldrich), and distilled water. The pH was adjusted to 7.4 by adding 1N NaOH. Cancer cells were added to the collagen solution before it solidified at a concentration of 2.5 x 10⁵ cells/ml [37] and normal complete culture medium was added on top of the collagen gel containing cells 4h after its solidification. Cells were cultured in 3D collagen gels of 0.5, 1.0 or 3.0 mg/ml for 3 days and were then subjected to gene expression analysis at the mRNA and protein level as specified. In experiments involving RSU-1 silencing, siRNA transfection was performed in traditional 2D culture 1 day prior to embedding cells in the collagen gels. Cells were left to grow in the gels for two more days before being harvested and analyzed for gene expression.
siRNA transfection
All BC cells were transfected with 100 nM non-specific control siRNA or siRNA against RSU-1 using the HiPerfect reagent (Qiagen). The siRNA used for silencing was purchased from Santa Cruz Biotechnology (sc-90735) whereas the Control siRNA-A (sc-37007) was used as Non Specific Control (NSC) siRNA. Cells were harvested 48h post-transfection and silencing efficiency was verified by western blot and real time PCR as specified in each experiment.
RNA isolation and real time PCR
Total RNA was extracted from BC cells using Trizol (Invitrogen), purified using RNeasy mini kit (Qiagen) and transcribed to cDNA using Superscript Reverse Transcriptase (Invitrogen). Quantification of gene expression was performed by real-time PCR using CFX96 Real Time PCR (BioRad). B-actin was used as a housekeeping gene. Reactions were done in triplicate and at least 3 independent experiments were performed. All primers used are shown in Supplementary Table 1. Quantification of relative gene expression was performed using the ΔΔCt method. Cells grown in 0.5mg/ml collagen gels and cells transfected with NSC siRNA were used as calibrators, as specified in each experiment.
Protein extraction and western blot analysis
For protein expression analysis, cells embedded in collagen gels were harvested by scraping and treated with 1mg/ml collagenase D for 30min at 37°C. Cell suspensions were then centrifuged at 300g for 5min to remove collagen and cell pellets were kept for gene expression analysis. Total cell lysates were obtained from cell pellets obtained from 2D culture or collagenase D treatment using 1% sodium dodecyl sulfate in RIPA buffer (20mMTris/Cl pH7.5, 150 mM NaCl, 0.5% NP-40, 1% TX-100, 0.25% sodium deoxycholated, 0.6-2μg/ml aprotinin, 10μM leupeptin, 1μM pepstatin). Protein concentrations in the samples were determined by the BCA protein assay kit (Pierce). Cell lysates were run on a 10-12% acrylamide gel and transferred to a PVDF membrane (Millipore) using the BioRad Semi-dry transfer system (BioRad). Membrane was blocked in 5% non-fat milk in TBST buffer for 1h and was then incubated with appropriate antibodies overnight in 5% milk. Standard western blot procedure steps were followed thereafter using chemiluminescent substrate from Pierce and Kodak Biomax light films. Films were scanned using an HP Scanjet G4010 scanner and images were analyzed using Adobe Photoshop software. Specifically color was discarded and the images were converted to greyscale. No other image manipulation was performed.
Quantification of protein expression from western blots
RSU-1 (Figure 4C, 5B, 6C and 7E) and PINCH-1 protein expression (Supplementary Figure 2B) were quantified compared to the β-actin loading control using the National Institute of Health Image J software. The mean intensity of respective protein bands from several different immunoblots was used for the quantification, as specified in each figure legend. A p value of 0.05 was considered as statistically significant.
Cancer cell spheroids formation and spheroid invasion assay
BC cell spheroids were formed using the “hanging drop” technique, as described previously [39, 40, 51]. Briefly, cells were trypsinized, counted and put in suspension at a concentration of 2.5x10⁴ cells/ml. Hanging drops containing 500 cells each were placed on the inside of the cover of a culture dish. Drops were left for at least 24h to allow for spheroid formation. Subsequently, formed spheroids were transferred into wells of a 96-well plate containing 0.5, 1.0 or 3.0 mg/ml collagen gel using a glass Pasteur pipette. Pictures were taken immediately (time zero) using a Nikon Eclipse optical microscope equipped with a digital camera and spheroids were then incubated at 37°C for 5-18h as specified in each experiment and depending on the invasive capacity of each cell type. Cell invasion in surrounding collagen was measured using the Image J software and spheroids’ size (average of the major and minor axis length) at the designated time was compared to the initial size at time zero [30]. In experiments where cells were subjected to RSU-1 siRNA-mediated silencing, siRNA transfection was performed 24h prior to formation of hanging drops and invasion was monitored up until 72h post-transfection. At least 8 spheroids were analyzed per condition and at least three independent experiments were performed.
Atomic force microscopy
Atomic Force Microscopy (AFM) was used to characterize 3D collagen gels. More specifically, for high resolution imaging of collagen gel fibers AFM images of the collagen films were obtained in air using a Cypher ES™ Environmental AFM microscope (Asylum Research). Briefly, part of the collagen solution (90μl) was flushed on 13mm circular glass cover glasses (AGL46R13, Agar Scientific) and the samples were incubated in a cell culture incubator for 30 min. Samples were then mounted on 15mm specimen AFM metal discs (AGF7003, Agar Scientific). All images were obtained at room temperature in intermittent (also named tapping) mode with AC160TS AFM probes (Olympus). The topographic AFM images are presented in a color scale which represents the Z axis. The surface images were acquired at a fixed resolution (512 × 512 data points) with scan rate between 0.5 and 1 Hz.
For AFM stiffness measurements, an Agilent-Molecular Imaging PicoPlus AFM system (now known as 5500 AFM, Keysight Technologies) was used for force mapping, in contact mode under Phosphate Buffered Saline (PBS). The collagen gel samples were prepared as described in previous section and then were mounted on AFM sample plate and a liquid cell with PBS was used. Force spectroscopy was performed with V-shaped silicon nitride probes (PNP-TR, Nanoword, provided by NanoAndMore). Contact mode images and 8x8 points of force curves were collected and analyzed by AtomicJ [52] so as to calculate the sample’s Young’s modulus using the Hertz model (for collagen a 0.3 Poisson ratio was used).
The AFM image processing was performed by using the image analysis software that accompanied the AFM, AR SPM Software (ver.14.13.134, Igor Pro 6.37) and the freeware scanning probe microscopy software WSxM 5.0 dev.2.1 [53].
Kaplan-Meier plotter analysis
Kaplan-Meier plotter, an in silico online tool, was used to predict survival of BC patients depending on the level of RSU-1 expression. The Kaplan-Meier plotter uses Affymetrix microarray gene expression data from multiple BC studies and integrates them simultaneously with clinical data including relapse free and overall survival information [41, 42]. Information on a total of 5,143 BC patients was available in the database and we searched for RSU-1 expression in all patients (release 2017, n=5143, all datasets were used for the analysis). Kaplan Meier plotter can be found at: http://kmplot.com/analysis/index.php?p=service&cancer=breast.
Statistical analysis
Comparison of means using Statgraphics software was used for the statistical analysis. T-test was performed and a p-value of <0.05 was considered as statistically significant.
Abbreviations
AFM: Atomic Force Microscopy, BC: breast cancer, CNV: copy number variation, DMSF: distant metastasis-free survival, ECM: extracellular matrix, ILK: integrin-linked kinase, MMP: metalloproteinases, NSC: non-specific control, LN: lymph node, PARVA: alpha- parvin, PBS: phosphate buffered saline, PINCH-1: Particularly Interesting New Cysteine-Histidine rich protein, RFS: remission–free survival, RSU-1: Ras suppressor-1, UPA: Urokinase plasminogen activator, VASP: Vasodilator Stimulated Phosphoprotein, 2D: two-dimensions, 3D: three-dimensions.
Author contributions
VG: designed the study, performed the experiments, analyzed the data and wrote the manuscript, AS: performed the AFM experiments and participated in manuscript editing, ML: participated in some of the experiments, and TS: participated in the study design, data analysis and manuscript editing. All authors reviewed and approved the manuscript.
ACKNOWLEDGMENTS
We thank Dr. Panagiotis Papageorgis for useful discussions and insights.
CONFLICTS OF INTEREST
All authors declare that they have no conflicts of interest.
FUNDING
This work has received funding from the European Research Council under the European Union’s Seventh Framework Programme (FP7/2007–2013)/ERC Grant Agreement No. 336839-ReEngineeringCancer.
REFERENCES
1. Giuliani J, Bonetti A. Trends in survival for patients with metastatic breast cancer: is survival improving? Tumori. 2015; 101:347-52.
2. Hynes RO. Integrins: bidirectional, allosteric signaling machines. Cell. 2002;110:673-87.
3. Hanahan D, Weinberg RA. Hallmarks of cancer: the next generation. Cell. 2011; 144:646-74.
4. Beavon IR. The E-cadherin-catenin complex in tumour metastasis: structure, function and regulation. Eur J Cancer. 2000; 36:1607-20.
5. Canel M, Serrels A, Frame MC, Brunton VG. E-cadherin-integrin crosstalk in cancer invasion and metastasis. J Cell Sci. 2013; 126:393-401.
6. Maller O, DuFort CC, Weaver VM. YAP forces fibroblasts to feel the tension. Nat Cell Biol. 2013; 15:570-2.
7. Dougherty GW, Chopp T, Qi SM, Cutler ML. The Ras suppressor Rsu-1 binds to the LIM 5 domain of the adaptor protein PINCH1 and participates in adhesion-related functions. Exp Cell Res. 2005; 306:168-79.
8. Qin J, Wu C. ILK: a pseudokinase in the center stage of cell-matrix adhesion and signaling. Curr Opin Cell Biol. 2012; 24:607-13.
9. Wu C. The PINCH-ILK-parvin complexes: assembly, functions and regulation. Biochim Biophys Acta. 2004; 1692:55-62.
10. Zhang Y, Chen K, Tu Y, Velyvis A, Yang Y, Qin J, Wu C. Assembly of the PINCH-ILK-CH-ILKBP complex precedes and is essential for localization of each component to cell-matrix adhesion sites. J Cell Sci. 2002; 115: 4777-86.
11. Cutler ML, Bassin RH, Zanoni L, Talbot N. Isolation of rsp-1, a novel cDNA capable of suppressing v-Ras transformation. Mol Cell Biol. 1992; 12:3750-6.
12. Tsuda T, Marinetti MR, Masuelli L, Cutler ML. The Ras suppressor RSU-1 localizes to 10p13 and its expression in the U251 glioblastoma cell line correlates with a decrease in growth rate and tumorigenic potential. Oncogene. 1995; 11:397-403.
13. Vasaturo F, Dougherty GW, Cutler ML. Ectopic expression of Rsu-1 results in elevation of p21CIP and inhibits anchorage-independent growth of MCF7 breast cancer cells. Breast Cancer Res Treat. 2000; 61:69-78.
14. Donthamsetty S, Bhave VS, Mars WM, Bowen WC, Orr A, Haynes MM, Wu C, Michalopoulos GK. Role of PINCH and its partner tumor suppressor Rsu-1 in regulating liver size and tumorigenesis. PLoS One. 2013; 8:e74625.
15. Patel BB, Li XM, Dixon MP, Blagoi EL, Nicolas E, Seeholzer SH, Cheng D, He YA, Coudry RA, Howard SD, Riddle DM, Cooper HC, Boman BM, et al. APC +/- alters colonic fibroblast proteome in FAP. Oncotarget. 2011; 2:197-208. doi: 10.18632/oncotarget.241.
16. Barbazan J, Alonso-Alconada L, Muinelo-Romay L, Vieito M, Abalo A, Alonso-Nocelo M, Candamio S, Gallardo E, Fernandez B, Abdulkader I, de Los Angeles Casares M, Gomez-Tato A, Lopez-Lopez R, et al. Molecular characterization of circulating tumor cells in human metastatic colorectal cancer. PLoS One. 2012; 7:e40476.
17. Nalesnik MA, Tseng G, Ding Y, Xiang GS, Zheng ZL, Yu Y, Marsh JW, Michalopoulos GK, Luo JH. Gene deletions and amplifications in human hepatocellular carcinomas: correlation with hepatocyte growth regulation. Am J Pathol. 2012; 180:1495-508.
18. Giotopoulou N, Valiakou V, Papanikolaou V, Dubos S, Athanassiou E, Tsezou A, Zacharia LC, Gkretsi V. Ras suppressor-1 promotes apoptosis in breast cancer cells by inhibiting PINCH-1 and activating p53-upregulated-modulator of apoptosis (PUMA); verification from metastatic breast cancer human samples. Clin Exp Metastasis. 2015; 32:255-65.
19. Gkretsi V, Bogdanos DP. Elimination of Ras Suppressor-1 from hepatocellular carcinoma cells hinders their in vitro metastatic properties. Anticancer Res. 2015; 35:1509-12.
20. Chunduru S, Kawami H, Gullick R, Monacci WJ, Dougherty G, Cutler ML. Identification of an alternatively spliced RNA for the Ras suppressor RSU-1 in human gliomas. J Neurooncol. 2002; 60:201-11.
21. Wu HT, Hajirasouliha I, Raphael BJ. Detecting independent and recurrent copy number aberrations using interval graphs. Bioinformatics. 2014; 30:i195-203.
22. Jain RK, Martin JD, Stylianopoulos T. The role of mechanical forces in tumor growth and therapy. Annu Rev Biomed Eng. 2014; 16:321-46.
23. Tse JM, Cheng G, Tyrrell JA, Wilcox-Adelman SA, Boucher Y, Jain RK, Munn LL. Mechanical compression drives cancer cells toward invasive phenotype. Proc Natl Acad Sci U S A. 2012; 109:911-6.
24. Demou ZN. Gene expression profiles in 3D tumor analogs indicate compressive strain differentially enhances metastatic potential. Ann Biomed Eng. 2010; 38:3509-20.
25. Stylianopoulos T, Martin JD, Chauhan VP, Jain SR, Diop-Frimpong B, Bardeesy N, Smith BL, Ferrone CR, Hornicek FJ, Boucher Y, Munn LL, Jain RK. Causes, consequences, and remedies for growth-induced solid stress in murine and human tumors. Proc Natl Acad Sci U S A. 2012; 109:15101-8.
26. Stylianopoulos T, Martin JD, Snuderl M, Mpekris F, Jain SR, Jain RK. Coevolution of solid stress and interstitial fluid pressure in tumors during progression: implications for vascular collapse. Cancer Res. 2013; 73:3833-41.
27. Cheng G, Tse J, Jain RK, Munn LL. Micro-environmental mechanical stress controls tumor spheroid size and morphology by suppressing proliferation and inducing apoptosis in cancer cells. PLoS One. 2009; 4:e4632.
28. Delarue M, Montel F, Vignjevic D, Prost J, Joanny JF, Cappello G. Compressive stress inhibits proliferation in tumor spheroids through a volume limitation. Biophys J. 2014; 107:1821-8.
29. Helmlinger G, Netti PA, Lichtenbeld HC, Melder RJ, Jain RK. Solid stress inhibits the growth of multicellular tumor spheroids. Nat Biotechnol. 1997; 15:778-83.
30. Kaufman LJ, Brangwynne CP, Kasza KE, Filippidi E, Gordon VD, Deisboeck TS, Weitz DA. Glioma expansion in collagen I matrices: analyzing collagen concentration-dependent growth and motility patterns. Biophys J. 2005; 89:635-50.
31. Weigelt B, Ghajar CM, Bissell MJ. The need for complex 3D culture models to unravel novel pathways and identify accurate biomarkers in breast cancer. Adv Drug Deliv Rev. 2014; 69-70:42-51.
32. Stylianou A, Yova D. Surface nanoscale imaging of collagen thin films by Atomic Force Microscopy. Mater Sci Eng C Mater Biol Appl. 2013; 33:2947-57.
33. Stylianou A, Yova D, Alexandratou E. Investigation of the influence of UV irradiation on collagen thin films by AFM imaging. Mater Sci Eng C Mater Biol Appl. 2014; 45:455-68.
34. Roeder BA, Kokini K, Sturgis JE, Robinson JP, Voytik-Harbin SL. Tensile mechanical properties of three-dimensional type I collagen extracellular matrices with varied microstructure. Journal of biomechanical engineering. 2002; 124:214-22.
35. Sander EA, Stylianopoulos T, Tranquillo RT, Barocas VH. Image-based biomechanics of collagen-based tissue equivalents. IEEE engineering in medicine and biology magazine. 2009; 28:10-8.
36. Keely PJ, Conklin MW, Gehler S, Ponik SM, Provenzano PP. Investigating integrin regulation and signaling events in three-dimensional systems. Methods Enzymol. 2007; 426:27-45.
37. Keely PJ, Fong AM, Zutter MM, Santoro SA. Alteration of collagen-dependent adhesion, motility, and morphogenesis by the expression of antisense alpha 2 integrin mRNA in mammary cells. J Cell Sci. 1995; 108:595-607.
38. Choi C, Helfman DM. The Ras-ERK pathway modulates cytoskeleton organization, cell motility and lung metastasis signature genes in MDA-MB-231 LM2. Oncogene. 2014; 33:3668-76.
39. Del Duca D, Werbowetski T, Del Maestro RF. Spheroid preparation from hanging drops: characterization of a model of brain tumor invasion. J Neurooncol. 2004; 67:295-303.
40. Kelm JM, Timmins NE, Brown CJ, Fussenegger M, Nielsen LK. Method for generation of homogeneous multicellular tumor spheroids applicable to a wide variety of cell types. Biotechnol Bioeng. 2003; 83:173-80.
41. Gyorffy B, Lanczky A, Eklund AC, Denkert C, Budczies J, Li Q, Szallasi Z. An online survival analysis tool to rapidly assess the effect of 22,277 genes on breast cancer prognosis using microarray data of 1,809 patients. Breast Cancer Res Treat. 2010; 123:725-31.
42. Szász AM, Lánczky A, Nagy Á, Förster S, Hark K, Green JE, Boussioutas A, Busuttil R, Szabó A, Győrffy B. Cross-validation of survival associated biomarkers in gastric cancer using transcriptomic data of 1,065 patients. Oncotarget. 2016; 7:49322-49333. doi: 10.18632/oncotarget.10337.
43. Charras G, Sahai E. Physical influences of the extracellular environment on cell migration. Nat Rev Mol Cell Biol. 2014; 15:813-24.
44. Acerbi I, Cassereau L, Dean I, Shi Q, Au A, Park C, Chen YY, Liphardt J, Hwang ES, Weaver VM. Human breast cancer invasion and aggression correlates with ECM stiffening and immune cell infiltration. Integr Biol (Camb). 2015; 7:1120-34.
45. Steinwachs J, Metzner C, Skodzek K, Lang N, Thievessen I, Mark C, Munster S, Aifantis KE, Fabry B. Three-dimensional force microscopy of cells in biopolymer networks. Nat Methods. 2016; 13:171-6.
46. Wozniak MA, Keely PJ. Use of three-dimensional collagen gels to study mechanotransduction in T47D breast epithelial cells. Biological procedures online. 2005; 7:144-61.
47. Gonzalez-Nieves R, Desantis AI, Cutler ML. Rsu1 contributes to regulation of cell adhesion and spreading by PINCH1-dependent and - independent mechanisms. J Cell Commun Signal. 2013.
48. Dougherty GW, Jose C, Gimona M, Cutler ML. The Rsu-1-PINCH1-ILK complex is regulated by Ras activation in tumor cells. Eur J Cell Biol. 2008; 87:721-34.
49. Haage A, Schneider IC. Cellular contractility and extracellular matrix stiffness regulate matrix metalloproteinase activity in pancreatic cancer cells. FASEB J. 2014; 28:3589-99.
50. Minn AJ, Gupta GP, Siegel PM, Bos PD, Shu W, Giri DD, Viale A, Olshen AB, Gerald WL, Massague J. Genes that mediate breast cancer metastasis to lung. Nature. 2005;436:518-24.
51. Foty R. A simple hanging drop cell culture protocol for generation of 3D spheroids. Journal of visualized experiments. 2011.
52. Hermanowicz P, Sarna M, Burda K, Gabrys H. AtomicJ: an open source software for analysis of force curves. Rev Sci Instrum. 2014;85:063703.
53. Horcas I, Fernandez R, Gomez-Rodriguez JM, Colchero J, Gomez-Herrero J, Baro AM. WSXM: a software for scanning probe microscopy and a tool for nanotechnology. Rev Sci Instrum. 2007;78:013705.