
Introduction
There is ample evidence for gene amplifications in human tumors [1, 2]. More recently, several studies reported gene amplification also in stem cells or progenitor cells during developmental processes and specifically during differentiation. As part of the embryonic development ERBB2 gene amplification occurs in human trophoblast cells [3]. Recently, amplification of placental genes was reported in trophoblast giant cells [4]. We found a larger number of amplifications using array-CGH and fluorescence in situ hybridization during differentiation of human neural progenitor cells and mouse neural stem and progenitor cells [5, 6]. We also detected gene amplifications during the differentiation of human and mouse myoblasts towards muscle cells [7]. Amplifications during the differentiation process occur apparently only in small sub-population of the cells [5] making them difficult to detect especially in high throughput assays, which mostly analyze a large number of cells. Although the presence of amplifications as part of developmental process appears to be assured, the biological role of amplifications in this physiological process is less well established. As for many mutations, amplifications can be a driving force or a bystander for these processes. With only a few cells carrying amplifications, it is near to impossible to obtain evidence for functional relevance by determining the expression levels of the amplified genes within a cell population that mostly contains cells without gene amplification. Alternatively, amplifications that occur in an orchestrated way during specific cellular processes may be indicative of functional relevance as opposed to amplifications that occur randomly. Our abovementioned studies on the differentiation of human and mouse myoblasts towards muscle cells provided first evidence for ordered amplification events. Here, we set out to answer the question whether amplifications occur in an orderly sequence as part of the differentiation of human neural stem cells. To this end, we compared the sequence of amplification events during three different lineages of differentiation and ask for the specificity of an amplification pattern for each of these processes. In detail, we differentiated neural stem cells towards astrocytes, neurons and oligodendrocytes to investigate gene amplifications.
Results
An overview on experimental design is shown in Figure 1. To analyze amplifications during different lineages of differentiation we induced differentiation of adherent growing human neural stem cells (NSC; H9 hESC-derived; GIBCO) into oligodendrocytes, astrocytes, and neurons. In detail, NSC were grown as adherent cells on CELL StartTM treated culture surface with EGF and bFGF for 24h in the following referred to as time point 0 h. Subsequently, NSC cells were induced to differentiate towards oligodendrocytes with Neurobasal® medium supplemented with B-27® Serum-Free Supplement, GlutaMAX™-I and T3 on polyornithine and laminin-coated culture dish. Differentiation towards neurons was induced by Neurobasal® medium supplemented with B-27® Serum-Free Supplement and GlutaMAX™-I on polyornithine- and laminin-coated culture dish. Differentiation towards astrocytes was induced by D-MEM supplemented with N-2, GlutaMAX™-I, and 1% FBS on Geltrex® matrix–coated culture dish. Spontaneous differentiation was induced by growth factor depletion. In each of the four assays DNA was isolated four times after 24 hours each (1-4 days). For all lineages of differentiation and all time points we determined the copy number of eight genes including CDK4, MDM2, EGFR, GINS2, GFAP, TP53, DDB1 and MDM4 all of which are known to localize to amplified genomic regions in neural progenitor cells during differentiation and to be amplified in human glioblastoma. The amplification was determined by qPCR analysis (TaqMan) in four replicates with the data analyzed by the software “copy caller“ (Applied Biosystems) as described previously [7, 8]. Mean calculated copy numbers for control DNA from blood lymphocytes revealed values in the range from 1.8 to 2.14 and were further regarded as normal diploid copy number. A decreased copy number was defined by values <1.8, an increased copy number by values > 2.2 and < 2.3 and an amplification by values > 2.3. Results of all experiments were summarized in Table 1.
Table 1: Results of copy number analysis in neural stem and progenitor cells
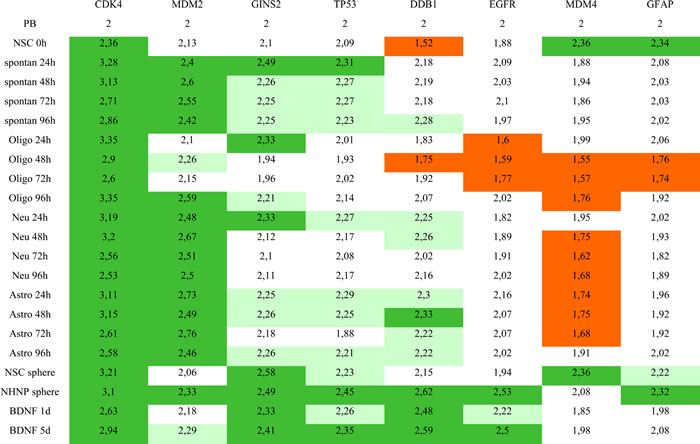
Mean calculated copy numbers from four replicate experiments were defined as follows: copy number increase: 2.2-2.3 (light green), amplification: >2.3 (dark green), under- replication: < 1.8 (orange)
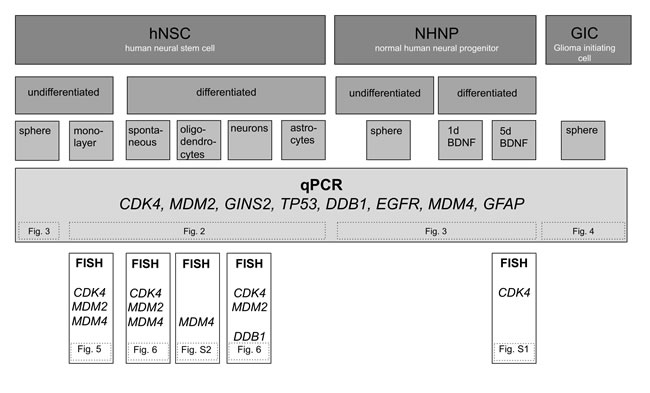
Figure 1: Overview of experimental design. Graphic overview on used cells, differentiation induction, and techniques to analyze amplification. Reference to other figures, is given by numbers in dashed boxes.
As for CDK4 the copy number was already amplified in undifferentiated NSCs (0 h) as compared to peripheral blood that was used as reference. We found a high copy number increase of CDK4 24 h after differentiation induction in all 4 differentiation protocols. In all protocols the CDK4 copy number decreased at 72 h. For the last time point (96 h) we found divergent results with a strong increase of the copy number in differentiating oligodendrocytes, a moderate increase in the spontaneously differentiated cells, and a low copy number in differentiating astrocytes and neurons (Figure 2a and Table 1). MDM2 that is localized in close vicinity to CDK4 on chromosome 12, showed a different amplification pattern upon differentiation induction. Among the 4 differentiation protocols the less MDM2 amplification was found in NSCs differentiating towards oligodendrocytes. Differentiating oligodendrocytes showed the strongest MDM2 amplification after 96 h. We found comparable MDM2 amplification pattern in spontaneously differentiated cells and in differentiating neurons with the highest MDM2 amplification levels found at 48 h and/or 72 h. Differentiation into the astrocytic lineage showed yet a different pattern with the highest MDM2 amplification levels at 24 h and 72 h (Figure 2b and Table 1).
Similar to the amplification pattern of CDK4, we found amplification for GINS2 already at 24 h specifically in differentiating oligodendrocytes, differentiating neurons and spontaneously differentiated cells. Subsequently there was a lower GINS2 copy number at 48 h and at 72 h. At the last time point (96 h) there was again an increased copy number of GINS2 in differentiating oligodendrocytes while the copy number remained unchanged in spontaneously differentiated cells and differentiating neurons (Table 1). A yet different amplification pattern was found for TP53. While spontaneously differentiated cells showed a similarly increased copy number at all 4 time points, differentiating oligodendrocytes showed no copy number increase. Both differentiating neurons and differentiating astrocytes showed the highest copy numbers at the beginning (24 h) of the observed time period (Table 1). Like for the abovementioned genes including CDK4, MDM2, GINS2 and TP53 we found specific pattern of copy number changes for DDB1, EGFR, MDM4 and GFAP for each of the four differentiating protocols. However, the genes DDB1, EGFR, MDM4 and GFAP showed not only increased but also decreased copy numbers. As for the increased copy numbers, the time points at which the decrease occurred were different between the affected genes. The copy number of DDB1 was most decreased in undifferentiated NSCs (Figure 2c). We also found a decrease of the DDB1 copy number in differentiating oligodendrocytes, specifically at 24 h, 48 h, and 72 h (Table 1). As for EGFR, the most decreased copy number was found in differentiating oligodendrocytes, but a decrease in copy numbers of EGFR also occurred in differentiating neurons. Likewise, we found decreased copy numbers of GFAP in both differentiating oligodendrocytes and differentiating neurons. The overall strongest decrease in copy number was found for MDM4 with a decrease observed for all 4 differentiation-protocols (Table 1). While we found a decrease in copy number in differentiating oligodendrocytes, neurons and astrocytes, undifferentiated NSCs revealed MDM4 amplification (Figure 2d).
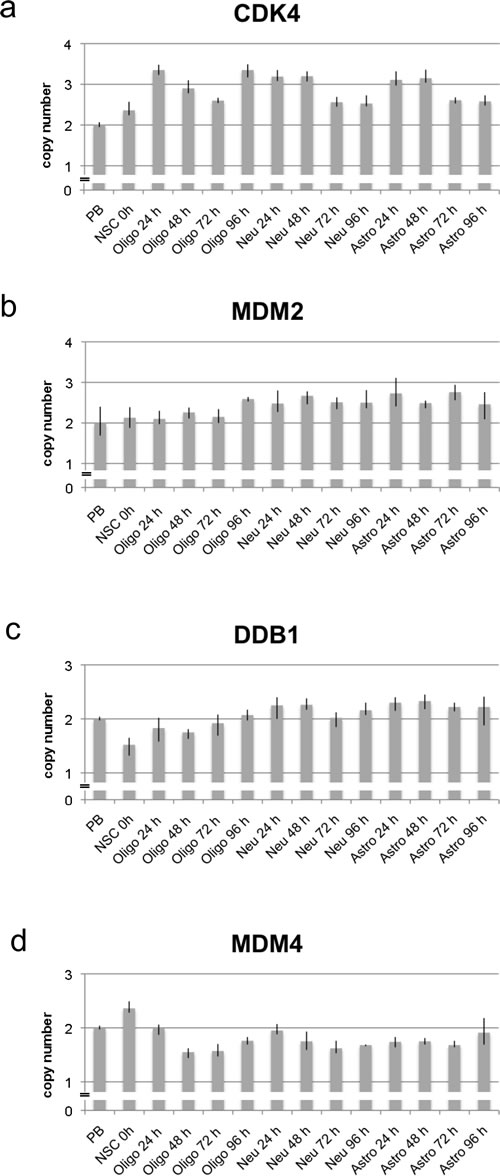
Figure 2: Copy number analysis of CDK4, MDM2, DDB1 and MDM4 using qPCR in neural stem cells and during differentiation. Copy number of CDK4, MDM2, DDB1 and MDM4 was analyzed by qPCR using TaqMan copy number assays. RNaseP was used as reference gene in the TaqMan assays and DNA from normal blood lymphocytes (PB) served as standard for normal diploid copy number. Copy numbers are shown as mean from four technical replicates with vertical lines indicating the range. NSC cells (oh) served as undifferentiated control. Differentiation induced NSC cells were analyzed at four time points after differentiation induction. Differentiation induction was either towards oligodendrocytes (oligo), towards neurons (neu) and towards astrocytes (astro). CDK4 was amplified with the highest copy number after 24 h and 96 h of differentiation towards oligodendrocytes and after 24 h and 48 h differentiation towards neurons and astrocytes a. MDM2 was amplified with the highest copy number after differentiation towards neurons and astrocytes b. DDB1 revealed a decreased copy number in undifferentiated NSCs and after 48 h differentiation towards oligodendrocytes whereas an increased copy number was detected after differentiation towards neurons and astrocytes c. MDM4 was amplified only in undifferentiated NSCs whereas a decreased copy number was detected from 48 h differentiation towards oligodendrocytes and neurons and from 24 h differentiation towards astrocytes d.
In addition to adherent growing cells growing as monolayer, cells growing as spheres were also analyzed. In detail we analyzed NSC and human neural progenitor cells (NHNP) (Lonza) both as undifferentiated spheres and NHNP spheres after differentiation induction with BDNF as described previously [5]. Both undifferentiated NSCs and NHNP spheres showed a similar pattern of CDK4 copy number amplification (Figure 3a). The copy number in both sphere cultures was also higher than in undifferentiated NSCs that were grown as adherent cells. Upon differentiation the copy number of CDK4 in NHNP spheres was decreased especially after 24 h as compared to the undifferentiated NHNP spheres (Figure 3a). As for MDM2 we did not detect an increase of the copy number in the NSC spheres. In contrast, we detected MDM2 amplification in NHNP spheres both in undifferentiated and in BDNF differentiation-induced NHNP spheres as shown in Figure 3b. For GINS2 we found amplifications in all spheres including NSC spheres, undifferentiated NHNP spheres, and BDNF differentiation-induced NHNP spheres (Figure 3c). Likewise a TP53 copy number increase occurred in all spheres with the strongest increase in undifferentiated NHNP spheres (Figure 3d). We also found specific pattern of copy number changes for DDB1, EGFR, MDM4 and GFAP in NSC spheres, undifferentiated NHNP spheres, and BDNF differentiation-induced NHNP spheres. A comparable strong copy number decrease as observed for differentiating NSCs did not occur in cells that were grown as spheres. A minimal decrease was found only for EGFR in NSC spheres and for MDM4 in BDNF induced NHNPs (Figure 3f; 3g). By contrast, DDB1 and EGFR show a rather prominent amplification specifically in undifferentiated and in differentiation-induced NHNP spheres (Figure 3e; 3f). GFAP revealed a copy number increase in NSC spheres and amplification in undifferentiated NHNP sphere (Figure 3h).
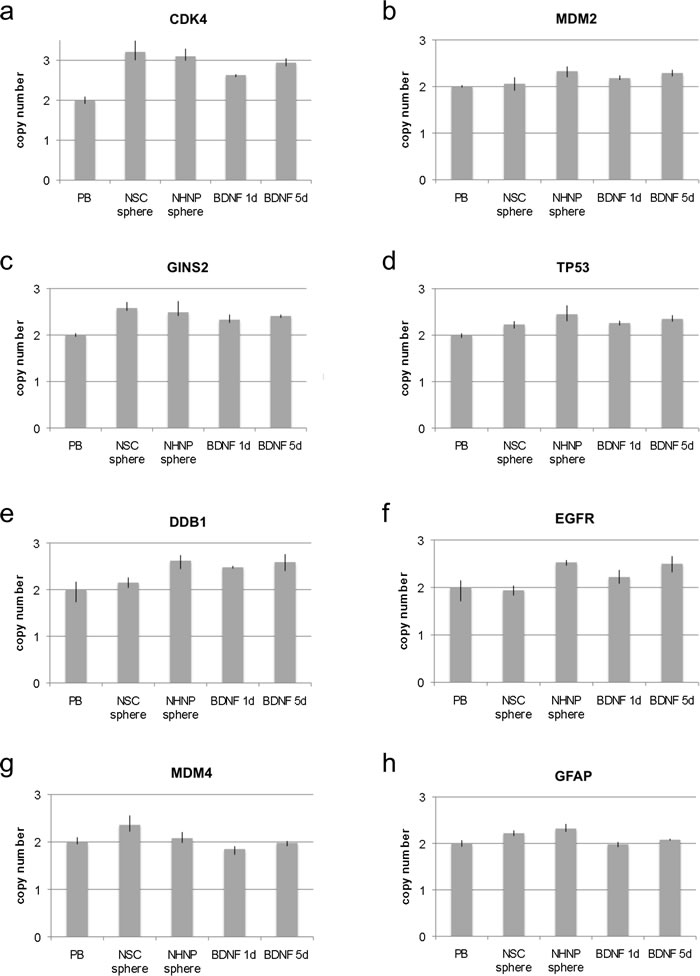
Figure 3: Copy number analysis in neural stem cell spheres and progenitor cell spheres. Copy number of CDK4, MDM2, GINS2, TP53 DDB1, EGFR, MDM4 and GFAP was analyzed by qPCR using TaqMan copy number assays. RNaseP was used as reference gene in the TaqMan assays and DNA from normal blood lymphocytes (PB) served as standard for normal diploid copy number. Copy numbers are shown as mean from four technical replicates with vertical lines indicating the range. Differentiation induction of NHNP sphere cells was either for one day with BDNF (BDNF 1d) or five days with BDNF (BDNF 5d). NSC sphere cells and NHNP sphere cells serve as undifferentiated controls. CDK4 was amplified with equal copy number in NSC and NHNP sphere cells and after 5 days of differentiation of NHNP sphere cells with BDNF a. MDM2 was amplified in NHNP sphere cells and NHNP sphere cells differentiated for 5 days with BDNF but not in NSC sphere cells b. GINS2 was amplified with equal copy number in NSC sphere cells and NHNP sphere cells and in BDNF differentiated NHNP sphere cells c. TP53 was amplified in NHNP sphere cells and in 5-day differentiation induced NHNP cells but not in NSC sphere cells d. DDB1 was amplified in NHNP sphere cells and differentiation induced NHNP cells but not in NSC sphere cells e. EGFR was amplified in NHNP sphere cells and in differentiation induced NHNP cells but not in NSC sphere cells f. MDM4 was amplified in NSC sphere cells but not in NHNP sphere cells and differentiation induced NHNP cells g. GFAP revealed an increased copy number in NSC sphere cells and amplification in NHNP sphere cells but not in differentiation induced NHNP cells h.
Amplifications in glioma stem-like cells
In addition to neural stem cells and neural progenitor cells and their differentiation towards astrocytes, neurons and oligodendrocytes, we analyzed four glioma stem-like cells (GICs #10, #993, #1043, G112) for amplification. While none of the GICs showed amplification for all genes, all samples showed amplifications for at least 3 genes. In detail, we found CDK4 amplification in samples GIC#10, GIC #993 and G112 as shown in Figure 4a. MDM2 amplification was found in GIC#993 and GIC#1043 but not in other lines as shown in Figure 4b. GINS2 amplification was detected in GIC#10 and G112 as shown in Figure 4c. TP53 amplification was detected in GIC#993 and G112 (Figure 4d). Interestingly, G112 harbors a mutant TP53 (mut p53, 273H) as described previously [9-11]. DDB1 was only amplified in GIC#993 (Figure 4e). EGFR amplification was detected in all samples with the highest copy number in GIC#10 (Figure 4f). MDM4 amplification was present in three samples (GIC#10, GIC#993 and G112) as shown in Figure 4g and GFAP amplification was detected in GIC#993 and GIC #1043 (Figure 4h).
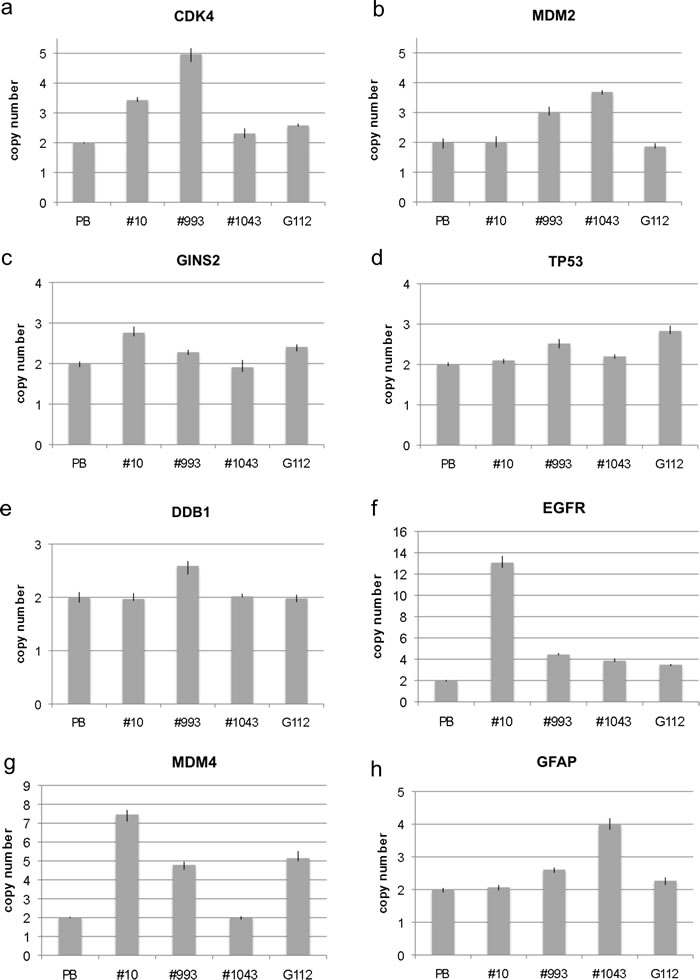
Figure 4: Copy number analysis of eight genes in glioma stem-like cells. Copy number of CDK4 a., MDM2 b., GINS2 c., TP53 d., DDB1 e., EGFR f., MDM4 g. and GFAP h. was analyzed by qPCR using TaqMan copy number assays. Normal blood lymphocytes (PB) served as standard for normal diploid copy number. Copy numbers are shown as mean from four technical replicates with vertical lines indicating the range.
Confirmation of amplification/under-representation by FISH
We used fluorescence in situ hybridization (FISH) as single cell based technique for confirmation of amplification and under-representation. Human neural stem cells were analyzed undifferentiated, spontaneously differentiated for 24 h and differentiation-induced towards neurons for 48 h. MDM4 amplification, that was detected by qPCR was confirmed by FISH in undifferentiated human neural stem cells. The MDM4 amplification was found with a very high number of fluorescence signals in ~ 5% of neural stem cells. As control we used the centromere probe D1Z5 that maps to chromosome 1 like MDM4. The number of fluorescence signals of D1Z5 indicated a normal diploid copy number of this chromosome (Figure 5a and 5b). In addition, we confirmed CDK4 amplification in 10% of undifferentiated neural stem cells. In 5% of CDK4-amplified cells we detected co-amplification of MDM2 as indicated by very prominent fluorescence signals (Figure 5c and 5d).
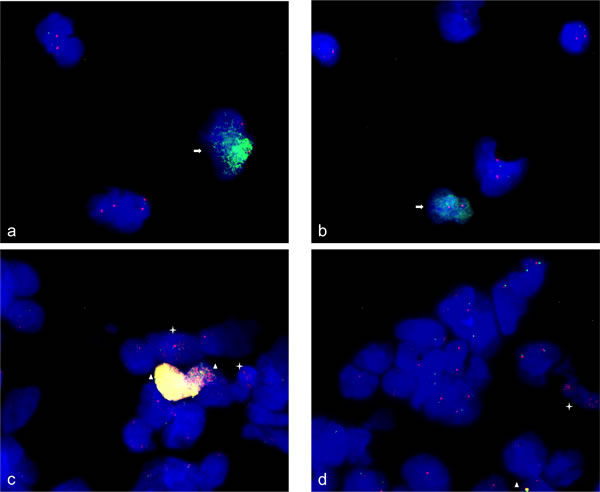
Figure 5: Gene amplifications on chromosomes 12q14-15 and 1q42.13 in human neural stem cells. FISH was used to analyze MDM4 (RP11-433N15) and CDK4 (RP11-571M6), MDM2 (RP11-611O2) gene amplification in human neural stem cells. 95% of the neural stem cells revealed two signals for the chromosome alpha-centromere probe (D1Z5) on chromosome 1 (red) and MDM4 (green) whereas 5% of the neural stem cells revealed two signals for chromosome 1 alpha-centromere and high copy number of hybridization signals for MDM4 revealing an amplification of MDM4 a., b. Similarly 90% of neural stem cells revealed two signals for CDK4 (red) and MDM2 (green) with approximately similar fluorescence intensity. In contrast 5% of neural stem cells revealed intense yellow hybridization signals indicating co-amplification of CDK4 and MDM2 and 5% of neural stem cells revealed enhanced number of hybridization signals for CDK4 and two signals for MDM2 indicating CDK4 amplification c., d. Representative cells with amplifications are marked by arrow (MDM4), asterisk (CDK4) and triangle (CDK4 and MDM2). Nuclei were counterstained with DAPI.
FISH also confirmed CDK4 amplification and MDM2 amplification in 15% of human neural stem cells that were induced to differentiate towards neurons for 48 h (Figure 6a). Furthermore, FISH confirmed DDB1 amplification in 10% of human neural stem cells that were induced to differentiate towards neurons for 48 h. Since DDB1 maps to chromosome 11 we used STX3 that also maps to chromosome 11 as control. FISH with STX3 indicated a normal diploid copy number (Figure 6b). CDK4 and MDM2 co-amplification was detected in 1% of spontaneously differentiated neural stem cells, by FISH. In addition 25-30% of these cells also revealed CDK4 amplification but a normal diploid copy number for MDM2, which is localized in close vicinity of CDK4 on chromosome 12 (Figure 6c).
As for spontaneously differentiated neural stem cells FISH identified MDM4 amplification in 2-5% of the cells and under-representation in 20% of the cells with the latter cases indicated by a single MDM4 fluorescence signal per cell. FISH with the chromosome 1 centromere probe D1Z5 that was used as reference probe showed two signals indicating a normal diploid status (Figure 6d). FISH also revealed CDK4 amplification in 5-day BDNF differentiation-induced NHNP cells and MDM4 under-representation in neural stem cells 48 h induced to differentiate towards oligodendrocytes (Supplementary Figures 1 and 2).
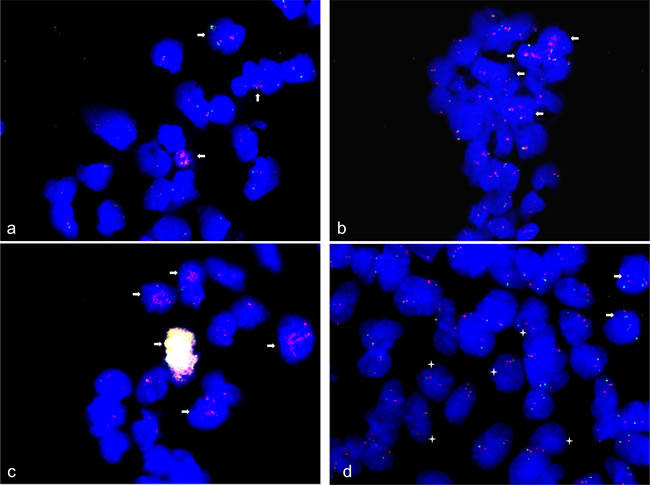
Figure 6: Gene amplification and under-replication in spontaneous and neural differentiation induced human neural stem cells. FISH was used to analyze CDK4 (RP11-571M6), MDM2 (RP11-611O2), DDB1 (CTC-820M2) and MDM4 (RP11-433N15) copy number in human neural stem cells induced to differentiate spontaneous for 24 h and towards neurons for 48 h. CDK4 (red) and MDM2 (green) amplifications were detected in 15% of neural stem cells induced to differentiate towards neurons for 48 h a. DDB1 amplification (red) was detected in 10% neural stem cells induced to differentiate towards neurons for 48 h b. and remaining cells revealed two copies for DDB1 and STX3 control BAC probe (green; RP11-468F15). CDK4 and MDM2 high copy co-amplification (yellow/white fluorescence signals) was detected in 1% of cells spontaneously differentiated and in additional 25-30% of cells CDK4 amplification was detected accompanied with normal MDM2 copy number (green) c. Under-replication of MDM4 was detected in 20% of cells differentiated spontaneously for 24 h with only one fluorescence signal (green) accompanied with normal copy number of alpha-centromere probe chromosome 1 (red) and amplification of MDM4 was detected in less than 5% of those cells d. Representative cells with amplifications are marked by arrow and cells with under-replication are marked by asterisk. Nuclei were counterstained with DAPI.
Discussion
Amplification and under-replication in context of stem cells
Even undifferentiated neural stem cells harbor multiple gene amplifications as for example MDM4 that was amplified in neural stem cells but showed a clearly decreased copy number in neural stem cells that were differentiated towards oligodendrocytes, neurons and astrocytes. Similar copy number decreases have been described in the context of gene amplifications in Drosophila [12] and most recently in mouse trophoblast cells [4]. Other genes like CDK4 were amplified not only in undifferentiated neural stem cells and undifferentiated neural progenitor cells but also during the induced differentiation processes of these cells. Notably, the amplification process appears not due to an altered polyploidy since both genes CDK4 and MDM2 are mapping on chromosome 12. Chromosome 12 shows a normal copy number in neural stem cell spheres. The copy number changes that are found for chromosome 12 during differentiation are not related to the copy number changes found for CDK4. Similar results that confirm amplification independent from polyploidy were found for TP53 and GFAP both localized on chromosome 17, DDB1 and STX3 (control probe in FISH experiments) both localized on chromosome 11 and for MDM4 that revealed either amplification and/or under-replication accompanied with diploid copy number of chromosome 1.
Different amplification patterns were also found between adherently grown neural stem cells and cells that were grown as spheres. A difference of the amplification level was for example found between the genes GINS2 and DDB1. DDB1 was under-replicated in adherent neural stem cells but had normal copy number in spheres. GINS2 showed a normal copy number in adherent neural stem cells but was amplified in spheres. Differences in the amplification between spheres formed by neural stem cells or neural progenitor cells were also found for EGFR, TP53, MDM2 and DDB1.
As for the biological function of the amplified genes, both GINS2 and DDB1 are involved in replication. While GINS2 belongs to the GINS complex that has an essential role in the initiation of DNA replication and for the progression of DNA replication forks [13], DDB1 is involved in replication control through ubiquitination and degradation of CDT1 [14]. TP53 and DDB1 are involved in DNA damage response. MDM2 and MDM4 are p53-regulating proteins with complementary but distinct roles in the regulation of TP53 activities. Both contain a p53-binding domain and are thought to be involved in suppression of TP53 transactivation and apoptotic function. Since the TP53 amplification was predominantly detected in neural progenitor cells and in neural stem cells differentiating towards neurons and astrocytes or towards neural and glial cells, TP53 amplification is likely to be an attribute of differentiating cells. This observation is consistent with the observation by Meletis and colleagues reporting that TP53 suppresses self-renewal in adult neural stem cells [15]. Furthermore, TP53 up-regulation contributes to maintaining genome integrity in progenitor cells during differentiation steps that are prone to genome instability. Interestingly, we found a very high amplification level for the GFAP gene in neural stem cells and neural progenitor cells despite their lack of GFAP immunoreactivity for common anti-GFAP antibodies. Vice versa, no GFAP amplification was detected in differentiating neural stem or progenitor cells, which are characterized by increased expression of GFAP at the onset of differentiation. One possible explanation is that GFAP amplification may be associated with alternative splicing resulting in the expression of GFAP isoforms that may not be recognized by anti-GFAP antibodies commonly used in histological analyses. For example, one of the 8 known GFAP isoforms, GFAP∂ is highly expressed in radial glia and subventricular zone progenitors [16] but cannot be detected by commonly used anti-GFAP antibodies binding to the C-terminus which is different between GFAP∂ and the most abundant isoform GFAPα.
Confirmation of amplification and/or under-replication
There are limitations to all approaches tailored to detect copy number alterations including amplifications, polyploidy, deletions and under-replication. Both array-CGH and NGS allow to obtaining an overview on copy number changes. Standard second-generation sequencing is unlikely to unravel the amplification patterns when only a fraction of the analyzed cells carry amplifications. As for the array analysis, a threshold below log2 0.8 was frequently used to define deletions and a threshold higher log2 1.2 to define amplifications. While these thresholds were valuable for uniform cell populations they are of limited use for heterogeneous cell populations especially for analyzing small sub-populations carrying copy number alteration. For example our previous whole genome tiling array-CGH analysis detected CDK4 amplifications in 5-days BDNF differentiated NHNP cells but not in 1-day BDNF differentiated NHNP cells [5]. Here, we choose threshold settings for qPCR analysis to identify copy number alterations that are limited to small sub-populations in heterogeneous cell populations. Comparable thresholds of >2.31 and >2.5 were used in studies on TERC gene amplification in chronic myeloid leukemia and EGFR copy number in metastatic lung cancer [17, 18]. In addition, we used fluorescence in situ hybridization to detect copy number alterations that occur in very few cells. For example, MDM4 under-representation in 24 h spontaneously differentiated hNSC cells was not detected by qPCR analysis even using our threshold settings but by FISH, which revealed loss of one copy in 20-25% of the cells.
Notably, we did not detect copy number decreases by qPCR in sphere cells. This may be due to the fact that sphere cells were only gradually exposed to differentiation inducing conditions. Depending on sphere size the relative number of cells with copy number changes is lower than in cell culture. While gene amplifications with a high copy number increase to more than 50 copies are still detectable in spheres, copy number decreases with only one copy lost per cell, go very likely undetected in spheres. The potential of alternative whole genome sequencing to detect copy number changes is controversially discussed [19]. Tattini and co-workers indicated third generation sequencing as potential solution, which in our opinion may be ideally combined with single cell sequencing.
Amplification in context of glioma cells
EGFR is amplified in almost 50% of glioblastoma and 20% of anaplastic oligodendroglioma. Previously, we did not detected EGFR amplifications in undifferentiated NHNP sphere cells by whole genome tiling array-CGH analysis only showing log2-ratio values that did not reach the threshold for amplification [5]. Likewise, array-CGH did not detect EGFR amplifications in human and mouse neural progenitor cells neither in a differentiated nor in a not-differentiated state. By contrast, other genes including CDK4 and MDM4 frequently amplified in glioblastoma were also amplified in human neural progenitor cells during differentiation [5]. Using TaqMan PCR analysis we now show EGFR amplifications in human neural progenitor cells and in human neural progenitor cells during differentiation. Interestingly we did also detect EGFR amplification in neural stem cells differentiating towards the astrocytic lineage. Our array-based amplification analyses warrant a more detailed analysis of gene and chromosome regions to get a deeper insight in gene amplification pattern in stem and progenitor cells.
The amplification data of stem and progenitor cells and the amplification data obtained for glioma stem-like cells, can help to define cell populations at the origin of the glioma stem-like samples. Since MDM4 was only amplified in neural stem cells, neural stem cell are likely to be at the origin of the glioma stem-like cells #10, #993 and G112. EGFR amplification in undifferentiated and differentiating NHNP cells, point to neural progenitor cells at the originating of glioma stem-like cell samples. DDB1 amplification was only present in NHNP cells and in neural stem cells that were differentiation induced towards astrocytes. DDB1 copy number increase was present during beginning differentiation of neural stem cells towards neurons (24-48h). During further differentiation of neural stem cells towards oligodendrocytes for 72-96h, copy number increased from under-replicated state to normal copy number. These data indicate a more differentiated cell type as originating cell in glioma stem-like cell #993 derived from oligodendroglioma. GFAP amplification was only detected in neural stem cells and neural progenitor cells but not in differentiation-induced progeny of neural stem and progenitor cells. These data indicate a neural stem and neural progenitor cell at the origin of glioma stem-like samples #993 and #1043. In conclusion, gene amplifications specifically gene amplifications of DDB1, EGFR, MDM4 and GFAP can provide information about the cell types and the degree of heterogeneity at the origin of glioma stem-like cells. CDK4, MDM2, GINS2 and TP53 amplifications appeared less or not suitable to narrow down the originating cell composition. It is possible that the tumor reuse the same amplification pattern that is physiologically defined to normal stem cells. While this information can help to learn more about the origin of glioma it will not have immediate impact on new clinical treatment strategies of glioma.
Amplification maintained throughout stem cell divisions
Interestingly, CDK4 amplification appears to be rather frequent with amplification detected in all investigated samples. Notably, although fluctuations in CDK4 copy number were found during differentiation, the CDK4 amplification was found to be a persistent phenomenon. During differentiation of neural stem cells towards oligodendrocytes, amplification of CDK4 even increased after four days. Fluorescence in situ hybridization of neural progenitor cells indicated CDK4 amplifications in a limited number of neural progenitor cells with asymmetrical cell division (Supplementary Figure 1). The maintained CDK4 amplification in only few cells suggests that CDK4 amplification contributes to the overall regenerative capacity of the whole population. Our results support the idea that basic amplification level of CDK4 is conserved in neural stem cells, in neural progenitor cells, and in their differentiated progeny. It is tempting to hypothesize that CDK4 amplification is important to maintain proliferation and self-renewal propensity not only in neural stem cells but also in their differentiated progenies. Notably, the highest level of CDK4 amplification was found under oligodendrocyte-inducing conditions (Table 1). Furthermore, although the increase in CDK4 amplification was detected under all conditions tested at 1 day after differentiation induction, its magnitude was most persistent under oligodendrocyte-inducing condition. In this regard, it is noteworthy that CDK4 plays an important role in the maintenance of self-renewal in NG2+ progenitors that comprise a principal population of proliferation-capable cells for oligodendrocytes in the olfactory bulb [20, 21]. Further testing is required to clarify the relationship between CDK4 amplification and self-renewal capacity.
Materials and Methods
Cell culture and differentiation
NHNP cells were grown and differentiated as described previously [5]. GIBCO Human neural stem cells (H9 hESC-derived) further named NSC, were cultured on CELLStartTM-coated culture ware with complete StemPro NSC SFM medium as described in the manufacturers’ instructions. Neural stem cell sphere cultures were grown in uncoated culture ware.
For spontaneously differentiation of NSCs, these cells were plated at 2.5x10⁴ cells/cm2 on CELLStart tissue culture plates in StemPro NSC SFM medium without bFGF and EGF.
For differentiation towards oligodendrocytes NSC were plated at 2.5x10⁴ cells/cm2 on poly-L-ornithine/laminin coated tissue culture plates with Neurobasal Medium (supplemented with B-27 serum-free supplement, GlutaMAX and 30ng/ml T3).
For differentiation towards astrocytes NSC were plated at 2.5x10⁴ cells/cm2 on Geltrex matrix coated tissue culture plates with D-MEM (supplemented with N-2 supplement, GlutaMAX and 1%FBS).
For differentiation towards neurons NSC cells were plated at 2.5x10⁴ cells/cm2 on poly-L-ornithine coated tissue culture plates with Neurobasal Medium (supplemented with B-27 serum-free supplement and GlutaMAX).
Glioma stem-like cells (GIC) were isolated from surgical specimens and characterized as described previously [11, 22].
DNA isolation
Cells were harvested and DNA was isolated using chlorofom/NaCl method. In brief cell pellet was digested with Proteinase K at 55°C over night (> 12h) and chloroform extracted for 1h at room temperature.
QPCR analysis
TaqMan Copy Number Assays for genes CDK4 (Hs00957586_cn), MDM2 (Hs00181272_cn), GINS2 (Hs05472641_cn), TP53 (Hs05506931_cn), DDB1 (Hs07226265_cn), EGFR (Hs01463609_cn), MDM4 (Hs05784087_cn), GFAP (Hs01144882_cn) were performed following manufacturers instructions. We used the RNaseP TaqMan Copy Number reference assay for relative quantitation of copy number of target genes. DNA from human normal blood lymphocytes (PB) was used as control standard for normal diploid copy number.
TaqMan assays were run in four technical replicates and results were analyzed using StepOneTM Software v2.0 and CopyCallerTM software.
Fluorescence in situ hybridization
BAC clones were taken either from the RP11 Human Male BAC library, that was generated by the BACPAC Resource Center (BPRC) at the Children’s Hospital Oakland Research Institute by Kazutoyo Osoegawa [23] or from RZPD made available through SourceBioSciences, Germany. BAC-DNA (1µg) was either labeled with Alexa-488-dCTP, with Alexa-555-dCTP or with Alexa-594-dCTP using the FISHTag DNA labeling Kit according to the manufacturer’s instructions. Differentially labeled probe DNAs (60 ng) were precipitated in the presence of human Cot-1 DNA. Samples were resuspended in hybridization mix (50% formamide, 2xSSPE, 10% dextrane sulphate and 4% SDS). Alpha-centromere probe from chromosome 1 (D1Z5) was added to the resuspended probe mix.
Differentiating human neural stem cells and undifferentiated neural stem cells were grown on glass slides with appropriate coating and fixed in ice-cold methanol for 20 minutes. Slides were washed in PBS for 5 minutes and treated with 0.02% Tween-20 for 3 minutes. Slides were RNase treated (100 µg/ml RNaseA in 2x SSC) for 1h at 37°C and pepsin treated (0.005% in 0.01 M HCl at 37°C) for 10 minutes. Postfixation was performed using 1% formaldehyde/1x PBS for 10 minutes at room temperature. Hybridization and posthybridization washes were as described previously [6].
Abbreviations
array-CGH (array comparative genomic hybridization), BDNF (brain-derived neurotrophic factor), CDK4 (cyclin-dependent kinase 4), CDT1 (Chromatin Licensing And DNA Replication Factor 1), DDB1 (DNA-damage-binding protein 1), EGFR (epidermal growth factor receptor), FISH (fluorescence in situ hybridization), GFAP (Glial Fibrillary Acidic Protein), GIC (glioma stem-like cell), GINS2 (go-ichi-ni-san 2), hESC (human embryonic stem cell), MDM2 (mouse double minute 2), MDM4 (mouse double minute 4), NG2+ (nerve/glial antigen 2 positive), NHNP (normal human neural progenitor), NSC (neural stem cell), PB (peripheral blood), qPCR (quantitative polymerase chain reaction), SFM (serum free medium).
Author contributions
UF performed experiments, designed the study and wrote the manuscript. EK performed experiments with glioma sphere cells and supplied DNA. AK analyzed data and reviewed the manuscript. EM designed the study and wrote the manuscript.
Acknowledgments
We thank E. Maldener for technical assistance.
Conflicts of interest
The authors declare no conflict of interests.
Funding
The “Deutsche Forschungsgemeinschaft” funded this study (Fi644/2-1; Fi644/2-2).
References
1. Schwab M. Oncogene amplification in solid tumors. Semin Cancer Biol. 1999; 9:319–25.
2. Fischer U, Leidinger P, Keller A, Folarin A, Ketter R, Graf N, Lenhof HP, Meese E. Amplicons on chromosome 12q13-21 in glioblastoma recurrences. Int J Cancer. 2010; 126:2594–2602.
3. Meinhardt G, Kaltenberger S, Fiala C, Knöfler M, Pollheimer J. ERBB2 gene amplification increases during the transition of proximal EGFR(+) to distal HLA-G(+) first trimester cell column trophoblasts. Placenta. 2015; 36:803–08.
4. Hannibal RL, Baker JC. Selective Amplification of the Genome Surrounding Key Placental Genes in Trophoblast Giant Cells. Curr Biol. 2016; 26:230–36.
5. Fischer U, Keller A, Voss M, Backes C, Welter C, Meese E. Genome-wide gene amplification during differentiation of neural progenitor cells in vitro. PLoS One. 2012; 7:e37422.
6. Fischer U, Backes C, Raslan A, Keller A, Meier C, Meese E. Gene amplification during differentiation of mammalian neural stem cells in vitro and in vivo. Oncotarget. 2015; 6:7023–39. doi: 10.18632/oncotarget.3248.
7. Fischer U, Ludwig N, Raslan A, Meier C, Meese E. Gene amplification during myogenic differentiation. Oncotarget. 2016; 7:6864–77. doi: 10.18632/oncotarget.6845.
8. Fischer U, Ludwig N, Keller A, Backes C, Meese E. Genome-wide copy number profiling of mouse neural stem cells during differentiation. Genom Data. 2015; 5:3–6.
9. Anker L, Ohgaki H, Ludeke BI, Herrmann HD, Kleihues P, Westphal M. p53 protein accumulation and gene mutations in human glioma cell lines. Int J Cancer. 1993; 55:982–987.
10. Kim E, Günther W, Yoshizato K, Meissner H, Zapf S, Nüsing RM, Yamamoto H, Van Meir EG, Deppert W, Giese A. Tumor suppressor p53 inhibits transcriptional activation of invasion gene thromboxane synthase mediated by the proto-oncogenic factor ets-1. Oncogene. 2003; 22:7716–27.
11. Barrantes-Freer A, Renovanz M, Eich M, Braukmann A, Sprang B, Spirin P, Pardo LA, Giese A, Kim EL. CD133 Expression Is Not Synonymous to Immunoreactivity for AC133 and Fluctuates throughout the Cell Cycle in Glioma Stem-Like Cells. PLoS One. 2015; 10:e0130519.
12. Sher N, Bell GW, Li S, Nordman J, Eng T, Eaton ML, Macalpine DM, Orr-Weaver TL. Developmental control of gene copy number by repression of replication initiation and fork progression. Genome Res. 2012; 22:64–75.
13. Douglas ME, Diffley JF. Recruitment of Mcm10 to Sites of Replication Initiation Requires Direct Binding to the Minichromosome Maintenance (MCM) Complex. J Biol Chem. 2016; 291:5879–88.
14. Jin J, Arias EE, Chen J, Harper JW, Walter JC. A family of diverse Cul4-Ddb1-interacting proteins includes Cdt2, which is required for S phase destruction of the replication factor Cdt1. Mol Cell. 2006; 23:709–21.
15. Meletis K, Wirta V, Hede SM, Nistér M, Lundeberg J, Frisén J. p53 suppresses the self-renewal of adult neural stem cells. Development. 2006; 133:363–69.
16. Middeldorp J, Boer K, Sluijs JA, De Filippis L, Encha-Razavi F, Vescovi AL, Swaab DF, Aronica E, Hol EM. GFAPdelta in radial glia and subventricular zone progenitors in the developing human cortex. Development. 2010; 137:313–21.
17. Mohamad Ashari ZS, Sulong S, Hassan R, Husin A, Sim GA, Abdul Wahid SF. Low level of TERC gene amplification between chronic myeloid leukaemia patients resistant and respond to imatinib mesylate treatment. Asian Pac J Cancer Prev. 2014; 15:1863–69.
18. Mansuet-Lupo A, Zouiti F, Alifano M, Tallet A, Charpentier MC, Ducruit V, Devez F, Lemaitre F, Laurent-Puig P, Damotte D, Blons H. Intratumoral distribution of EGFR mutations and copy number in metastatic lung cancer, what impact on the initial molecular diagnosis? J Transl Med. 2014; 12:131.
19. Tattini L, D’Aurizio R, Magi A. Detection of Genomic Structural Variants from Next-Generation Sequencing Data. Front Bioeng Biotechnol. 2015; 3:92.
20. Jablonska B, Aguirre A, Vandenbosch R, Belachew S, Berthet C, Kaldis P, Gallo V. Cdk2 is critical for proliferation and self-renewal of neural progenitor cells in the adult subventricular zone. J Cell Biol. 2007; 179:1231–45.
21. Aguirre A, Gallo V. Postnatal neurogenesis and gliogenesis in the olfactory bulb from NG2-expressing progenitors of the subventricular zone. J Neurosci. 2004; 24:10530–41.
22. Barrantes-Freer A, Kim E, Bielanska J, Giese A, Mortensen LS, Schulz-Schaeffer WJ, Stadelmann C, Brück W, Pardo LA. Human glioma-initiating cells show a distinct immature phenotype resembling but not identical to NG2 glia. J Neuropathol Exp Neurol. 2013; 72:307–24.
23. Osoegawa K, Woon PY, Zhao B, Frengen E, Tateno M, Catanese JJ, de Jong PJ. An improved approach for construction of bacterial artificial chromosome libraries. Genomics. 1998; 52:1–8.