
INTRODUCTIOIN
Lung cancer is the leading cause of cancer related death worldwide [1]. Non-small-cell lung cancer (NSCLC) accounts for 75-80 % of lung cancer, with adenocarcinomas being the most common histological subtype [2]. Lung adenocarcinoma is known as a heterogeneous tumor from every perspective, including molecular, clinical, radiological, surgical, and pathological aspects [3]. Acknowledging this, a new histologic classification system for lung adenocarcinomas was proposed in 2011 with the joint effort of International Association for the Study of Lung Cancer (IASLC), American Thoracic Society (ATS) and European Respiratory Society (ERS) [4]. The terminology and criteria of the new classification system are intended to better guide routine patient care and to improve accuracy of data collection for clinical trials [5].
One of the major changes of this new IASLC/ATS/ERS classification is that invasive adenocarcinoma subtypes are classified by predominant pattern after performing comprehensive histological subtyping with semiquantitative assessment of each subtype in 5% increments [4]. A remarkable correlation between survival and histopathological subtypes of adenocarcinoma on the basis of this new classification has been validated in several studies [3, 6-10]. Xu et al. [6] reported that patients with micropapillary and solid predominant tumors had a significantly worse overall survival and disease free survival as compared to those with other subtypes predominant tumors. In another study [9], it also confirmed that patients with micropapillary or solid predominant patterns had poor overall survival. Yoshizawa et al. [3] pointed out that patients of intermediate grade (lepidic/ acinar/papillary predominant) had significantly better overall survival than those of high grade (micropapillary/solid predominant/ colloid predominant/ invasive mucinous adenocarcinoma). These results suggested that histological subtyping could be considered as a powerful predictor of biological behavior in lung adenocarcinoma, patients with poor prognostic histological components, such as micropapillary or solid predominant, should receive more careful follow-up and be monitored more closely for disease progression. For those patients with unresectable lung cancer and those who do not wish to undergo surgery, biopsy specimens might be the only available material for histological subtyping. However, accurate assessment of adenocarcinoma histologic subtype on biopsy samples is rather challenging as small biopsy specimens may be limited in representing the entire tumor due to intra-tumor heterogeneity.
Imaging can provide good spatial resolution and capture information that assesses whole tumor heterogeneity [11]. With recent technological advance in medical imaging, computer-assisted image texture analysis which allows noninvasively quantifying tumor heterogeneity by extracting quantitative parameters of the tumor has shown promising results in tumor differentiation, outcomes prediction, and pathologic features characterization [12-16]. Computed tomography (CT) has been widely used as the initial radiologic modality for lung cancer patients, many researchers have attempted to incorporate CT texture analysis in clinical practice. In a recent study conducted by Chae et al. [17], computerized texture analysis of persistent part-solid ground-glass nodules has the potential ability to differentiate pre-invasive lesions from invasive pulmonary adenocarcinomas. Similarly, Son et al. [18]demonstrated that quantitative analysis of preoperative CT imaging metrics can help distinguish invasive adenocarcinoma from pre-invasive or minimally invasive adenocarcinoma in pulmonary ground-glass opacity nodules. To the best of our knowledge, there were relatively few studies that investigated the role of texture analysis on contrast-enhanced CT (CECT) in lung adenocarcinoma. In this study, we reviewed CECT images of 148 surgically resected lung adenocarcinoma patients, and investigated its correlation with pathologic grade as determined by new IASLC/ATS/ERS classification.
RESULTS
Agreement between two radiologists tested by using κ coefficient analysis was perfect for enhancement heterogeneity (kappa = 0.807).
One hundred and forty-eight patients with 148 peripheral lung adenocarcinomas were included in this study. The clinicopathological characteristics were summarized in Table 1. The median age was 60 years, ranging from 30 to 76 years. Of the 148 patients, 81 (54.7%) were never smokers, and 67 (45.3%) were current or former smokers. The majority patients were female (59.2%), while 61 patients were male (41.2%). Lobectomy was performed in 140 patients, pneumonectomy in 1, wedge resection in 2, and segmentectomy in 5 patients. 100 (67.6%) patients were of early stage (I or II), and 48 (32.4%) with advanced stage (III or IV).
Table 1: Patient demographics
Variables |
N (n= 148) (%) |
Age, median (range) |
60 (30-76) |
Gender |
|
Male |
61 (41.2) |
Female |
87 (59.2) |
Smoking history |
|
Never smokers |
81 (54.7) |
Smokers |
67 (45.3) |
Stage |
|
I |
86 (58.1) |
II |
14 (9.5) |
III |
40 (27.0) |
IV |
8 (5.4) |
Histologic subtype |
|
acinar predominant |
65 (43.9) |
lepidic predominant |
36 (24.3) |
papillary predominant |
12 (8.1) |
micropapillary predominant |
6 (4.1) |
solid predominant |
27 (18.2) |
invasive mucinous adenocarcinoma |
2 (1.4) |
According to the new IASLC/ATS/ERS classification, the most frequent subtype in our cohort was acinar predominant (n = 65, 43.9%), 24.3% (n = 36) of the cases were lepidic predominant, 18.2% (n = 27) of the cases were solid predominant, 8.1% (n = 12) of the cases were papillary predominant, 4.1% (n = 6) of the cases were micropapillary predominant, and 1.4% (n = 2) of the cases were invasive mucinous adenocarcinoma.
Using our pre-defined groupings we identified adenocarcinoma in situ and minimally invasive adenocarcinoma as low grade; lepidic, acinar, and papillary predominant adenocarcinoma as intermediate grade; solid, micropapillary, colloid predominant, and invasive mucinous adenocarcinoma as high grade. No adenocarcinoma in situ or minimally invasive adenocarcinoma was found in this study; therefore two pathologic grade groups were identified in this study: intermediate grade (n = 113) and high grade (n = 35). Intermediate grade comprised of lepidic predominant, acinar predominant, and papillary predominant. High grade consisted of micropapillary predominant, solid predominant, and invasive mucinous adenocarcinoma.
The association between pathologic grade and clinical characteristics was showed in Table 2. There was no significant difference in mean age, gender, or stage between intermediate grade and high grade groups. Significantly higher incidence of intermediate pathologic grade was found in never smokers (84.0%) than smokers (67.2%) (P = 0.020).
Table 2: Association between clinical characteristics and pathologic grade
Clinical characteristics |
Pathologic grade |
P value |
|
Intermediate (n= 113) |
High (n= 35) |
||
Age, mean (range) |
58.06 (30 - 76) |
59.43 (45 - 74) |
0.332 |
Gender, N (%) |
|||
Male |
42 (68.9) |
19 (31.1) |
0.080 |
Female |
71 (81.6) |
16 (18.4) |
|
Smoking history, N (%) |
|||
Never smokers |
68 (84.0) |
13 (16.0) |
0.020 |
Smokers |
45 (67.2) |
22 (32.8) |
|
Stage, N (%) |
|||
I or II |
77 (77.0) |
23 (23.0) |
0.837 |
III or IV |
36 (75.0) |
12 (25.0) |
|
In intermediate pathologic grade group, 31 tumors demonstrated homogeneous enhancement, 82 tumors had heterogeneous enhancement; while in high pathologic grade group, 11 tumors showed homogeneous enhancement, and the other 24 tumors manifested as heterogeneous enhancement. The differences in homogeneous enhancement between the intermediate grade and high grade were not significant (26.2% vs 22.6%; p = 0.671). Among those 54 CT features extracted by 3D Slicer, 29 of them showed significant difference between intermediate and high pathologic grade groups (Table 3).
Multivariate logistic regression analysis revealed that (Table 4) smoking history was proved to be independent predictors of pathologic grade, compared with never smokers, smokers with peripheral lung adenocarcinoma had a statistically significant decrease in the incidence of being intermediate pathologic grade (OR, 0.391; 95% CI, 0.179 - 0.855; P = 0.019). The AUC was 0.615 (95% CI: 0.532 - 0.694; P = 0.015), and the sensitivity and specificity were 62.9% and 60.2%, respectively. For the model generated with texture features, F33 (Homogeneity 1) (OR, 1.393; 95% CI, 1.104 - 1.758; P = 0.005) and F38 (Inverse Variance) (OR, 0.825; 95% CI, 0.692 - 0.983; P = 0.032) were independent predictors of pathologic grade, and the AUC was 0.834 (95% CI: 0.764 - 0.890; P < 0.0001) with 88.6% sensitivity and 68.1% specificity. The higher AUC was achieved by texture feature model, and it was superior to the clinical model (P = 0.0001) (Figure 1).
Table 3a: Comparison of CT features between intermediate grade group and high grade group (mean ± SD of each parameter, Student’s t-test for the comparison)
CT features |
Pathologic grade |
P value |
||
Intermediate (n= 113) |
High (n= 35) |
|||
F17 |
Surface: Volume Ratio |
0.702 ± 0.280 |
0.565 ± 0.260 |
0.011 |
F18 |
Compactness 1 |
13.106 ± 7.862 |
19.697 ± 13.236 |
0.008 |
F19 |
Compactness 2 |
0.133 ± 0.034 |
0.137 ± 0.030 |
0.538 |
F20 |
Maximum 3D Diameter |
29.480 ± 11.435 |
33.541 ± 12.300 |
0.073 |
F22 |
Sphericity |
0.507 ± 0.045 |
0.513 ± 0.040 |
0.481 |
F35 |
IMC1 |
-1.929 ± 0.090 |
-1.871 ± 0.101 |
0.002 |
F44 |
SRE |
0.911 ± 0.020 |
0.913 ± 0.021 |
0.546 |
F45 |
LRE |
3.890 ± 1.814 |
4.026 ± 1.425 |
0.686 |
F48 |
RP |
0.936 ± 0.018 |
0.924 ± 0.022 |
0.001 |
Table 3b: Comparison of CT features between intermediate grade group and high grade group (mean rank of each parameter, Mann–Whitney U-test for the comparison)
CT features |
Pathologic grade |
P value |
||
Intermediate (n= 113) |
High (n= 35) |
|||
F1 |
Energy |
72.63 |
80.54 |
0.340 |
F2 |
Entropy |
69.19 |
91.66 |
0.007 |
F3 |
Minimum Intensity |
72.31 |
81.56 |
0.265 |
F4 |
Maximum Intensity |
76.66 |
67.53 |
0.271 |
F5 |
Mean Intensity |
74.63 |
74.09 |
0.948 |
F6 |
Median Intensity |
76.42 |
68.30 |
0.327 |
F7 |
Range |
77.13 |
66.00 |
0.179 |
F8 |
Mean Deviation |
79.48 |
58.43 |
0.011 |
F9 |
Root Mean Square |
79.91 |
57.03 |
0.006 |
F10 |
Standard Deviation |
79.60 |
58.03 |
0.009 |
F11 |
Skewness |
72.02 |
82.51 |
0.206 |
F12 |
Kurtosis |
76.21 |
68.97 |
0.383 |
F13 |
Variance |
79.60 |
58.03 |
0.009 |
F14 |
Uniformity |
68.91 |
92.54 |
0.004 |
F15 |
Volume cc |
69.57 |
90.43 |
0.012 |
F16 |
Surface Area mm^2 |
69.79 |
89.71 |
0.016 |
F21 |
Spherical Disproportion |
79.74 |
57.57 |
0.008 |
F23 |
Autocorrelation |
72.35 |
81.46 |
0.272 |
F24 |
Cluster Prominence |
75.23 |
72.14 |
0.710 |
F25 |
Cluster Shade |
76.40 |
68.37 |
0.333 |
F26 |
Cluster Tendency |
73.65 |
77.26 |
0.663 |
F27 |
Contrast |
72.27 |
81.71 |
0.255 |
F28 |
Correlation |
91.68 |
51.31 |
0.000 |
F29 |
Difference Entropy |
69.21 |
91.57 |
0.007 |
F30 |
Dissimilarity |
70.98 |
85.86 |
0.073 |
F31 |
Energy (GLCM) |
69.26 |
91.43 |
0.008 |
F32 |
Entropy(GLCM) |
79.88 |
57.11 |
0.006 |
F33 |
Homogeneity 1 |
68.88 |
92.63 |
0.004 |
F34 |
Homogeneity 2 |
68.80 |
92.91 |
0.004 |
F36 |
IDMN |
69.54 |
90.51 |
0.011 |
F37 |
IDN |
69.54 |
90.51 |
0.011 |
F38 |
Inverse Variance |
68.81 |
92.86 |
0.004 |
F39 |
Maximum Probability |
68.74 |
93.10 |
0.003 |
F40 |
Sum Average |
71.15 |
85.31 |
0.088 |
F41 |
Sum Entropy |
79.92 |
57.00 |
0.006 |
F42 |
Sum Variance |
70.04 |
88.89 |
0.023 |
F43 |
Variance (GLCM) |
72.35 |
81.43 |
0.274 |
F46 |
GLN |
68.45 |
94.03 |
0.002 |
F47 |
RLN |
69.64 |
90.20 |
0.013 |
F49 |
LGLRE |
78.98 |
60.03 |
0.022 |
F50 |
HGLRE |
76.13 |
69.23 |
0.405 |
F51 |
SRLGLE |
79.37 |
58.77 |
0.013 |
F52 |
SRHGLE |
76.20 |
69.00 |
0.385 |
F53 |
LRLGLE |
73.73 |
77.00 |
0.693 |
F54 |
LRHGLE |
74.99 |
72.91 |
0.802 |
Table 4: Multivariate logistic regression models for the differentiation of intermediate and high pathologic grade groups with clinical variables and texture features
Model |
Features |
Odds ratio (95% CI) |
P value |
AUC (95% CI) |
Model1: Clinical variables |
Smoking history (smokers VS. never smokers) |
0.391 (0.179 - 0.855) |
0.019 |
0.615 (0.532 - 0.694) |
Model 2: Texture features |
F33 (Homogeneity 1) |
1.393 (1.104 - 1.758) |
0.005 |
0.834 (0.764 - 0.890) |
F38 (Inverse Variance) |
0.825 (0.692 - 0.983) |
0.032 |
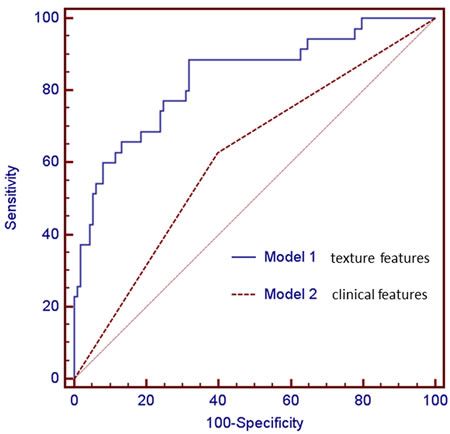
Figure 1: Comparisons of ROC curves of two logistic regression models derived from texture features (Model 1), and clinical feature (Model 2) for the prediction of pathologic grade. The model generated with texture features (Model 1, AUC = 0.834) was superior to the model with clinical variable (Model 2, AUC = 0.615). There was significant difference in AUCs between these two models (P = 0.0001).
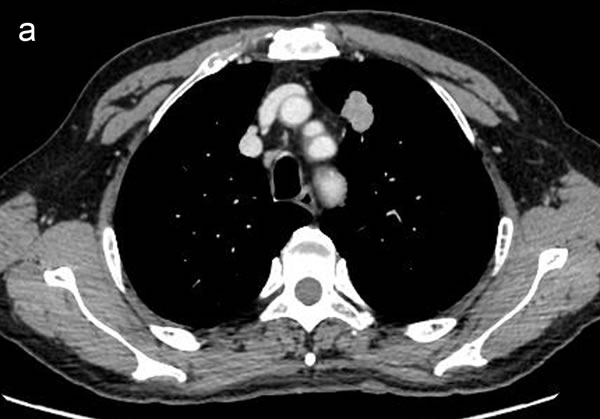
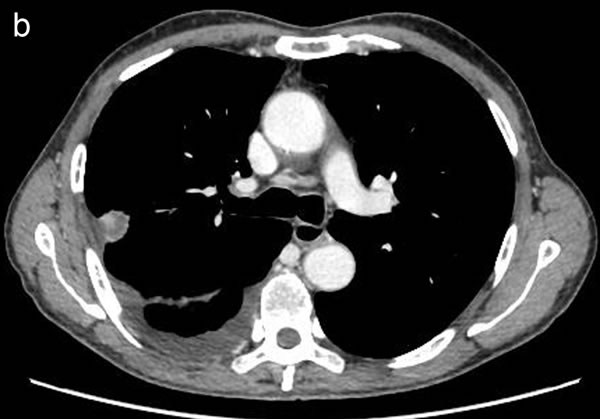
Figure 2: Representative CT images showing homogeneous enhancement (a) and heterogeneous enhancement (b).
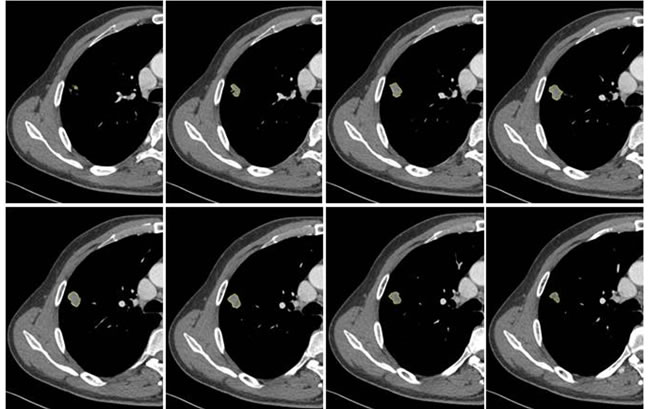
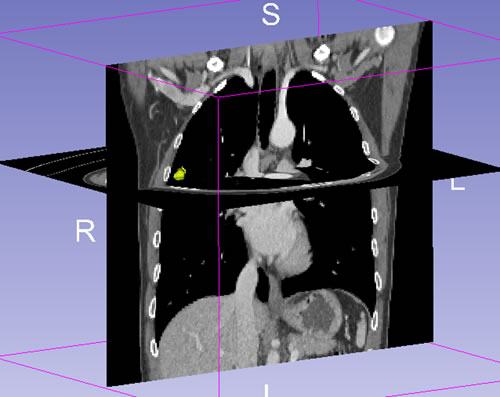
Figure 3: Example of CT images showing segmentation of lung tumor. Semiautomatic tumor segmentation was done on every slice of the tumor using 3D slicer (a), and the 3D view of the segmented tumor (b) which was shown in yellow.
DISCUSSION
Tumors are heterogeneous on both the genetic and histopathological levels, with intratumoral spatial variation in the cellularity, angiogenesis, extravascular extracellular matrix, and areas of necrosis [19]. Intratumoral heterogeneity is a well-recognized feature of malignancy that reflects areas of high cell density, necrosis, hemorrhage, and myxoid change [20], and it is considered as an important prognostic factor since high intratumoral heterogeneity may be associated with higher tumor grade [21]. Texture analysis is an image processing algorithm that based on analyzing the distribution and relationship of pixel or voxel-gray levels in the image which is only qualitatively assessable by the human visual system to a limited degree [22]. This computer assisted technique has the potential to allow extraction of quantitative parameters related to tissue heterogeneity.
Recent successful application of texture analysis on contrast enhanced CT of NSCLC [15, 16] has reported that texture analysis could be predictor of survival and treatment response. Ravanelli et al. [16] found that in the adenocarcinoma group, the product of tumor uniformity and grey level (GL*U) extracted from CECT was the unique independent variable correlating with treatment response to first-line chemotherapy. This study was performed on a single 5-mm axial image through the largest cross-sectional area of the tumor. A study of 98 patients with unresectable NSCLCs that underwent definitive concomitant chemoradiotherapy [15] demonstrated that entropy, skewness, and mean attenuation were significantly associated with 3-year overall survival, and higher entropy (adjusted hazard ratio [HR],2.31; P = 0.040), higher skewness (adjusted HR,1.92; P = 0.046), and higher mean attenuation (adjusted HR,1.93; P = 0.028) were independent predictors of decreased 3-year overall survival. In contrast to the former study, regions of interest were drawn around the boundary of the whole tumor volume. Comparison between single slice 2D with 3D texture analysis was relatively rare, and the findings were controversial. In a study involving 55 patients with primary colorectal cancer, entropy was higher and uniformity lower for the whole tumor volume compared to the largest cross-sectional area at all filter levels, and Kaplan Meier analysis showed better separation of entropy and uniformity for whole tumor analysis for 5-year overall survival, indicating that whole tumor analysis appears more representative of tumor heterogeneity [23]. Nevertheless, Lubner et al. [12] demonstrated that comparison of 2D vs. 3D measurements of single lesions showed fairly comparable results in a subset of 20 patients with hepatic metastatic colorectal cancer. We assumed that the use of single slice rather than the whole tumor to extract features is a limitation given the overall aim to quantify heterogeneity, although it is less time consuming; meanwhile, subject selection of the largest cross section of the lesion may vary among different radiologists. Therefore, texture analysis was explored on the whole tumor volume in our study.
Several studies have confirmed that the new IASLC/ATS/ERS international multidisciplinary lung adenocarcinoma classification has significant prognostic and predictive value regarding death and recurrence [3, 24, 25]; for example, lepidic predominant pattern had a lower recurrence risk, whereas micropapillary and solid predominant patterns had a higher recurrence risk. Concerning the relationship between angiogenesis and CT contrast enhancement, studies on lung cancer demonstrate a positive correlation between enhancement values and microvessel density measured on histological specimens [26, 27]. Meanwhile, study assessing the prognostic potential of texture analysis showed that high tumor heterogeneity is associated with poorer outcome [28]. Thus, we postulate that heterogeneity measured on CECT which provides information about the grade of enhancement could have potential relationship with tumor biology. This hypothesis was confirmed by the fact that 29 texture features were significantly associated with pathologic grade, including 6 first-order statistics features, 5 morphology and shape features, 13 texture features (GLCM), and 5 texture features (GLRL). First-order statistics which is dependent on a single pixel value rather than its interaction with neighboring pixels relates to gray-level frequency distribution within the region of interest [29]. The co-occurrence measurements calculated using spatial gray-level dependence matrices determine how often a pixel of intensity i finds itself within a certain relationship to another pixel of intensity j; and the run-length matrix analyzes texture in a specific direction [19]. In contrast to computer assisted image analysis, diagnostically relevant heterogeneity perceived by the naked eye demonstrated no significant difference between intermediate and high grade group. This suggests that image interpretation based on a visual process could not fully describe the underlying biological heterogeneity.
Multivariable regression analyses showed that texture features of F33 (Homogeneity 1) and F38 (Inverse Variance) were independent predictors for pathologic grade, and this model has higher predictive power than the model with clinical variable (smoking history), since the AUC for the model with texture features (AUC = 0.834) was significantly greater than the clinical model (AUC = 0.615) (P = 0.0001). This interesting finding indicates that texture analysis as a non-invasive method of assessing the heterogeneity within a tumor might be of clinical benefit in predicting pathologic grade.
Our study has some limitations. First, this was a retrospective study with single institution design; therefore there might have been unavoidable selection bias. Second, the sample size was relatively small. In addition, since the histologic heterogeneity of lung adenocarcinoma limits the diagnostic accuracy of small biopsy or cytology specimens compared to resected specimens, only patients with surgically resected lung adenocarcinoma were included in the current study. Furthermore, the follow-up time after surgery was not sufficient to evaluate the relationship between texture features and survival. Finally, potential variables such as patients’ cardiac output and blood volume which might influence tumor enhancement were not taken into consideration.
In summary, the preliminary results obtained from our study indicated that texture analysis of CECT images in lung adenocarcinomas which provides objective measurements of heterogeneity may serve as an important imaging biomarker to predict pathologic grade as determined by new IASLC/ATS/ERS classification.
materials and METHODS
Patients
This monocentric and retrospective study was approved by our institutional review board, and the need for informed consent was waived. Prior written informed consent had been acquired from patients with regard to the use of CT imaging. Between March 2013 and January 2014, a total of 213 patients were found in our surgical database that fulfilled the following criteria: (1) histopathologically confirmed lung adenocarcinoma using surgically resected specimens, (2) pre-operative thin-section CT examination of both unenhanced and contrast-enhanced at the same day, and (3) the location of the tumor was peripheral. Then, we excluded patients because of duration of CT examination and surgery exceeded one month (n = 11), preoperative adjuvant chemotherapy or radiotherapy (n = 15), poor image quality resulting from failure of breath holding during CT examination (n = 2), cases with multiple lesions on CT images that could not be conclusively correlated with the lesions documented in the pathology report (n = 1), or cases that contained ground glass opacity (GGO) component on CT images as ascertained by two radiologists (n = 36). Ultimately, 148 patients (61 men; 87 women; mean age, 58 years; range, 30-76 years) with pathologically proven lung adenocarcinoma comprised our study population. Clinical and pathologic information (age, gender, smoking history, stage, histologic subtype) were collected from the hospital’s electronic medical records system. All tumors were restaged according to the TNM classification of malignant tumors (Union for International Cancer Control/American Joint Committee on Cancer, 7th edition) [30].
CT examinations
Chest CT examinations were performed by using one of three MDCT systems: Somatom Sensation 64 (Siemens Medical Solutions, Forchheim, Germany), Light speed 16 (GE Medical Systems, Milwaukee, WI), and Discovery CT750 HD scanner (GE Medical Systems, Milwaukee, WI). For the 64-detector scanner, scanning parameters were as follows: 120 kVp with tube current adjusted automatically; pitch of 0.969; reconstruction thickness, 1.5 mm; reconstruction interval, 1.5 mm. For the 16-detector scanner and Discovery CT750 HD scanner, scanning parameters were as follows: tube voltage, 120 kVp; tube current, 150-200 mA; beam pitch, 0.969; reconstruction thickness, 1.25 mm; reconstruction interval, 1.25 mm. All of the patients underwent contrast-enhanced CT scan. Images were obtained after intravenous administration of 80 - 100 mL of non-ionic iodine contrast material (Ultravist, Bayer Pharma, Berlin, Germany; Omnipaque, GE Company, Shanghai, China) at a rate of 2.5 mL/sec using an automated injector. The CT scanning was performed with a 70-second delay. All CT scans were obtains in the supine position during breath holding at the end of full inspiration. Image resolution was determined by pixel spacing, and each case had the same image resolution.
CT image analysis and post-processing
Two radiologists (with 6, and 3 years’ experience in thoracic CT imaging, respectively), who were blinded to clinical and histiopathological data, reviewed all CT images separately. They were asked to identify pulmonary lesions and to evaluate the enhancement heterogeneity according to the following criteria: homogeneous enhancement was defined as more than 90% of the tumor area was occupied by the same CT attenuation as ascertained by visual assessment; otherwise heterogeneous enhancement was considered (Figure 2). In case of disagreement, the third reviewer with 27 years of clinical experience in thoracic imaging, made the final decision. Then, semiautomatic tumor segmentation was done in consensus by three radiologists using a designated multi-platform, free and open source software package for visualization and medical image computing (3D slicer, version 4.4.0; available at: http://slicer.org/) (Figure 3). Totally, 54 features were extracted and they were divided into four categories (Supplementary Table 1, Image features metrics are available at: https://www.slicer.org/wiki/Documentation/Nightly/Modules/HeterogeneityCAD), including (1) First-Order Statistics, (2) Morphology and Shape, (3) Texture: GLCM, and (4) Texture: GLRL.
Histologic diagnosis
All resected specimens were formalin fixed and stained with hematoxylin and eosin in the routine manner. As needed, mucin stains were performed to evaluate for mucin. All available hematoxylin and eosin-stained slides were reviewed by a pathologist. Histologic classification was done according to the proposed IASLC/ATS/ERS classification of lung adenocarcinomas; each tumor was reviewed using comprehensive histological subtyping. In the classification of invasive adenocarcinomas, 6 histologic patterns were defined as follows: (1) lepidic predominant; (2) acinar predominant; (3) papillary predominant; (4) micropapillary predominant; (5) solid predominant; and (6) variants of invasive adenocarcinomas. The predominant pattern is defined as the pattern with the largest percentage, not necessarily 50% or greater. When the individual pathologic diagnosis of a case did not coincide, agreement was obtained after discussion by both pathologists. Based on previous study [3], different subtypes were divided into three groups: low grade (adenocarcinoma in situ and minimally invasive adenocarcinoma), intermediate grade (lepidic, acinar, and papillary predominant adenocarcinomas), and high grade (solid, micropapillary, colloid predominant, and invasive mucinous adenocarcinoma).
Statistical analysis
Statistical analyses were performed using SPSS Version 21.0 (IBM Corp. IBM SPSS Statistics for Windows) and MedCalc version 11.3.8.0 (MedCalc Software, Mariakerte, Belgium). Interobserver agreement was assessed using κ statistics. A kappa value of 0.81-1.00 was considered to indicate excellent agreement; 0.61-0.80, substantial agreement; 0.41- 0.60, moderate agreement; 0.21-0.40, fair agreement; and 0.00-0.20, poor agreement. Continuous variables were expressed as mean ± SD, and were compared using the Student’s t-test or Mann-Whitney U-test; while categorical variables were presented as frequency, and were compared using the chi-square test or Fisher’s exact test. Multiple logistic regression analysis was subsequently developed to determine the association between texture features and pathologic grade, and the results were expressed as an odds ratio (OR) with a 95% confidence interval (CI). In the multivariate logistic regression analysis, features with p-value of < 0.15 in univariable model were entered into the initial model. Backward elimination method was used to select the final predictive model; at each step, feature with p-value of > 0.05 was eliminated. Receiver operating characteristic (ROC) curve for the model was constructed and the area under the curve (AUC) was calculated. A P value of < 0.05 was considered to indicate a significant difference.
CONFLICTS OF INTEREST
The authors do not have any possible conflicts of interest.
GRANT SUPPORT
This work was supported by the National Natural Scientific Foundation of China (No. 81501443), and Tianjin Science and Technology National Natural Science Foundation of China Major Project (No. 12ZCDZSY15500).
REFERENCES
1. Jemal A, Bray F, Center MM, Ferlay J, Ward E, Forman D. Global cancer statistics. CA Cancer J Clin. 2011; 61: 69-90. doi: 10.3322/caac.20107.
2. Ha SY, Roh MS. The new 2011 international association for the study of lung cancer/american thoracic society/european respiratory society classification of lung adenocarcinoma in resected specimens: clinicopathologic relevance and emerging issues. Korean J Pathol. 2013; 47: 316-25. doi: 10.4132/KoreanJPathol.2013.47.4.316.
3. Yoshizawa A, Motoi N, Riely GJ, Sima CS, Gerald WL, Kris MG, Park BJ, Rusch VW, Travis WD. Impact of proposed IASLC/ATS/ERS classification of lung adenocarcinoma: prognostic subgroups and implications for further revision of staging based on analysis of 514 stage I cases. Mod Pathol. 2011; 24: 653-64. doi: 10.1038/modpathol.2010.232.
4. Travis WD, Brambilla E, Noguchi M, Nicholson AG, Geisinger KR, Yatabe Y, Beer DG, Powell CA, Riely GJ, Van Schil PE, Garg K, Austin JH, Asamura H, et al. International association for the study of lung cancer/american thoracic society/european respiratory society international multidisciplinary classification of lung adenocarcinoma. J Thorac Oncol. 2011; 6: 244-85. doi: 10.1097/JTO.0b013e318206a221.
5. Travis WD, Brambilla E, Riely GJ. New pathologic classification of lung cancer: relevance for clinical practice and clinical trials. J Clin Oncol. 2013; 31: 992-1001. doi: 10.1200/JCO.2012.46.9270.
6. Xu CH, Wang W, Wei Y, Hu HD, Zou J, Yan J, Yu LK, Yang RS, Wang Y. Prognostic value of the new International Association for the Study of Lung Cancer/American Thoracic Society/European Respiratory Society classification in stage IB lung adenocarcinoma. Eur J Surg Oncol. 2015; 41: 1430-6. doi: 10.1016/j.ejso.2015.06.004.
7. Murakami S, Ito H, Tsubokawa N, Mimae T, Sasada S, Yoshiya T, Miyata Y, Yokose T, Okada M, Nakayama H. Prognostic value of the new IASLC/ATS/ERS classification of clinical stage IA lung adenocarcinoma. Lung Cancer. 2015; 90: 199-204. doi: 10.1016/j.lungcan.2015.06.022.
8. Song Z, Zhu H, Guo Z, Wu W, Sun W, Zhang Y. Prognostic value of the IASLC/ATS/ERS classification in stage I lung adenocarcinoma patients—based on a hospital study in China. Eur J Surg Oncol. 2013; 39: 1262-8. doi: 10.1016/j.ejso.2013.08.026.
9. Russell PA, Wainer Z, Wright GM, Daniels M, Conron M, Williams RA. Does lung adenocarcinoma subtype predict patient survival?: A clinicopathologic study based on the new International Association for the Study of Lung Cancer/American Thoracic Society/European Respiratory Society international multidisciplinary lung adenocarcinoma classification. J Thorac Oncol. 2011; 6: 1496-504. doi: 10.1097/JTO.0b013e318221f701.
10. Warth A, Muley T, Meister M, Stenzinger A, Thomas M, Schirmacher P, Schnabel PA, Budczies J, Hoffmann H, Weichert W. The novel histologic International Association for the Study of Lung Cancer/American Thoracic Society/European Respiratory Society classification system of lung adenocarcinoma is a stage-independent predictor of survival. J Clin Oncol. 2012; 30: 1438-46. doi: 10.1200/JCO.2011.37.2185.
11. Ganeshan B, Miles KA. Quantifying tumour heterogeneity with CT. Cancer Imaging. 2013; 13: 140-9. doi: 10.1102/1470-7330.2013.0015.
12. Lubner MG, Stabo N, Lubner SJ, Del Rio AM, Song C, Halberg RB, Pickhardt PJ. CT textural analysis of hepatic metastatic colorectal cancer: pre-treatment tumor heterogeneity correlates with pathology and clinical outcomes. Abdom Imaging. 2015; 40: 2331-7. doi: 10.1007/s00261-015-0438-4.
13. Hodgdon T, McInnes MD, Schieda N, Flood TA, Lamb L, Thornhill RE. Can Quantitative CT Texture Analysis be Used to Differentiate Fat-poor Renal Angiomyolipoma from Renal Cell Carcinoma on Unenhanced CT Images? Radiology. 2015; 276: 787-96. doi: 10.1148/radiol.2015142215.
14. Smith AD, Gray MR, del Campo SM, Shlapak D, Ganeshan B, Zhang X, Carson WE 3rd. Predicting Overall Survival in Patients With Metastatic Melanoma on Antiangiogenic Therapy and RECIST Stable Disease on Initial Posttherapy Images Using CT Texture Analysis. AJR Am J Roentgenol. 2015; 205: W283-93. doi: 10.2214/AJR.15.14315.
15. Ahn SY, Park CM, Park SJ, Kim HJ, Song C, Lee SM, McAdams HP, Goo JM. Prognostic value of computed tomography texture features in non-small cell lung cancers treated with definitive concomitant chemoradiotherapy. Invest Radiol. 2015; 50: 719-25. doi: 10.1097/RLI.0000000000000174.
16. Ravanelli M, Farina D, Morassi M, Roca E, Cavalleri G, Tassi G, Maroldi R. Texture analysis of advanced non-small cell lung cancer (NSCLC) on contrast-enhanced computed tomography: prediction of the response to the first-line chemotherapy. Eur Radiol. 2013; 23: 3450-5. doi: 10.1007/s00330-013-2965-0.
17. Chae HD, Park CM, Park SJ, Lee SM, Kim KG, Goo JM. Computerized texture analysis of persistent part-solid ground-glass nodules: differentiation of preinvasive lesions from invasive pulmonary adenocarcinomas. Radiology. 2014; 273: 285-93. doi: 10.1148/radiol.14132187.
18. Son JY, Lee HY, Lee KS, Kim JH, Han J, Jeong JY, Kwon OJ, Shim YM. Quantitative CT analysis of pulmonary ground-glass opacity nodules for the distinction of invasive adenocarcinoma from pre-invasive or minimally invasive adenocarcinoma. PLoS One. 2014; 9: e104066. doi: 10.1371/journal.pone.0104066.
19. Davnall F, Yip CS, Ljungqvist G, Selmi M, Ng F, Sanghera B, Ganeshan B, Miles KA, Cook GJ, Goh V. Assessment of tumor heterogeneity: an emerging imaging tool for clinical practice? Insights Imaging. 2012; 3: 573-89. doi: 10.1007/s13244-012-0196-6.
20. Nelson DA, Tan TT, Rabson AB, Anderson D, Degenhardt K, White E. Hypoxia and defective apoptosis drive genomic instability and tumorigenesis. Genes Dev. 2004; 18: 2095-107. doi: 10.1101/gad.1204904.
21. Eccles SA, Welch DR. Metastasis: recent discoveries and novel treatment strategies. Lancet. 2007; 369: 1742-57. doi: 10.1016/S0140-6736(07)60781-8.
22. Knogler T, El-Rabadi K, Weber M, Karanikas G, Mayerhoefer ME. Three-dimensional texture analysis of contrast enhanced CT images for treatment response assessment in Hodgkin lymphoma: comparison with F-18-FDG PET. Med Phys. 2014; 41: 121904. doi: 10.1118/1.4900821.
23. Ng F, Kozarski R, Ganeshan B, Goh V. Assessment of tumor heterogeneity by CT texture analysis: can the largest cross-sectional area be used as an alternative to whole tumor analysis? Eur J Radiol. 2013; 82: 342-8. doi: 10.1016/j.ejrad.2012.10.023.
24. Hung JJ, Yeh YC, Jeng WJ, Wu KJ, Huang BS, Wu YC, Chou TY, Hsu WH. Predictive value of the international association for the study of lung cancer/American Thoracic Society/European Respiratory Society classification of lung adenocarcinoma in tumor recurrence and patient survival. J Clin Oncol. 2014; 32: 2357-64. doi: 10.1200/JCO.2013.50.1049.
25. Hung JJ, Jeng WJ, Chou TY, Hsu WH, Wu KJ, Huang BS, Wu YC. Prognostic value of the new International Association for the Study of Lung Cancer/American Thoracic Society/European Respiratory Society lung adenocarcinoma classification on death and recurrence in completely resected stage I lung adenocarcinoma. Ann Surg. 2013; 258: 1079-86. doi: 10.1097/SLA.0b013e31828920c0.
26. Tateishi U, Kusumoto M, Nishihara H, Nagashima K, Morikawa T, Moriyama N. Contrast-enhanced dynamic computed tomography for the evaluation of tumor angiogenesis in patients with lung carcinoma. Cancer. 2002; 95: 835-42. doi: 10.1002/cncr.10730.
27. Li Y, Yang ZG, Chen TW, Chen HJ, Sun JY, Lu YR. Peripheral lung carcinoma: correlation of angiogenesis and first-pass perfusion parameters of 64-detector row CT. Lung Cancer. 2008; 61: 44-53. doi: 10.1016/j.lungcan.2007.10.021.
28. Ganeshan B, Panayiotou E, Burnand K, Dizdarevic S, Miles K. Tumour heterogeneity in non-small cell lung carcinoma assessed by CT texture analysis: a potential marker of survival. Eur Radiol. 2012; 22: 796-802. doi: 10.1007/s00330-011-2319-8.
29. Arivazhagan S, Ganesan L. Texture segmentation using wavelet transform. Pattern Recognit Lett. 2003; 24:3197–203. doi https://doi.org/10.1016/j.patrec.2003.08.005.
30. Edge SB, Compton CC. The American Joint Committee on Cancer: the 7th edition of the AJCC cancer staging manual and the future of TNM. Ann Surg Oncol. 2010; 17: 1471-4. doi: 10.1245/s10434-010-0985-4.