
INTRODUCTION
Head and neck squamous cell carcinoma (HNSCC) is the 6th most common cancer worldwide and affects over 60,000 patients annually in the US [1]. Treatment of advanced HNSCC requires complex, multimodality therapy, employing either definitive radiation with or without chemotherapy or surgical resection and post-operative radiation, with chemotherapy for patients with high-risk of recurrence [2, 3]. Currently, there are no molecular biomarkers to guide these management decisions. Multiple studies have demonstrated TP53 mutations are prognostic for poor outcomes in HNSCC, yet molecular testing for TP53 alterations has not become routine [4-8]. Our previous work developed and validated a novel method, EAp53, which can stratify patients with tumors harboring TP53 mutations as low or high risk which is an extension of the Evolutionary Trace (ET) approach, an extensively validated method to identify key functional or structural residues in proteins [9]. In an effort to predict which TP53 mutations are highly deleterious every sequence position is assigned a grade of functional sensitivity to sequence variations, defined by whether its evolutionary substitutions correlate with larger or smaller phylogenetic divergences. Residues with large ET grades typically cluster structurally into evolutionary ‘hot-spots’ that overlap and predict functional sites [10].
We have demonstrated that the ET method could assess the impact of TP53 missense mutations. The impact was shown to be greater when the mutated residues were more evolutionarily sensitive to sequence variations, i.e. have a larger ET grade, and also when the amino acid change was least conservative, so the mutational impact is the largest. These two components were computed and combined into a single score, called Evolutionary Action EA [11]. To apply this Evolutionary Action to TP53 mutations in HNSCC, we further developed a scoring system (EAp53) to stratify TP53 missense mutations into high and low risk. The subset of oncogenic or high-risk p53 mutations was associated with decreased survival in patients with HNSCC and increased cellular invasion and tumorigenicity [12]. In contrast, low-risk p53 mutations appeared to have retained some p53 function since patients with HNSCC containing these alterations had similar survival outcomes to wildtype p53 and cells had an intermediate level of invasiveness and tumorigenicity [12].
Class 2 myosins include a family of three nonmuscle myosins that are implicated in force generation and cell migration [13, 14]. Class 2 non-muscle myosins are hexameric molecules, comprised of a pair of heavy chains, a pair of essential light chains, and a pair of regulatory light chains (RLCs). The distinction between the three myosin II molecules is their unique heavy chain isoforms but each functions through the binding and contracting of F-actin in an ATP-dependent manner. MYH9 encodes the heavy chain of nonmuscle myosin IIA protein (NMIIA). Depletion or inactivation of NMIIA consistently leads to an increase in polarized lamellipodia formation and migration (wound healing) with a concomitant decrease in non-polarized, blunt, cylindrical protrusions or lobopodia (cellular protrusions that share functional attributes with lamellipodia and membrane blebs) formation and focal adhesions [15]. This increase in cell migration following suppression or loss of NMIIA function appears to be due to microtubule stabilization and expansion into lamellae, which can be detected by increased acetylation of α-tubulin in epithelial cells [16]. In NMIIA depleted cells, stabilized microtubules within lamellae may be driving migration through activation of Rac1 leading to enhanced actin polymerization at the leading edge [16]. This mechanism of increased migration through NMIIA suppression can be translated clinically as patients with decreased MYH9 expression have an associated decrease in overall survival [17]. Therefore, further investigation of NMIIA’s role in microtubule regulation will be significant by providing the foundation for treatment strategies targeting actively migrating cells.
In addition to NMIIA’s role in cell migration, it has also been identified as a tumor suppressor that can modulate wildtype p53 (wtp53) expression. The inhibition or suppression of NMIIA leads to decreased p53 nuclear accumulation and subsequent decreases in expression of downstream target genes [17]. To date, whether the tumor suppressor capability of p53 is dependent on the function of NMIIA remains unknown. Furthermore, the tumor suppressor characteristics of NMIIA in the context of mutated p53 have yet to be studied. The phenotypic similarities between high-risk mutp53 and NMIIA depleted cells suggests their common oncogenic phenotype may be due, in part, to loss of NMIIA’s tumor suppressor function. Therefore, the goal of this study was to determine whether loss of NMIIA function in wtp53 harboring cells reduces its tumor suppressor capability, leading to invasive cell behavior similar to that seen in high-risk mutp53.
RESULTS
MYH9 expression correlates with increased survival in patients with HNSCC having functional p53
Our previous work demonstrated in two cohorts totaling 264 patients, the novel EAp53 classification could identify high-risk p53 mutations associated with decreased survival in patients with head and neck cancer [12]. Furthermore, EAp53 identified low-risk p53 mutations that were similar to wildtype p53 and associated with improved survival outcomes and appear to retain some residual p53 function [12]. EAp53 was applied to the p53 sequence data and subsequently integrated with the MYH9 RNAseq expression data from The Cancer Genome Atlas Network Head and Neck Project (Table 1) [18]. This analysis revealed patients with low-risk mutp53 and low MYH9 expression (n=75) had decreased survival outcomes relative to patients with low-risk mutp53 and high MYH9 expression, p=.020 (n=27) (Figure 1A). High (n=70) or low (n=20) MYH9 expression was not prognostic in patients with high-risk p53 mutations (Figure 1B).
Table 1: TP53 mutations scored and stratified by EAp53 with MYH9 expression data from The Cancer Genome Atlas HNSCC Project
No.a |
TCGA |
P53 |
Mutationd |
EA Scoree |
EA Riskf |
MYH9 |
Lower 25th |
|---|---|---|---|---|---|---|---|
1 |
7250 |
Wildtype |
NA |
0 |
Low |
19059.1436 |
Yes |
2 |
6441 |
Wildtype |
NA |
0 |
Low |
21185.7003 |
Yes |
3 |
6871 |
Wildtype |
NA |
0 |
Low |
22738.9068 |
Yes |
4 |
4730 |
Wildtype |
NA |
0 |
Low |
23025.1362 |
Yes |
5 |
6939 |
Wildtype |
NA |
0 |
Low |
25580.2255 |
Yes |
6 |
4228 |
Wildtype |
NA |
0 |
Low |
26217.3401 |
Yes |
7 |
6938 |
Wildtype |
NA |
0 |
Low |
30394.2155 |
Yes |
8 |
7406 |
Wildtype |
NA |
0 |
Low |
30611.831 |
Yes |
9 |
7440 |
Wildtype |
NA |
0 |
Low |
32681.4044 |
Yes |
10 |
7631 |
Wildtype |
NA |
0 |
Low |
32909.1267 |
Yes |
11 |
7250 |
Wildtype |
NA |
0 |
Low |
34016.2272 |
Yes |
12 |
7261 |
Wildtype |
NA |
0 |
Low |
34079.456 |
Yes |
13 |
7068 |
Wildtype |
NA |
0 |
Low |
36307.9777 |
Yes |
14 |
7406 |
Wildtype |
NA |
0 |
Low |
38976.1036 |
No |
15 |
6954 |
Wildtype |
NA |
0 |
Low |
39143.3037 |
No |
16 |
6492 |
Wildtype |
NA |
0 |
Low |
39459.7833 |
No |
17 |
5243 |
Wildtype |
NA |
0 |
Low |
40087.7311 |
No |
18 |
6939 |
Wildtype |
NA |
0 |
Low |
41136.5435 |
No |
19 |
7632 |
Wildtype |
NA |
0 |
Low |
41442.4973 |
No |
20 |
7410 |
Wildtype |
NA |
0 |
Low |
41670.6444 |
No |
21 |
6938 |
Wildtype |
NA |
0 |
Low |
42522.8748 |
No |
22 |
5247 |
Wildtype |
NA |
0 |
Low |
42815.4169 |
No |
23 |
5625 |
Wildtype |
NA |
0 |
Low |
42879.4466 |
No |
24 |
7774 |
Wildtype |
NA |
0 |
Low |
43144.2177 |
No |
25 |
6955 |
Wildtype |
NA |
0 |
Low |
44674.5453 |
No |
26 |
5325 |
Wildtype |
NA |
0 |
Low |
45864.7399 |
No |
27 |
5355 |
Wildtype |
NA |
0 |
Low |
49493.0351 |
No |
28 |
5149 |
Wildtype |
NA |
0 |
Low |
50893.2238 |
No |
29 |
6227 |
Wildtype |
NA |
0 |
Low |
52429.5174 |
No |
30 |
7429 |
Wildtype |
NA |
0 |
Low |
52733.2198 |
No |
31 |
7373 |
Wildtype |
NA |
0 |
Low |
53396.9971 |
No |
32 |
7261 |
Wildtype |
NA |
0 |
Low |
54162.1353 |
No |
33 |
6010 |
Wildtype |
NA |
0 |
Low |
54341.1575 |
No |
34 |
7407 |
Wildtype |
NA |
0 |
Low |
54573.2791 |
No |
35 |
7392 |
Wildtype |
NA |
0 |
Low |
55223.3527 |
No |
36 |
7832 |
Wildtype |
NA |
0 |
Low |
56462.9173 |
No |
37 |
7427 |
Wildtype |
NA |
0 |
Low |
61582.7367 |
No |
38 |
7367 |
Wildtype |
NA |
0 |
Low |
61906.8592 |
No |
39 |
7395 |
Wildtype |
NA |
0 |
Low |
63655.5958 |
No |
40 |
5369 |
Wildtype |
NA |
0 |
Low |
64139.3305 |
No |
41 |
55565369 |
Wildtype |
NA |
0 |
Low |
65945.6815 |
No |
42 |
74405556 |
Wildtype |
NA |
0 |
Low |
66238.6672 |
No |
43 |
70857440 |
Wildtype |
NA |
0 |
Low |
73182.8255 |
No |
44 |
71837085 |
Wildtype |
NA |
0 |
Low |
77566.3146 |
No |
45 |
71837183 |
Wildtype |
NA |
0 |
Low |
77566.3146 |
No |
46 |
74117183 |
Wildtype |
NA |
0 |
Low |
85911.796 |
No |
47 |
60037411 |
Wildtype |
NA |
0 |
Low |
91717.6666 |
No |
48 |
73976003 |
Wildtype |
NA |
0 |
Low |
94650.3973 |
No |
49 |
74017397 |
Wildtype |
NA |
0 |
Low |
102414.7452 |
No |
50 |
40747401 |
Mutant |
p.E258D |
57.73 |
Low |
14600.1858 |
Yes |
51 |
6962 |
Mutant |
p.Y236C |
62.93 |
Low |
20903.5941 |
Yes |
52 |
5332 |
Mutant |
p.P151S |
64.12 |
Low |
20955.9877 |
Yes |
53 |
6225 |
Mutant |
p.E224D |
39.02 |
Low |
21525.3994 |
Yes |
54 |
4076 |
Mutant |
p.Q136P |
71.29 |
Low |
22118.8508 |
Yes |
55 |
5329 |
Mutant |
p.R273H |
66.12 |
Low |
22833.8745 |
Yes |
56 |
7245 |
Mutant |
p.R282W |
73.21 |
Low |
24809.4695 |
Yes |
57 |
5973 |
Mutant |
p.R282W |
73.21 |
Low |
25385.2785 |
Yes |
58 |
7424 |
Mutant |
p.E271V |
74.39 |
Low |
25942.2319 |
Yes |
59 |
7437 |
Mutant |
p.S106R |
21.82 |
Low |
27579.5418 |
Yes |
60 |
7423 |
Mutant |
p.A159V |
62.4 |
Low |
27604.2023 |
Yes |
61 |
6436 |
Mutant |
p.R273H |
66.12 |
Low |
31219.2933 |
Yes |
62 |
6962 |
Mutant |
p.Y236C |
62.93 |
Low |
35420.671 |
Yes |
63 |
6951 |
Mutant |
p.Y234C |
62.94 |
Low |
35732.5631 |
Yes |
64 |
7398 |
Mutant |
p.R337L |
61.55 |
Low |
36115.016 |
Yes |
65 |
4736 |
Mutant |
p.I195T |
72.13 |
Low |
37253.7068 |
No |
66 |
4740 |
Mutant |
p.M237I |
63.68 |
Low |
37284.3268 |
No |
67 |
6933 |
Mutant |
p.P151H |
71.97 |
Low |
38325.6981 |
No |
68 |
7238 |
Mutant |
p.R273H |
66.12 |
Low |
39422.9096 |
No |
69 |
7592 |
Mutant |
p.Y220C, p.R110L |
72.52, 28.14 |
Low |
39492.7307 |
No |
70 |
7630 |
Mutant |
p.139_142KTCP>T, p.M1V |
43.89 |
Low |
40807.4754 |
No |
71 |
5430 |
Mutant |
p.R282W, p.P89fs |
73.21, |
Low |
41157.1652 |
No |
72 |
7424 |
Mutant |
p.E271V |
74.39 |
Low |
41401.4767 |
No |
73 |
7437 |
Mutant |
p.S106R |
21.82 |
Low |
43367.2117 |
No |
74 |
4739 |
Mutant |
p.R337C |
63.66 |
Low |
44781.6908 |
No |
75 |
5151 |
Mutant |
p.V143M |
51.72 |
Low |
44811.7412 |
No |
76 |
4217 |
Mutant |
p.R158L |
57.61 |
Low |
44929.7646 |
No |
77 |
7238 |
Mutant |
p.R273H |
66.12 |
Low |
44945.2333 |
No |
78 |
5978 |
Mutant |
p.V172F |
65.55 |
Low |
45299.2832 |
No |
79 |
7414 |
Mutant |
p.E285K |
69.87 |
Low |
47003.5151 |
No |
80 |
7235 |
Mutant |
p.F270C, p.T211I |
66.32, 68.48 |
Low |
47573.0464 |
No |
81 |
6013 |
Mutant |
p.R282W |
73.21 |
Low |
48053.8936 |
No |
82 |
7374 |
Mutant |
p.R273H |
66.12 |
Low |
49671.3671 |
No |
83 |
7099 |
Mutant |
p.E285K |
69.87 |
Low |
49963.8243 |
No |
84 |
5434 |
Mutant |
p.Y236C, p.R213* |
62.93 |
Low |
53941.7304 |
No |
85 |
4737 |
Mutant |
p.H168L |
62.62 |
Low |
54291.7232 |
No |
86 |
7235 |
Mutant |
p.F270C, p.T211I |
66.32, 68.48 |
Low |
54443.1599 |
No |
87 |
5334 |
Mutant |
p.S166*, p.R158H |
43.94 |
Low |
55111.0587 |
No |
88 |
7089 |
Mutant |
p.Y163C |
70 |
Low |
60442.0202 |
No |
89 |
6933 |
Mutant |
p.P151H |
71.97 |
Low |
62108.8343 |
No |
90 |
7394 |
Mutant |
p.R273H |
66.12 |
Low |
64876.995 |
No |
91 |
5629 |
Mutant |
p.V157F |
55.26 |
Low |
66941.442 |
No |
92 |
7423 |
Mutant |
p.A159V |
62.4 |
Low |
67549.236 |
No |
93 |
5366 |
Mutant |
p.P151T |
70.26 |
Low |
71424.9734 |
No |
94 |
7435 |
Mutant |
p.Y220C |
72.52 |
Low |
72632.5124 |
No |
95 |
7380 |
Mutant |
p.R282W |
73.21 |
Low |
77702.8389 |
No |
96 |
7588 |
Mutant |
p.L137Q |
64.66 |
Low |
80069.0459 |
No |
97 |
4733 |
Mutant |
p.R273H |
66.12 |
Low |
80139.2593 |
No |
98 |
7236 |
Mutant |
p.V143M |
51.72 |
Low |
85991.952 |
No |
99 |
7365 |
Mutant |
p.V216M |
73.3 |
Low |
87008.6792 |
No |
100 |
6221 |
Mutant |
p.V272M |
63.49 |
Low |
98089.8266 |
No |
101 |
7245 |
Mutant |
p.R282W |
73.21 |
Low |
112385.1618 |
No |
102 |
7090 |
Mutant |
p.R273H |
66.12 |
Low |
128727.6925 |
No |
103 |
5370 |
Mutant |
p.R175H, p.Y126_splice |
78.51, |
High |
17991.2352 |
Yes |
104 |
6023 |
Mutant |
p.G245S |
86.45 |
High |
20435.1948 |
Yes |
105 |
7178 |
Mutant |
p.C176Y, p.R110L |
93.11, 28.14 |
High |
22902.4691 |
Yes |
106 |
5152 |
Mutant |
p.G245S |
86.45 |
High |
24189.1074 |
Yes |
107 |
6943 |
Mutant |
p.R248W |
84.11 |
High |
24203.8835 |
Yes |
108 |
7065 |
Mutant |
p.H179P |
98.89 |
High |
24548.4018 |
Yes |
109 |
6934 |
Mutant |
p.Y205C |
77.88 |
High |
24737.1678 |
Yes |
110 |
7242 |
Mutant |
p.V173M |
75.53 |
High |
25359.3433 |
Yes |
111 |
7254 |
Mutant |
p.E258A |
93.29 |
High |
26404.9051 |
Yes |
112 |
6959 |
Mutant |
p.R248W |
84.11 |
High |
26977.7238 |
Yes |
113 |
7418 |
Mutant |
p.H179Y |
77.78 |
High |
29714.3994 |
Yes |
114 |
7370 |
Mutant |
p.C238S |
86.53 |
High |
31748.1805 |
Yes |
115 |
6869 |
Mutant |
p.C238F, p.R156P |
96.54, 42.93 |
High |
31750.7152 |
Yes |
116 |
7399 |
Mutant |
p.P278S, p.R213L |
84.34, 90.71 |
High |
33442.556 |
Yes |
117 |
7082 |
Mutant |
p.R248W |
84.11 |
High |
34283.7838 |
Yes |
118 |
6936 |
Mutant |
p.V173L |
82.64 |
High |
34347.8836 |
Yes |
119 |
6935 |
Mutant |
p.C242S |
86.74 |
High |
34914.732 |
Yes |
120 |
7848 |
Mutant |
p.E286V, p.P58fs |
94.09 |
High |
35968.0861 |
Yes |
121 |
7413 |
Mutant |
p.G105C |
90.8 |
High |
36065.8762 |
Yes |
122 |
7263 |
Mutant |
p.Y126C |
81.09 |
High |
36794.0111 |
Yes |
123 |
5558 |
Mutant |
p.R282W, p.R175H |
73.21, 78.51 |
High |
39755.88 |
No |
124 |
6992 |
Mutant |
p.Q331H, p.R249M, p.G245D |
9.79, 95.41, 89.56 |
High |
40108.2414 |
No |
125 |
6870 |
Mutant |
p.C242Y |
93.46 |
High |
40158.9134 |
No |
126 |
5444 |
Mutant |
p.R248Q, p.G245S |
78.95, 86.45 |
High |
40765.04 |
No |
127 |
6936 |
Mutant |
p.V173L |
82.64 |
High |
41410.0741 |
No |
128 |
7242 |
Mutant |
p.V173M |
75.53 |
High |
41666.9217 |
No |
129 |
7248 |
Mutant |
p.C242F |
97.04 |
High |
43282.1983 |
No |
130 |
6945 |
Mutant |
p.H193L |
95.4 |
High |
43425.0326 |
No |
131 |
5431 |
Mutant |
p.H193P, p.H179Y |
92.46, 77.78 |
High |
43788.9126 |
No |
132 |
4725 |
Mutant |
p.C275F |
97.06 |
High |
44576.836 |
No |
133 |
6872 |
Mutant |
p.R175H |
78.51 |
High |
45312.0393 |
No |
134 |
6493 |
Mutant |
p.C229fs, p.S127Y |
87.62 |
High |
45516.3524 |
No |
135 |
7371 |
Mutant |
p.R175H |
78.51 |
High |
45522.7596 |
No |
136 |
5373 |
Mutant |
p.G245V |
98.74 |
High |
45758.6207 |
No |
137 |
7402 |
Mutant |
p.R267P |
88.48 |
High |
45787.4794 |
No |
138 |
6824 |
Mutant |
p.K132N |
92.16 |
High |
45810.6559 |
No |
139 |
6478 |
Mutant |
p.H179R |
81.91 |
High |
45909.8192 |
No |
140 |
7368 |
Mutant |
p.R248Q |
78.95 |
High |
46323.4255 |
No |
141 |
6935 |
Mutant |
p.C242S |
86.74 |
High |
46893.4093 |
No |
142 |
5331 |
Mutant |
p.A307_splice, p.R280T |
96.08 |
High |
47291.6078 |
No |
143 |
7416 |
Mutant |
p.R248Q |
78.95 |
High |
47571.3318 |
No |
144 |
7415 |
Mutant |
p.M133K |
93.62 |
High |
47578.0949 |
No |
145 |
4729 |
Mutant |
p.H179R, p.V157F |
81.91, 55.26 |
High |
48687.3857 |
No |
146 |
5966 |
Mutant |
p.V173M |
75.53 |
High |
49092.3772 |
No |
147 |
6218 |
Mutant |
p.V218G, p.L194fs |
89.92 |
High |
49304.6974 |
No |
148 |
7388 |
Mutant |
p.R273C |
84.52 |
High |
49483.4242 |
No |
149 |
7379 |
Mutant |
p.G262V, p.Q136H |
88.02, 47.50 |
High |
49736.8282 |
No |
150 |
6952 |
Mutant |
p.C275F |
97.06 |
High |
49779.8418 |
No |
151 |
5631 |
Mutant |
p.E336*, p.G245S |
86.45 |
High |
50265.4975 |
No |
152 |
6012 |
Mutant |
p.Y126S |
94.81 |
High |
50330.1475 |
No |
153 |
6020 |
Mutant |
p.C176S |
86.9 |
High |
51044.6781 |
No |
154 |
4723 |
Mutant |
p.C242F |
97.04 |
High |
52741.6378 |
No |
155 |
7376 |
Mutant |
p.R280S, p.L32_splice |
94.74 |
High |
52830.2812 |
No |
156 |
5436 |
Mutant |
p.G266E, p.E56* |
93.08 |
High |
53609.38 |
No |
157 |
6024 |
Mutant |
p.L265R |
84.18 |
High |
54654.3939 |
No |
158 |
7416 |
Mutant |
p.R248Q |
78.95 |
High |
55950.4367 |
No |
159 |
7372 |
Mutant |
p.R248W |
84.11 |
High |
56103.6943 |
No |
160 |
7219 |
Mutant |
p.R196P |
95.55 |
High |
59325.7308 |
No |
161 |
6011 |
Mutant |
p.P278S, p.Y205fs |
84.34 |
High |
59562.9966 |
No |
162 |
5365 |
Mutant |
p.H193L |
95.4 |
High |
59633.7932 |
No |
163 |
6491 |
Mutant |
p.M237V, p.H179R |
75.79, 81.91 |
High |
61669.9501 |
No |
164 |
6516 |
Mutant |
p.G262V |
88.02 |
High |
61964.9147 |
No |
165 |
6022 |
Mutant |
p.S261_splice, p.R248W |
84.11 |
High |
62102.963 |
No |
166 |
4738 |
Mutant |
p.Q331*, p.H179Y |
77.78 |
High |
62189.1787 |
No |
167 |
6220 |
Mutant |
p.R280G |
95.71 |
High |
62341.3455 |
No |
168 |
5367 |
Mutant |
p.R273C, p.A161T |
84.52, 58.51 |
High |
62735.4238 |
No |
169 |
7178 |
Mutant |
p.C176Y, p.R110L |
93.11, 28.14 |
High |
64539.6273 |
No |
170 |
7229 |
Mutant |
p.R249S |
93.65 |
High |
65436.9925 |
No |
171 |
5976 |
Mutant |
p.Y236D |
92.17 |
High |
70703.2873 |
No |
172 |
6018 |
Mutant |
p.R248W |
84.11 |
High |
70937.0085 |
No |
173 |
5970 |
Mutant |
p.R248Q |
78.95 |
High |
75136.8374 |
No |
174 |
5330 |
Mutant |
p.G266R |
91.41 |
High |
77750.4254 |
No |
175 |
6517 |
Mutant |
p.S127F |
88.07 |
High |
83366.1651 |
No |
176 |
6943 |
Mutant |
p.R248W |
84.11 |
High |
83366.6878 |
No |
177 |
7102 |
Mutant |
p.G266E |
93.08 |
High |
84155.9398 |
No |
178 |
7421 |
Mutant |
p.R175H |
78.51 |
High |
84446.3616 |
No |
179 |
5979 |
Mutant |
p.R248Q |
78.95 |
High |
84769.3762 |
No |
180 |
6994 |
Mutant |
p.R283P, p.R175H |
75.75, 78.51 |
High |
85123.8984 |
No |
181 |
6934 |
Mutant |
p.Y205C |
77.88 |
High |
85532.0304 |
No |
182 |
6224 |
Mutant |
p.R175H |
78.51 |
High |
86128.7828 |
No |
183 |
6959 |
Mutant |
p.R248W |
84.11 |
High |
86287.8985 |
No |
184 |
6873 |
Mutant |
p.H193L, p.PHHERC177del |
95.4 |
High |
87361.6071 |
No |
185 |
6016 |
Mutant |
p.G245S |
86.45 |
High |
89802.686 |
No |
186 |
6826 |
Mutant |
p.V173G |
93.47 |
High |
95987.892 |
No |
187 |
6868 |
Mutant |
p.L194P |
79.72 |
High |
98740.1575 |
No |
188 |
5555 |
Mutant |
p.H193R |
85.96 |
High |
103716.6397 |
No |
189 |
7389 |
Mutant |
p.P278S |
84.34 |
High |
104961.0553 |
No |
190 |
5326 |
Mutant |
p.R249S, p.L32_splice |
93.65 |
High |
107124.1051 |
No |
191 |
7753 |
Mutant |
p.E286K |
76.21 |
High |
118776.7221 |
No |
192 |
6474 |
Mutant |
p.G245V |
98.74 |
High |
152088.3031 |
No |
a. The number of patients included in the analysis
b. The short ID extracted from The Cancer Genome Atlas Head and Neck Project
c. P53 status delineated as either wildtype or mutant
d. Denotes the specific mutation for each patient, wildtype is delineated as NA
e. Evolutionary Action score from 0-100 with higher scores representing more deleterious mutations. Wildtype p53 (wtp53) sequences were scored as zero since this is the normally functioning protein.
f. Evolutionary Action Risk was determined as previously described but a score greater than 77.78 was consider high-risk [12].
g. Level of MYH9 expression extracted from The Cancer Genome Atlas Head and Neck Project RNA seq data
h. Low MYH9 expression was defined as the lower 25th percentile while high MYH9 expression was defined as greater the 25th percentile.
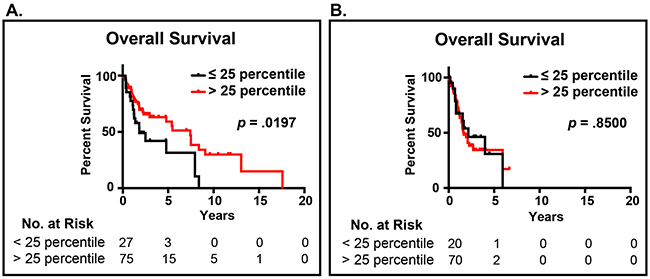
Figure 1: Impact of MYH9 expression and p53 mutational status. A. Patients with low-risk (functional) p53 mutations and MYH9 expression in the lower quartile (<25%) have decreased survival relative to patients with high MYH9 expression (>25%). B. The expression level of MYH9 did not impact the survival of patients with high-risk (oncogenic) p53 mutations.
P53 function is dependent upon a functional NMIIA
Using the isogenic HNSCC cell lines, HN30 and HN31, which endogenously express either wtp53 (HN30) or missense p53 mutations, C176F and A161S, (HN31), HN30 was shown to upregulate expression of downstream p53 targets CDKN1A (p21) and MDM2 following treatment with nutlin-3; which inhibits the interaction between mdm2 and wild type p53, therefore stabilizing and leading to increased levels of the p53 protein. This target gene upregulation is not observed with the mutp53 cell line, HN31 (Figure 2A). NMIIA has been shown to be essential for nuclear retention of activated p53 therefore to determine the impact of NMIIA function on the upregulation of target gene expression observed in the wtp53 cells, the selective, small molecule NMIIA ATPase inhibitor, blebbistatin was applied prior to activation of p53 with nutlin-3. NMIIA inhibition led to a significant reduction in expression of target genes p21 (p=.02) and MDM2 (p=.04) in wtp53, HN30 cells, which was not observed in HN31 cells harboring high-risk mutations (Figure 2A). Inhibiting the nuclear export transporter Crm1 restored target gene expression in wtp53 expressing cells, which was not observed in high-risk mutp53 (Figure 2B). Taken together this data implies with NMIIA is defective, wtp53 cannot activate target genes because of an inability to accumulate within the nucleus.
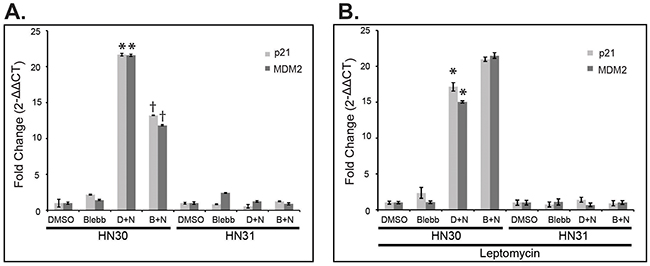
Figure 2: NMIIA is necessary for wtp53 function, which is lost in high-risk mutp53. A. After treatment with DMSO, blebbistatin, or a combination of DMSO + nutlin (D+N) or blebbistatin + nutlin (B+N), qRT-PCR revealed the induction of p53 target genes p21 (p = 0.02) and MDM2 (p = 0.04) were significantly reduced following blebbistatin treatment in HN30 cells but not in HN31 cells. B. Inhibition of Crm1 nuclear exporter with Leptomycin B rescued p53 target gene expression in HN30 cells. Data expressed as means ± standard deviation; n=3. * p<0.05 reduction in p21 and MDM2 expression following blebbistatin treatment.
In an effort to directly assess the impact of NMIIA function on cell invasion, a CMV-GFP-NMII-A plasmid was stably overexpressed in HN30 and HN31 cell lines resulting in a ~50% increase in NMIIA expression in both cell lines (Figure 3) [19]. Even this modest (<2 fold) NMIIA overexpression preferentially decreased invasion in cells harboring wtp53 (p=.02) which was not observed in the mutp53 cells (Figure 4A). In contrast, inhibition of NMIIA led to an increase in cellular invasion in wtp53 expressing HN30 cells (p=.001) but not high-risk mutp53 HN31 cells (Figure 4B). Taken together this data suggests the function of wildtype p53 as a transcription factor and regulating cell invasion is dependent on a functional NMIIA.
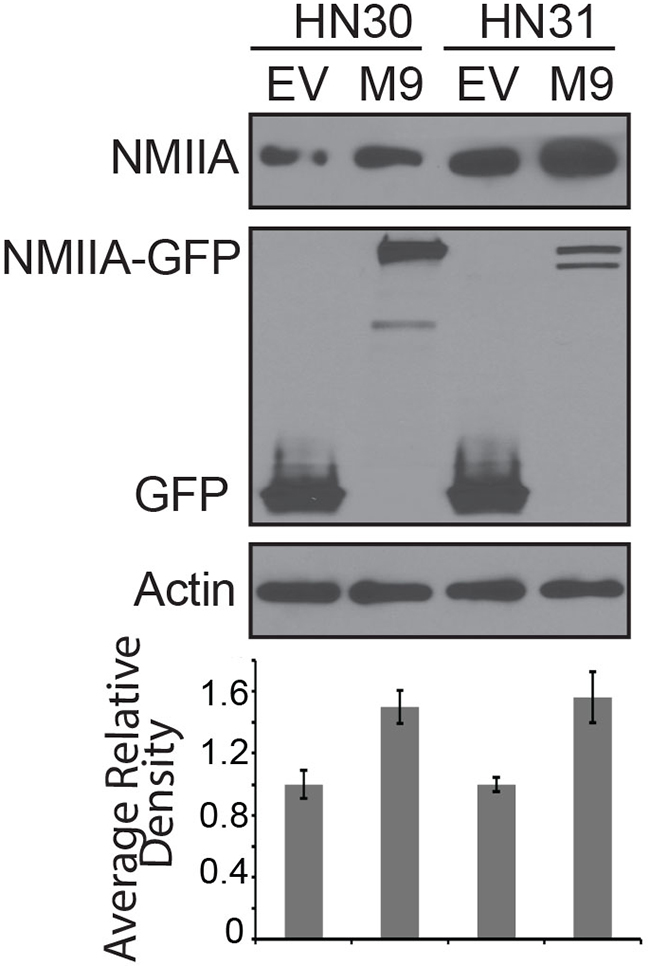
Figure 3: Western blot of cell lines stably expressing EGFP-NMIIA construct. The histogram represents average relative density of NMIIA protein expression compared to actin loading controls and is the results of three independent experiments. EV:empty vector; M9:EGFP-NMIIA vector.
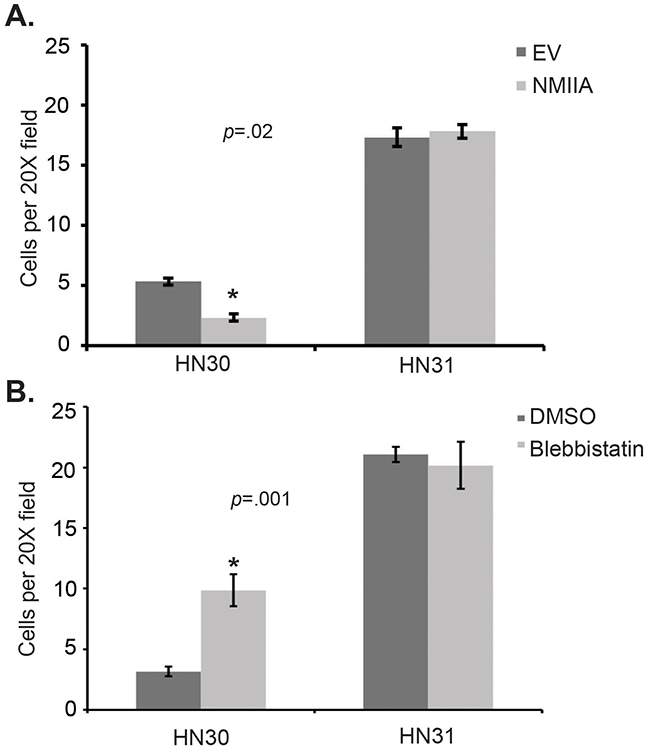
Figure 4: Modulation of NMIIA expression or function alters wtp53 expressing cell invasion. A. Forced NMIIA expression significantly reduced invasion in HN30 (wtp53) but not HN31 (high-risk mutp53) cells relative to vector controls, p=0.02.EV: empty vector control. B. NMIIA inhibition significantly increased invasion in HN30 but not HN31 cells, p=0.001.
Inhibition of NMIIA alters wtp53 but not mutp53 function and cellular localization
Differences in NMIIA’s effect on wtp53 vs. mutp53 remain unknown [17]. To determine if the selective effect of NMIIA on wtp53 is due to its role in nuclear retention of activated wtp53 but not mutp53, cell fractionation was utilized. The initial fractionation experiment isolated insoluble cellular components (nuclear and cytoskeletal) from soluble cellular components (cytosol). As shown in Figure 5A (red boxed lane) following a dual nutlin-3 / blebbistatin treatment a decrease in nuclear / cytoskeletal expression of wtp53 and reduced induction of p21 was observed. The same treatment in mutp53 cells had no effect on the nuclear / cytoskeletal fraction of p53 or target gene induction (Figure 5). To assess if NMIIA specifically effects the nuclear retention of wtp53, the nuclear export receptor Crm1 was inhibited which resulted in the restoration of p53 nuclear accumulation (Figure 5B, boxed blue lane). To validate these findings a second fractionation protocol was utilized that specifically extracts the nuclear fraction from the cytoskeletal and cytoplasmic fractions. As seen in Supplementary Figure 1, inhibition of NMIIA following nutlin treatment significantly reduced the nuclear accumulation of wtp53 and p21 induction (Supplementary Figure 1). Furthermore, this decrease in nuclear p21 induction following combined nutlin-3 / blebbistatin treatement inhibition was associated with an significant increase in cytosolic p21 induction (Supplementary Figure 1). To confirm these findings immunofluorescent staining of intact cells following nutlin-3 treatment was performed. As shown in Figure 6, we observed a significant increase in co-localization of wtp53 and NMIIA in HN30 cells following nutlin treatment (p<.001) as determined by Pearson’s correlation coefficient (Figure 6B) and depicted by the yellow staining in the representative confocal images of nutlin treated HN30 cells (Figure 6A). Furthermore, in blebbistatin treated cells co-localization of wtp53 and NMIIA was attenuated. To determine if the wtp53 / NMIIA co-localization was occurring within the nucleus, the relative fluorescence for individual cells was determined and the average fluorescence for p53 and NMIIA was quantified in the cytoplasm and nucleus (2 and 7 microns from the cell membrane edge respectively (Figure 6A). Additionally orthogonal images were constructed from Z stack image capture through the depth of each cell. These analyses revealed that following nutlin-3 treatment, wtp53 and NMIIA appear to co-localize within the nucleus, which is attenuated following blebbistatin treatment supporting the finding that nuclear retention of wtp53 requires a functional NMIIA (Figure 6A and 6B column B+N). While co-localizatiohn of NMIIA and mutp53 was also observed it appeared to be independent of p53 and NMIIA activity given that treatment with either nutlin-3 or blebbistatin did not alter their co-localization.
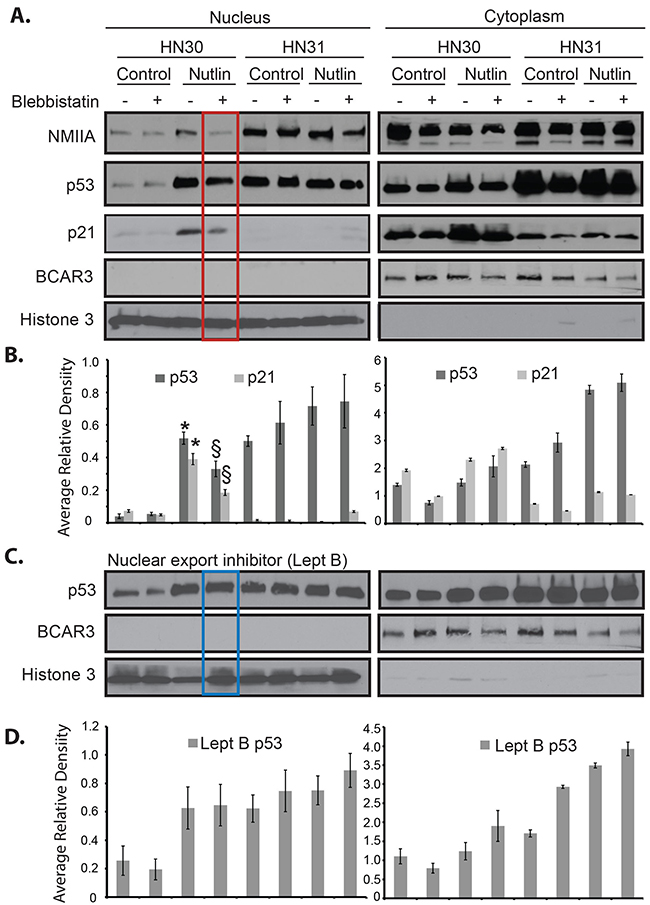
Figure 5: Inhibition of NMIIA alters wtp53 but not high-risk mutp53 cellular localization. A. Nutlin-induced nuclear / cytoskeletal p53 and p21 was detected in HN30 (wtp53) cells. Blebbistatin treatment attenuated the effect of nutlin on nuclear p53 and p21 induction (red box). B. Average relative density in the nuclear / cytoskeletal and cytosolic fractions normalized the level of p53 and p21 to Lamin B and BCAR3 respectively. This revealed a significant increase in p53 and p21 after nutlin treatment relative to control (* p=.010), along with a significant decrease in p53 and p21 after blebbistatin relative to control (§ p=.032). C. Nuclear accumulation of p53 was restored by leptomycin B (Lept B) treatment. D. Average relative density in the nuclear / cytoskeletal and cytosolic fractions normalized the level of p53 to Lamin B and BCAR3 respectively. The expression levels of p53 in HN31 (mutp53) cells was unaffected by nutlin, blebbistatin, or leptomycin B treatment. The histograms represent the cumulative results of three independent experiments.
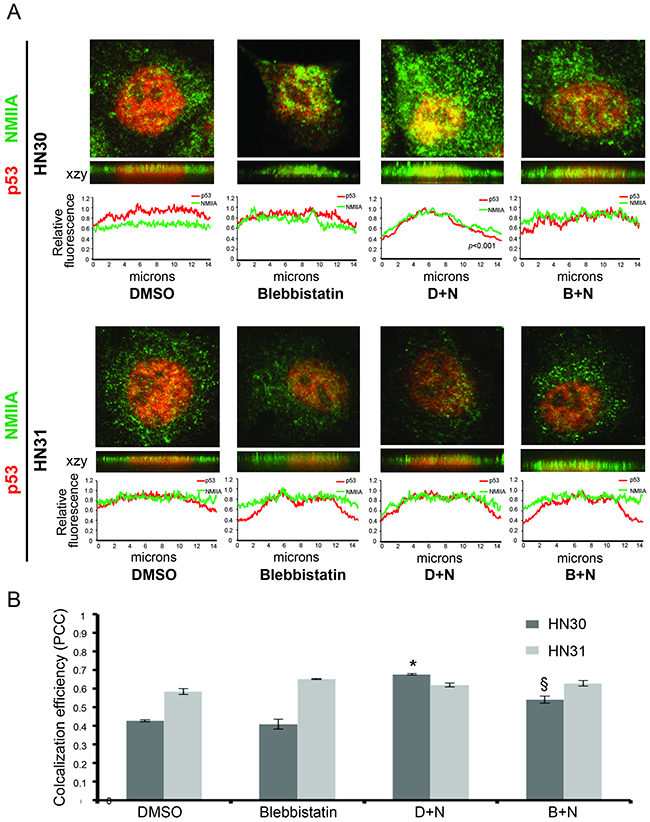
Figure 6: NMIIA co-localization with wtp53 is attenuated following NMIIA inhibition. A. Representative confocal fluorescence images including Z stack generated orthogonal views (xzy) showed the colocalization of wtp53 and NMIIA in HN30 cells not seen in high-risk HN31 cells (mutp53). The relative immunofluorescence profile revealed a significant increase in nuclear colocalization of p53 / NMIIA following nutlin treatment (p<0.001) which is attenuated following NMIIA inhibition. B. Data summary shows colocalization efficiency of NMIIA and p53. Nutlin treatment (D+N) caused a significant increase in colocalization in HN30 (p<0.001) but not HN31 (p=0.179) cells. There was a significant reduction in colocalization in HN30 cells following blebbistatin treatment (B+N) not observed in HN31 cells (p=0.019 vs .25). Data expressed as means +/- SEM; n=3. * p<.05 versus DMSO control group; § p<0.05 (DMSO + nutlin versus blebbistatin + nutlin). D+N, DMSO +nutlin; B+N, blebbistatin + nutlin.
To confirm the nuclear co-localization of wtp53 and NMIIA, cell fractionation followed by direct co-immunoprecipitation from these fractions was performed. This approach revealed an increase in wtp53/NMIIA association in the nuclear / cytoskeletal fraction along with a concomitant decrease in cytosolic interaction following nutlin treatment (Figure 7 blue box lanes). The nuclear / cytoskeletal association of wtp53 / NMIIA was reduced in cells treated with blebbistatin (Figure 7 red boxed lane). As observed by immunofluorescence microscopy, there appears to be an association of mutp53 / NMIIA based on co-immunoprecipitation, but this interaction remained at basal levels following addition of nutlin and/or combined treatment with blebbistatin.
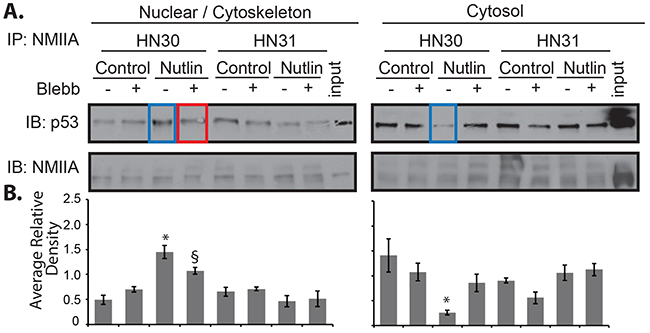
Figure 7: NMIIA exhibits increased interaction with wtp53 in the nucleus. HN30 and HN31 cells were treated with blebbistatin (Blebb) or control (PBS) followed by nutlin for 8 h. Cells were fractionated followed by co-immunoprecipitation:immunoblot analysis of NMIIA and p53. A. Following p53 activation with nutlin there was a significant increase in association between wtp53 / NMIIA in the nuclear / cytoskeletal fraction of HN30 cells and a concomitant decrease in association in the cytosolic fraction, p<.001 and 0.01, respectively (Blue highlight). The increased association in the nuclear / cytoskeletal fraction was significantly reduced by blebbistatin, p=0.02 (Red highlight). Neither nutlin or blebbistatin treatment had an effect on the nuclear / cytoskeletal or cytosolic mutp53/NMIIA interaction. B. Average relative density normalizes the level p53 to NMIIA. The histograms represent the results of three independent experiments. * Significant change in interaction after nutlin treatment relative to control. § Significant decrease in p53/NMIIA interaction after blebbistatin relative to nutlin.
DISCUSSION
TP53 is the most frequently mutated gene in HNSCC occurring in more than 70% of cases that are non-human papilloma virus related [18, 20, 21]. Whereas most alterations involving tumor suppressor genes render them nonfunctional through truncation or deletions, p53 is unique in that there is a strong selection bias for missense mutations, particularly within its DNA-binding domain. P53 mutation can result in loss of wild type functions (LOF), which are considered low-risk, through loss of DNA-binding activity to p53 responsive elements or a dominant negative effect where the mutated allele binds and inhibits the remaining functional wild-type allele [22]. Moreover, some mutp53 display oncogenic properties, termed “gain of function” (GOF) or high-risk mutations, which are independent of the loss of wild-type p53 function [23]. Accordingly, GOF p53 mutants can enhance cell transformation, increase tumor formation in mice and confer cellular resistance to chemotherapy [24, 25]. We previously developed and validated a novel method, EAp53 that stratifies patients with tumors harboring TP53 mutations as high or low risk. Although the underlying mechanisms responsible for high-risk mutp53 remain unresolved, a potential mechanism involves interaction with NMIIA. In addition to the critical role NMIIA has in cell contractility and migration, it also functions as a tumor suppressor through regulation of p53 stability and nuclear retention [15-17, 26]. Despite this novel finding, there continues to be a significant gap in the understanding of the impact of NMIIA on mutp53 and its ability to function as a tumor suppressor and/or contribute to the oncogenic phenotype of p53. Given this lack of understanding, the objective of this study was to correlate the tumor suppressor effects of p53 with NMIIA function and demonstrate NMIIA dysfunction in cells harboring wildtype p53 results in characteristics resembling high-risk mutp53 including increased invasion. We hypothesized that the tumor suppressor capability of p53 is dependent on NMIIA function, which when abrogated leads to an oncogenic phenotype of p53 that is similar to high-risk mutp53.
Our results show patients stratified by EAp53 with low-risk mutp53 had a decreased overall survival with low MYH9 expression relative to those patients with low-risk mutp53 and high MYH9 expression. In contrast, the relative expression of MYH9 did not impact survival in patients with high-risk mutp53. Our previous work demonstrated low-risk TP53 mutations appear to retain some residual wildtype TP53 function as demonstrated by an intermediate level of activation of downstream p53 target genes following treatment with cisplatin [27]. Furthermore, this intermediate activation was associated with decreased cell migration and tumor growth in animal models [12]. Taken together, these data indicate that the tumor suppressive capability of NMIIA appears to be confined to tumor cells with functional TP53.
In addition to identifying the potential prognostic significance of MYH9 expression in low-risk mutp53 disease, we demonstrated inhibition of NMIIA leads to increased invasion in wtp53 expressing cells but not in high-risk mutp53 expressing cells. Furthermore, overexpression of NMIIA reduced invasion only in cells expressing wildtype p53. These findings corroborate a previous study and support our hypothesis that the tumor suppressor capability of p53 is dependent on NMIIA function [17]. This hypothesis is further supported by the finding of reduced p53 target gene expression in wildtype p53 cells following NMIIA inhibition, which was not observed in high-risk mutp53. The ability of wildtype p53 to activate downstream target genes appears to be dependent on nuclear localization of p53 as the reduction of target gene expression following NMIIA inhibition could be reversed with nuclear export inhibition. Furthermore, cell fractionation studies revealed induction of p53 and p21 in the nuclear fraction by nutlin treatment of wtp53 cells can be attenuated with blebbistatin treatment. The decrease in nuclear p21 induction was associated with a concomitant increase in the cytosolic p21 level which has been associated with increased cell survival and proliferation [28] This reduction in p53 induction in wtp53 cells with inhibition of the NMIIA ATPase can be reversed with Crm1 inhibition, which supports published data [17]. In contrast, inhibition of NMIIA did not alter expression of p21 or MDM2 in mutp53 cells or retention of mutp53 within the nucleus.
These findings are supported by immunofluorescence microscopy demonstrating an increase in the co-localization of wtp53 and NMIIA following nutlin treatment, which was subsequently reduced by NMIIA inhibition. Colocalization was predominantly nuclear as demonstrated by the Z stack generated orthogonal views and the relative cellular immunofluorescence, which was confirmed by cell fractionation:immmunoprecipitation findings. Although mutp53 and NMIIA appeared to co-localize, this was independent of NMIIA ATPase activity and was observed diffusely throughout the cell based on microscopy and supported by cell fractionation data.
In conclusion, the current findings indicate that cells expressing wtp53 are dependent on NMIIA inhibition to become pro-invasive secondary to decreased nuclear accumulation of wtp53 and subsequent reduction in target gene expression. In contrast, cells harboring high-risk mutp53 attain an invasive phenotype independent of NMIIA.
MATERIALS AND METHODS
Patient data
Patient dataset from The Cancer Genome Atlas HNSCC Project that had human papilloma virus (HPV)-negative tumors (n=192) were identified and EAp53 was applied to the p53 sequence data [12, 18]. MYH9 RNAseq expression data from The Cancer Genome Atlas Network Head and Neck Project was subsequently integrated with the p53 sequence data. MYH9 expression less than or equal to the lower quartile (≤25 percentile) for the entire cohort was considered to be low expression while expression greater than the lower quartile (>25 quartile) was considered to be high expression (Table 1). Overall survival data was extracted from TCGA HNSCC Supplementary Data. Curves describing overall survival were generated by the Kaplan-Meier method. The statistical significance of differences between the actuarial curves were assessed by the log rank test. Overall survival was measured from the date of diagnosis of recurrent disease to the date of death or last contact. Statistical analyses were performed using GraphPad Prism 7.0e (GraphPad Software, Inc., La Jolla, CA) statistical software.
Cell culture
The isogenic HNSCC cell lines HN30 and HN31 (provided by Dr. John Ensley; Wayne State University) were chosen as they were derived from a pharyngeal primary tumor and lymph node from the same patient. HN30 harbours a wtp53 while HN31 harbours two p53 mutations, C176F (high-risk) and A161S (low-risk). HN30 and HN31 cells were grown in DMEM with high glucose containing 10% FBS, 0.5% penicillin and streptomycin, 2 mM L-glutamine, 1 mM Sodium pyruvate, 85 mg/mL NaCl, 1 mg/mL D-calcium pantothenate, 1 mg/mL choline chloride, 1 mg/mL folic acid, 2 mg/mL i-inositol, 1 mg/mL niacinamide, 1 mg/mL pyridoxine- HCl, 0.1 mg/mL riboflavin, 1 mg/mL thiamine - HCl and non essential amino acids including 0.1 mM glycine, 0.1 mM alanine, 0.1 mM asparagine, 0.1 mM aspartic acid, 0.1 mM glutamic acid, 0.1 mM proline, 0.1 mM serine. The cells were maintained in a 37°C incubator with 95% air and 5% CO2
Drug incubation
HN30 and HN31 cells were growth arrested in serum-free medium for 24 hrs prior to drug treatment. Cells were pretreated with DMSO or 25 μM blebbistatin (Cayman Chemicals 674289-55-5) for 30 min prior to 8 hrs of treatment with 5 μM of nutlin-3 (Sigma-Aldrich N6287). For some Western blot analyses, (where indicated), 20 nM of leptomycin (Cayman Chemical 87081-35-4) was added 30 min prior to pretreatment of cells with DMSO or blebbistatin.
qRT-PCR
RNA was prepared from HN30 and HN31 cells using High Pure RNA Isolation Kit (Roche Diagnostics). cDNA was synthesized from RNA using iScript cDNA Syntheis Kit (Bio-Rad). The amplified cDNA was used in quantitative real-time PCR using SYBR Green PCR Master Mix (Applied Biosytems). The primer pairs used for analyzing p21, MDM2, and GAPDH were previously published [27]. The primer pairs used were as followed: p21 forward 5′-CGCTAATGGCGGGCTG-3′, reverse 5′-CGGTGACAAAGTCGAAGTTCC-3′; MDM2 forward 5′-ACCTCACAGATTCCAGCTTCG-3′, reverse 5′-TTTCATAGTATAAGTGTCTTTTT-3′; GAPDH forward 5’-TGATGGTACATGACAAGGTGC-3’, GA PDH reverse 5’-ACAGTCCATGCCATCACTGC-3’.
Generation of stable cell lines
For stable transfections, HN30 and HN31 cells were cultured in 6-well plates until they reached 70-80% confluency. The cells were transfected with CMV-GFP-NMHC II-A (Addgene plasmid # 11347) using 6 μg of using NanoJuice Transfection Reagent in serum-free medium (Novagen) according to the manufacturer’s protocol [19]. HN30 and HN31 cells were cultured for 7-14 days in 400 μg/ml of geneticin before being sorted for selection of stable clones.
Invasion assay
After stably transfecting HN30 and HN31 cells with vectors, invasion studies were conducted using Corning BioCoat Matrigel Invasion Chambers as described by the manufacturer (Corning). Cells were seeded in Matrigel Basement Membrane Matrix inserts in 24-well plates at a density of 2.5x10⁴ cells per well. After 22 hr in a 37°C incubator, cells were fixed with 3% formalin and stained with silver stain. Membranes were washed and allowed to dry before an image was obtained and the number of invaded cells quantified. For studies that involved drug incubation, HN30 and HN31 cells were plated at a density of 2.5x10⁴ cells in medium containing either DMSO or 25 μM of Blebbistatin.
Cell fractionation and western blot analysis
For Western blot analysis, HN30 and HN31 cells were grown in 100 mm tissue culture dishes. After treatment with the various drugs described, cells were rinsed and then lysed in cytosolic fractionation buffer (5 mM of EDTA, 1 mM of dithiothreitol, 1% Triton X-100 in PBS) supplemented with protease inhibitors (1 mM phenylmethylsulfonyl fluoride, 1 mM NaF, 1 mM Na3VO3, 1 μg/ml leupeptin, 1 μg/ml aprotinin, and 1 μg/ml pepstatin). After brief centrifugation the supernatants were collected as the cytosolic extract and the pellets were washed and resuspended in nuclear extraction buffer (20 mM of TRIS-HCl, 1% SDS, 5 mM EGTA, 0.5% Triton X-100, 150 mM of NaCl) supplemented with protease inhibitors.
An alternative fractionation protocol was used where after treatment with the various drugs as described, nuclear and cytoplasmic extracts were prepared using the NE-PER Nuclear and Cytoplasmic Extraction Reagents Kit from ThermoFisher Scientific (Catalog #: 78833). Equal amounts of protein sample were loaded per lane on Mini-PROTEAN TGX Precast Gels (Bio-RAD) which were transferred to nitrocellulose membranes following electrophoresis. Blots were incubated with primary antibodies to p53 (Santa Cruz Biotechnology sc-126), p21 (EMD Millipore OP64), NMIIA (Santa Cruz Biotechnology sc-98978), BCAR3 (Bethly Laboratories A301-671A), Lamin B (Santa Cruz sc-6216), GFP (Cell Signaling 2956S), actin (Millipore MAB1501) and subsequently reacted with the corresponding secondary antibodies. All secondary antibodies were horseradish peroxidase conjugates. Blots were developed by Enhanced Chemiluminescence Kit (Thermo Scientific) before exposure to X-ray film. Densitometry was performed using FIJI/Image J software and paired t-tests compared the relative intensities using Microsoft Excel (Microsoft Corp, Redmond, WA) [29].
Immunoprecipitation
For NMIIA immunoprecipitation, HN30 and HN31 cells grown in 100 mm tissue culture dishes were fractionated as described above equal amounts of nuclear and cytoplasmic proteins were pre-cleared by incubation with protein A/G Sepharose beads for 30 min at 4°C. After brief centrifugation, supernatants were removed and incubated with anti-Myosin 9 antibody (Santa Cruz Biotechnologies sc-98978) overnight. Immunoprecipitates were captured with 60 μl of protein A/G beads at 4°C for 3 hr. Samples were centrifuged and washed three-fold with PBS and proteins were eluted from the beads using 2x Laemmli buffer, boiled for 5 min, and resolved by SDS-PAGE and subsequent immunoblot analysis with mouse monoclonal antibodies for p53 (Santa Cruz Biotechnologies sc-126) and Myosin 9 (Millipore MABT164). Densitometry and statistical analysis were performed as described above.
Immunofluorescence microscopy
Following the drug treatments described above, cells were fixed with 4% paraformaldehyde for 10 min at room temperature, permeabilized with 0.5% Triton X-100 (Sigma) in PBS for 5 min and non-specific binding sites were blocked with 1% BSA in PBS for 1h. Primary and secondary antibodies were diluted in blocking solution as directed by the manufacturer. Antibodies employed were anti-p53 (1:500; Santa Cruz Biotechnology), anti-NMIIA (1:500; Santa Cruz Biotechnology), anti-rabbit Alexa Flour 488 (Life Technologies) anti-mouse Alexa Fluor 546 (Molecular Probes). Confocal microscopy was performed using an Olympus FV10i laser scanning confocal microscope (Olympus, Tokyo, Japan). Colocalization of NMIIA and p53 was analyzed by FIJI/Image J software with the coloq2 plugin [29]. The plot profile for 8 cells per condition was determined and the mean was relative immunofluorescence was calculated. The average cell diameter was estimated to be 14 microns, there the relative immunofluorescence within the cytoplasm and nucleus was measured 2 and 7 microns from the cell membrane respectively. The average relative immunofluorescence following various treatments within the nucleus and cytoplasm was compared using a paired T-test. The summarized colocalization efficiency data were expressed as Pearson correlation coefficients as previously described [30].
ACKNOWLEDGMENTS
We wish to acknowledge the services of the Cell and Molecular Imaging Shared Resource - with a special thanks to Jennifer Bestman for immunofluorescence image acquisition and data analyses, Biostatistics Shared Resource and the Flow Cytometry and Cell Sorting Shared Resource, Hollings Cancer Center (supported by P30 CA 138313).
CONFLICTS OF INTEREST
None.
FUNDING
This work was supported by the K12 Paul Calebresi Clinical and Translational Oncology Training Program K12 CA157688 (DMN), NIDCR K08 DE026542-01 (DMN), the American Cancer Society Institutional Research Grant IRG-97-291-14 (DMN), and NCI R01 CA 134845 (SAR).
REFERENCES
1. Society AC. (2015). Cancer Facts and Figures. (Atlanta: American Cancer Society).
2. Bernier J, Cooper JS, Pajak TF, van Glabbeke M, Bourhis J, Forastiere A, Ozsahin EM, Jacobs JR, Jassem J, Ang KK and Lefebvre JL. Defining risk levels in locally advanced head and neck cancers: a comparative analysis of concurrent postoperative radiation plus chemotherapy trials of the EORTC (#22931) and RTOG (# 9501). Head & neck. 2005; 27:843-850.
3. Forastiere A, Koch W, Trotti A and Sidransky D. Head and neck cancer. N Engl J Med. 2001; 345:1890-1900.
4. Erber R, Conradt C, Homann N, Enders C, Finckh M, Dietz A, Weidauer H, Bosch FX. TP53 DNA contact mutations are selectively associated with allelic loss and have a strong clinical impact in head and neck cancer. Oncogene. 1998:1671-1679.
5. Poeta ML, Manola J, Goldwasser MA, Forastiere A, Benoit N, Califano JA, Ridge JA, Goodwin J, Kenady D, Saunders J, Westra W, Sidransky D and Koch WM. TP53 mutations and survival in squamous-cell carcinoma of the head and neck. N Engl J Med. 2007; 357:2552-2561.
6. Koch WM, Brennan JA, Zahurak M, Goodman SN, Westra WH, Schwab D, Yoo GH, Lee DJ, Forastiere AA and Sidransky D. p53 mutation and locoregional treatment failure in head and neck squamous cell carcinoma. J Natl Cancer Inst. 1996; 88:1580-1586.
7. Lindenbergh-van der Plas M, Brakenhoff RH, Kuik DJ, Buijze M, Bloemena E, Snijders PJ, Leemans CR and Braakhuis BJ. Prognostic significance of truncating TP53 mutations in head and neck squamous cell carcinoma. Clin Cancer Res. 2011; 17:3733-3741.
8. Gross AM, Orosco RK, Shen JP, Egloff AM, Carter H, Hofree M, Choueiri M, Coffey CS, Lippman SM, Hayes DN, Cohen EE, Grandis JR, Nguyen QT and Ideker T. Multi-tiered genomic analysis of head and neck cancer ties TP53 mutation to 3p loss. Nature genetics. 2014.
9. Lichtarge O and Wilkins A. Evolution: a guide to perturb protein function and networks. Curr Opin Struct Biol. 2010; 20:351-359.
10. Madabushi S, Yao H, Marsh M, Kristensen DM, Philippi A, Sowa ME and Lichtarge O. Structural clusters of evolutionary trace residues are statistically significant and common in proteins. J Mol Biol. 2002; 316:139-154.
11. Katsonis P and Lichtarge O. A formal perturbation equation between genotype and phenotype determines the Evolutionary Action of protein-coding variations on fitness. Genome research. 2014.
12. Neskey DM, Osman AA, Ow TJ, Katsonis P, McDonald T, Hicks SC, Hsu TK, Pickering CR, Ward A, Patel A, Yordy JS, Skinner HD, Giri U, et al. Evolutionary Action score of TP53 (EAp53) identifies high risk mutations associated with decreased survival and increased distant metastases in head and neck cancer. Cancer research. 2015.
13. Aguilar-Cuenca R, Juanes-Garcia A and Vicente-Manzanares M. Myosin II in mechanotransduction: master and commander of cell migration, morphogenesis, and cancer. Cellular and molecular life sciences. 2014; 71:479-492.
14. Bresnick AR. Molecular mechanisms of nonmuscle myosin-II regulation. Current opinion in cell biology. 1999; 11:26-33.
15. Sandquist JC, Swenson KI, Demali KA, Burridge K and Means AR. Rho kinase differentially regulates phosphorylation of nonmuscle myosin II isoforms A and B during cell rounding and migration. The Journal of biological chemistry. 2006; 281:35873-35883.
16. Even-Ram S, Doyle AD, Conti MA, Matsumoto K, Adelstein RS and Yamada KM. Myosin IIA regulates cell motility and actomyosin-microtubule crosstalk. Nature cell biology. 2007; 9:299-309.
17. Schramek D, Sendoel A, Segal JP, Beronja S, Heller E, Oristian D, Reva B and Fuchs E. Direct in vivo RNAi screen unveils myosin IIa as a tumor suppressor of squamous cell carcinomas. Science. 2014; 343:309-313.
18. Comprehensive genomic characterization of head and neck squamous cell carcinomas. Nature. 2015; 517:576-582.
19. Wei Q and Adelstein RS. Conditional expression of a truncated fragment of nonmuscle myosin II-A alters cell shape but not cytokinesis in HeLa cells. Molecular biology of the cell. 2000; 11:3617-3627.
20. Agrawal N, Frederick MJ, Pickering CR, Bettegowda C, Chang K, Li RJ, Fakhry C, Xie TX, Zhang J, Wang J, Zhang N, El-Naggar AK, Jasser SA, et al. Exome sequencing of head and neck squamous cell carcinoma reveals inactivating mutations in NOTCH1. Science. 2011; 333:1154-1157.
21. Stransky N, Egloff AM, Tward AD, Kostic AD, Cibulskis K, Sivachenko A, Kryukov GV, Lawrence MS, Sougnez C, McKenna A, Shefler E, Ramos AH, Stojanov P, et al. The mutational landscape of head and neck squamous cell carcinoma. Science. 2011; 333:1157-1160.
22. Willis A, Jung EJ, Wakefield T and Chen X. Mutant p53 exerts a dominant negative effect by preventing wild-type p53 from binding to the promoter of its target genes. Oncogene. 2004; 23:2330-2338.
23. Brosh R and Rotter V. When mutants gain new powers: news from the mutant p53 field. Nature reviews Cancer. 2009; 9:701-713.
24. Dittmer D, Pati S, Zambetti G, Chu S, Teresky AK, Moore M, Finlay C and Levine AJ. Gain of function mutations in p53. Nature genetics. 1993; 4:42-46.
25. Muller PA and Vousden KH. p53 mutations in cancer. Nature cell biology. 2013; 15:2-8.
26. Petrie RJ, Koo H and Yamada KM. Generation of compartmentalized pressure by a nuclear piston governs cell motility in a 3D matrix. Science. 2014; 345:1062-1065.
27. Osman AA, Neskey DM, Katsonis P, Patel AA, Ward AM, Hsu TK, Hicks SC, McDonald TO, Ow TJ, Alves MO, Pickering CR, Skinner HD, Zhao M, et al. Evolutionary Action Score of TP53 Coding Variants Is Predictive of Platinum Response in Head and Neck Cancer Patients. Cancer research. 2015; 75:1205-1215.
28. Child ES and Mann DJ. The intricacies of p21 phosphorylation: protein/protein interactions, subcellular localization and stability. Cell cycle. 2006; 5:1313-1319.
29. Schindelin J, Arganda-Carreras I, Frise E, Kaynig V, Longair M, Pietzsch T, Preibisch S, Rueden C, Saalfeld S, Schmid B, Tinevez JY, White DJ, Hartenstein V, et al. Fiji: an open-source platform for biological-image analysis. Nat Methods. 2012; 9:676-682.
30. Xia M, Zhang C, Boini KM, Thacker AM and Li PL. Membrane raft-lysosome redox signalling platforms in coronary endothelial dysfunction induced by adipokine visfatin. Cardiovasc Res. 2011; 89:401-409.