
INTRODUCTION
Major salivary gland cancer (MSGC) accounts for approximately 3–6% of all head and neck malignancies [1, 2]. Globally, the overall annual MSGC incidence is 1.195/100,000 [2]. MSGC encompass a cohort of histologies, of which the most common cancer is mucoepidermoid carcinoma, followed by adenoid cystic carcinomas and acinar cell neoplasms, and the most common site of involvement is the parotid gland. Because of the histological heterogeneity and biological behavior diversity, surgery-related issues and the role of radiation therapy were disordered [3, 4], and the 5-year overall survival (OS) rates of MSGC patient vary widely, ranging from 32% to 74% [5, 6]. In addition, since MSGC is rare, most reports of clinical prognostic factors, OS, and cancer-specific survival (CSS) are from small single-institution retrospective studies [5–8]. To our knowledge, no such studies have been performed using data from a national database. The Surveillance, Epidemiology, and End Results (SEER) program of the National Cancer Institute, which collects and publishes cancer incidence and survival data from population-based cancer registries, provides such a free database [9].
Currently, treatment strategies and prognostic predictions for patients with MSGC are based on the American Joint Committee on Cancer (AJCC) TNM staging system (7th edition), which is recommend by the National Comprehensive Cancer Network (NCCN) guidelines [10]. However, the disease staging (I to IV) based on TNM-status dose not take into account the role of other factors that significantly affect the survival of patients with MSGC, such as patient characteristics (age, race, and sex), tumor variables (tumor site, perineural invasion, lymphovascular invasion, and tumor grade) as well as treatment modality (surgery performed and radiation therapy) [5, 6, 8, 11, 12]. Therefore, this system might be inadequate for customized therapeutic decision-making and prognosis prediction, and a new tool is required to address this issue.
Nomograms, which are reliable statistical predictive tools, can estimate individual patient survival with higher accuracy than the AJCC TNM staging system can, by incorporating numerous factors, including TNM elements[13]. Nomograms have been widely developed and applied in a variety of cancers [14–16], and nomograms with good performance have been introduced into NCCN guidelines [17]. Morever, several nomograms have been used to assist clinicians in making treatment and follow-up decisions in patients with head and neck cancers, including squamous cell carcinoma [18–21], adenoid cystic carcinoma [22] and nasopharyngeal cancer [23]. Two studies have reported the utility of nomograms for predicting the outcomes of patients with MSGC [5, 7], but both were based on a single population retrospective cohort and did not include patients who did not undergo surgery.
In the present study, on the basis of multi–institution and multi–population data from SEER database, we aimed to develop the first practical MSGC nomograms that predict long-term OS and CSS. These nomograms can help clinicians design customized treatment and management strategies for patients with MSGC.
RESULTS
Patient and tumor characteristics
After applying the screening criteria, 4218 and 244 eligible patients were included in the SEER and Fourth Military Medical University (FMMU) cohort, respectively. The median follow-up period was 34 months (1–119 months) for SEER patients and 50 months (3–120 months) for FMMU patients. Clinical and tumor characteristics are listed in Table 1. The median patient age was 61 years (15–104 years) in the SEER cohort and 59 years (18–96 years) in FMMU cohort. In both cohorts, more than 80% of MSGC originated in the parotid gland, and tended to occur most frequently among older men. The majority of patients in both cohorts had T1–T2 stage (SEER: 56.2%, FMMU: 57.0%), with no node metastasis (SEER: 67.3%, FMMU: 68.9%) and no distant metastasis (SEER: 95.5%, FMMU: 95.1%). In both cohorts, most patients received radiotherapy (SEER: 62.3%, FMMU: 66.4%). By the end of the follow-up period, 1320 (31.3%) patients in the SEER cohort had died, including 883 (20.9%) patients who died from MSGC, and 437 (10.4%) who died of other causes.
Table 1: Clinical and tumor characteristics of patients
Variables |
SEER Cohort |
FMMU Cohort |
||
|---|---|---|---|---|
No. |
% |
No. |
% |
|
Age, years |
||||
15-44 |
786 |
18.6 |
43 |
17.6 |
45-54 |
634 |
15.1 |
40 |
16.4 |
55-64 |
874 |
20.7 |
54 |
22.1 |
65-74 |
857 |
20.3 |
44 |
18.1 |
75-84 |
736 |
17.5 |
45 |
18.4 |
85+ |
331 |
7.8 |
18 |
7.4 |
Race |
||||
White |
3491 |
82.8 |
0 |
0 |
Black |
372 |
8.8 |
0 |
0 |
Other* |
355 |
8.4 |
244 |
100 |
Sex |
||||
Female |
1675 |
39.7 |
100 |
41.0 |
Male |
2543 |
60.3 |
144 |
59.0 |
Marital status |
||||
Unmarried |
1122 |
26.6 |
50 |
20.5 |
Married |
3096 |
73.4 |
194 |
79.5 |
Grade |
||||
I |
755 |
17.9 |
53 |
21.7 |
II |
1451 |
34.4 |
78 |
32.0 |
III |
1399 |
33.2 |
80 |
32.8 |
IV |
613 |
14.5 |
33 |
13.5 |
Laterality |
||||
Left |
2127 |
50.4 |
129 |
52.9 |
Right |
2094 |
49.6 |
115 |
47.1 |
Site |
||||
Parotid |
3617 |
85.8 |
196 |
80.3 |
Submandibular |
550 |
13.0 |
42 |
17.2 |
Sublingual |
51 |
1.2 |
6 |
2.5 |
T stage |
||||
T1 |
1293 |
30.6 |
83 |
34.0 |
T2 |
1079 |
25.6 |
56 |
23.0 |
T3 |
944 |
22.4 |
54 |
22.1 |
T4a |
737 |
16.5 |
37 |
15.2 |
T4b |
165 |
3.9 |
14 |
5.7 |
N stage |
||||
N0 |
2838 |
67.3 |
148 |
68.9 |
N1 |
590 |
14.0 |
32 |
13.1 |
N2a |
40 |
0.9 |
3 |
1.2 |
N2b |
687 |
16.3 |
34 |
13.9 |
N2c |
27 |
0.6 |
3 |
1.2 |
N3 |
36 |
0.9 |
4 |
1.7 |
M stage |
||||
M0 |
4030 |
95.5 |
232 |
95.1 |
M1 |
188 |
4.5 |
12 |
4.9 |
Surgery Performed |
||||
Yes |
3971 |
94.1 |
244 |
100 |
None |
247 |
5.9 |
0 |
0 |
Radiation |
||||
Yes |
2626 |
62.3 |
162 |
66.4 |
None |
1592 |
37.7 |
82 |
33.6 |
*Other including American Indian/AK Native, Asian/Pacific Islander.
Nomograms construction
After univariate analysis, all variables other than tumor laterality were found to be statistically associated with OS. Multivariate analyses revealed that nine variables were independent prognostic factors for OS in patients with MSGC: age, sex, tumor site, tumor grade, surgery performed, radiation therapy, and TNM classifications (Table 2). These variables were used to develop the nomogram for predicting five- and eight-year OS (Figure 1A).
Table 2: Univariate and multivariate analyses of overall survival in the SEER cohort
Variables |
univariate analysis |
multivariate analysis |
|
|---|---|---|---|
P Value |
HR (95% CI) |
P Value |
|
Age, years |
<0.001 |
||
15-44 |
0.126(0.096-0.165) |
<0.001 |
|
45-54 |
0.187(0.149-0.235) |
<0.001 |
|
55-64 |
0.236(0.195-0.285) |
<0.001 |
|
65-74 |
0.339(0.284-0.405) |
<0.001 |
|
75-84 |
0.543(0.458-0.643) |
<0.001 |
|
85+ |
Reference |
||
Race |
<0.001 |
0.173 |
|
White |
|||
Black |
|||
Other* |
|||
Sex |
<0.001 |
||
Female |
0.731(0.646-0.828) |
<0.001 |
|
Male |
Reference |
||
Marital status |
<0.001 |
0.205 |
|
Unmarried |
|||
Married |
|||
Grade |
<0.001 |
||
I |
0.308(0.229-0.415) |
<0.001 |
|
II |
0.700(0.589-0.832) |
<0.001 |
|
III |
0.958(0.829-1.107) |
0.557 |
|
IV |
Reference |
||
Laterality |
0.697 |
||
Left |
|||
Right |
|||
Site |
<0.001 |
||
Parotid |
0.752(0.643-0.879) |
<0.001 |
|
Submandibular |
Reference |
||
Sublingual |
0.584(0.286-1.193) |
0.140 |
|
T stage |
<0.001 |
||
T1 |
0.269(0.206-0.352) |
<0.001 |
|
T2 |
0.430(0.337-0.548) |
<0.001 |
|
T3 |
0.615(0.487-0.776) |
<0.001 |
|
T4a |
0.711(0.565-0.894) |
0.004 |
|
T4b |
Reference |
||
N stage |
<0.001 |
||
N0 |
0.409(0.265-0.608) |
<0.001 |
|
N1 |
0.629(0.406-0.946) |
0.026 |
|
N2a |
0.927(0.509-1.623) |
0.747 |
|
N2b |
0.770(0.490-1.134) |
0.170 |
|
N2c |
0.477(0.256-0.890) |
0.020 |
|
N3 |
Reference |
||
M stage |
<0.001 |
||
M0 |
0.341(0.281-0.414) |
<0.001 |
|
M1 |
Reference |
||
Surgery Performed |
<0.001 |
||
Yes |
0.415(0.350-0.493) |
<0.001 |
|
None |
Reference |
||
Radiation |
<0.001 |
||
Yes |
0.778(0.687-0.880) |
<0.001 |
|
None |
Reference |
||
*Other including American Indian/AK Native, Asian/Pacific Islander.
Abbreviations: CI; confidence interval; HR, hazard ratio.
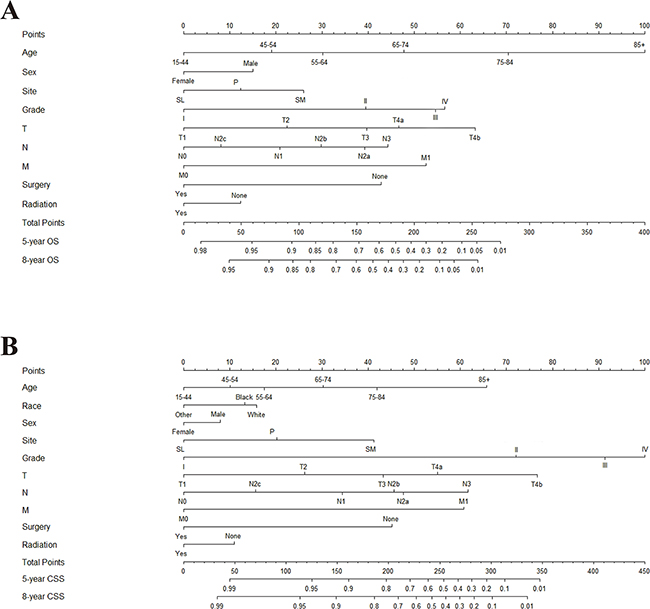
Figure 1: Nomogram for predicting five- and eight-year. A. overall survival (OS) and B. cancer-specific survival (CSS) in patients with MSGC. Abbreviations: Grade: I, Well differentiated; II, Moderately differentiated; III, Poorly differentiated; IV, Undifferentiated. Site: P, parotid gland; SM, submandibular gland; SL, sublingual gland. Race: Other, American Indian/AK Native, Asian/Pacific Islander. Instructions: All the points identified on the points scale for each factor were summed up for each patient. This total point score is identified on the bottom scale to determine the probability of five- and eight-year OS or CSS for an individual patient.
The five- and eight-year cumulative incidences of death in the training cohort from MSGC and other causes by are presented clinicopathological variables in Table 3. Gray’s test and a multivariate competing risks model revealed ten variables were independent prognostic factors for CSS in patients with MSGC: age, race, sex, tumor site, tumor grade, surgery performed, radiation therapy and TNM classifications. Therefore, a second nomogram predicting five- and eight-year CSS was created using these variables (Figure 1B).
Table 3: Five- and eight-year cumulative incidences of death among patients with major salivary gland cancer in the SEER cohort
Variables |
Cause-specific death |
Death From Other Causes |
||||
|---|---|---|---|---|---|---|
5-year |
8-year |
P |
5-year |
8-year |
P |
|
All Patients |
0.197 |
0.208 |
0.084 |
0.101 |
||
Age, years |
<0.001 |
<0.001 |
||||
15-44 |
0.066 |
0.080 |
0.010 |
0.011 |
||
45-54 |
0.149 |
0.153 |
0.024 |
0.032 |
||
55-64 |
0.204 |
0.215 |
0.044 |
0.058 |
||
65-74 |
0.224 |
0.239 |
0.077 |
0.100 |
||
75-84 |
0.267 |
0.279 |
0.168 |
0.208 |
||
85+ |
0.353 |
0.359 |
0.314 |
0.329 |
||
Race |
<0.001 |
0.001 |
||||
White |
0.209 |
0.220 |
0.090 |
0.109 |
||
Black |
0.142 |
0.161 |
0.061 |
0.067 |
||
Other* |
0.135 |
0.138 |
0.048 |
0.062 |
||
Sex |
<0.001 |
<0.001 |
||||
Female |
0.137 |
0.148 |
0.052 |
0.063 |
||
Male |
0.237 |
0.247 |
0.106 |
0.127 |
||
Marital status |
0.017 |
<0.001 |
||||
Unmarried |
0.172 |
0.183 |
0.053 |
0.067 |
||
Married |
0.206 |
0.217 |
0.095 |
0.114 |
||
Grade |
<0.001 |
<0.001 |
||||
I |
0.021 |
0.023 |
0.043 |
0.052 |
||
II |
0.119 |
0.129 |
0.064 |
0.079 |
||
III |
0.329 |
0.344 |
0.126 |
0.149 |
||
IV |
0.297 |
0.313 |
0.088 |
0.108 |
||
Laterality |
0.984 |
0.316 |
||||
Left |
0.198 |
0.209 |
0.089 |
0.107 |
||
Right |
0.196 |
0.207 |
0.079 |
0.095 |
||
Site |
<0.001 |
0.371 |
||||
Parotid |
0.190 |
0.199 |
0.086 |
0.103 |
||
Submandibular |
0.254 |
0.276 |
0.076 |
0.092 |
||
Sublingual |
0.078 |
0.098 |
0.039 |
0.059 |
||
T stage |
<0.001 |
<0.001 |
||||
T1 |
0.064 |
0.066 |
0.046 |
0.058 |
||
T2 |
0.141 |
0.151 |
0.075 |
0.094 |
||
T3 |
0.265 |
0.282 |
0.118 |
0.138 |
||
T4a |
0.354 |
0.374 |
0.127 |
0.148 |
||
T4b |
0.521 |
0.533 |
0.061 |
0.073 |
||
N stage |
<0.001 |
0.031 |
||||
N0 |
0.102 |
0.110 |
0.075 |
0.092 |
||
N1 |
0.333 |
0.361 |
0.110 |
0.127 |
||
N2a |
0.425 |
0.425 |
0.125 |
0.150 |
||
N2b |
0.429 |
0.443 |
0.092 |
0.109 |
||
N2c |
0.481 |
0.481 |
0.222 |
0.222 |
||
N3 |
0.500 |
NA |
0.083 |
NA |
||
M stage |
<0.001 |
0.119 |
||||
M0 |
0.174 |
0.186 |
0.085 |
0.103 |
||
M1 |
0.686 |
0.686 |
0.064 |
0.064 |
||
Surgery Performed |
<0.001 |
<0.001 |
||||
Yes |
0.174 |
0.185 |
0.080 |
0.097 |
||
None |
0.571 |
0.583 |
0.146 |
0.164 |
||
Radiation |
<0.001 |
0.906 |
||||
Yes |
0.225 |
0.239 |
0.083 |
0.093 |
||
None |
0.152 |
0.157 |
0.087 |
0.099 |
||
*Other including American Indian/AK Native, Asian/Pacific Islander.
Nomograms validation
In the present study, we performed both internal and external validation of the nomograms. As shown in Table 4, in the internal validation cohort (SEER cohort), models showed good accuracy with c-index of 0.817 (95 % confidence interval [CI], 0.806–0.828) and 0.829 (95 % CI, 0.817–0.841) for MSGC OS and CSS, respectively. External validation using the FMMU cohort showed that the c-index for the OS and CSS nomograms were 0.829 (95 % CI, 0.783–0.869) and 0.807 (95 % CI, 0.761–0.853), respectively. The internal and external calibration curves approached the 45-degree ideal match straight line, indicating that the nomograms for OS and CSS in MSGC were generally well calibrated (Figure 2 and Figure 3).
Table 4: The harrell’s c-index for the nomogram to predict OS and CSS
Groups |
OS |
CSS |
||
|---|---|---|---|---|
HR |
95%CI |
HR |
95%CI |
|
SEER cohort |
0.817 |
0.806-0.828 |
0.829 |
0.817-0.841 |
FMMU cohort |
0.829 |
0.783-0.869 |
0.807 |
0.761-0.853 |
Abbreviations: OS, overall survival; CSS, cancer-specific survival; HR, hazard ratio; CI, confidence interval.
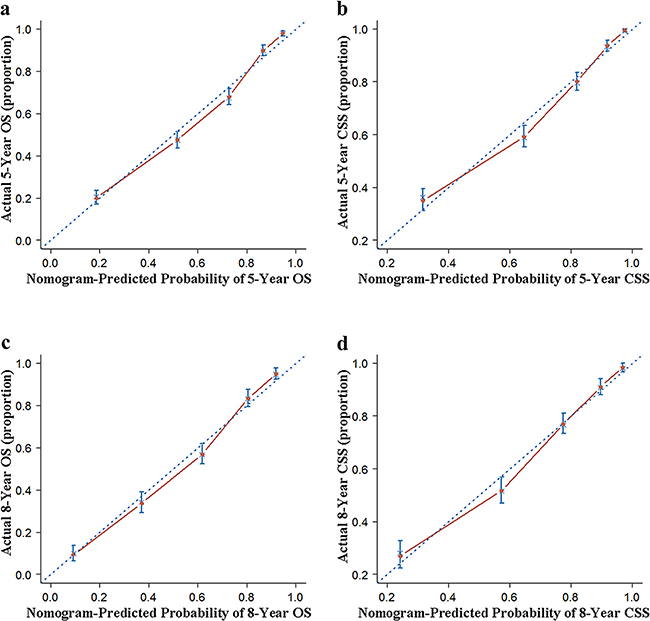
Figure 2: Internal calibration of the nomogram. a. 5- and c. 8-year overall survival (OS) nomogram calibration curves; b. 5- and d. 8-year cancer-specific survival (CSS) nomogram calibration curves. The dotted line represents the ideal match between the nomogram-predicted (X-axis) and actual survival (Y-axis). Vertical bars indicate 95% confidence intervals.
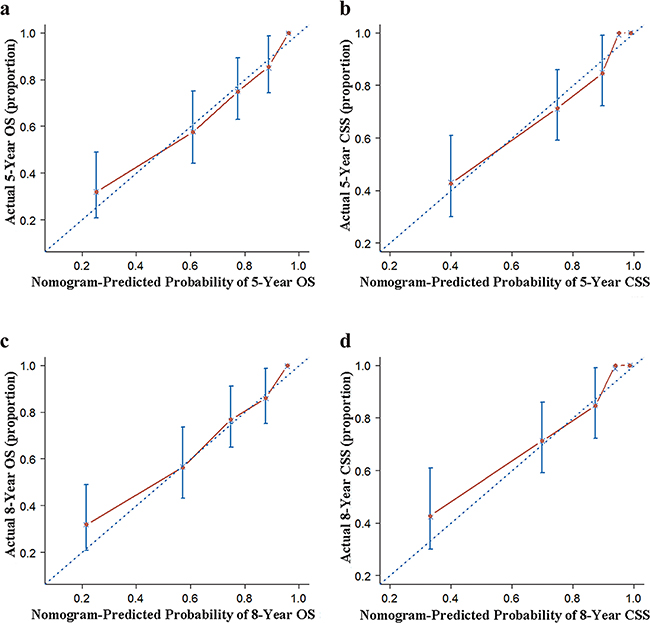
Figure 3: External calibration of the nomogram. a. 5- and c. 8-year overall survival (OS) nomogram calibration curves; b. 5- and d. 8-year cancer-specific survival (CSS) nomogram calibration curves. The dotted line represents the ideal match between the nomogram-predicted (X-axis) and actual survival (Y-axis). Vertical bars indicate 95% confidence intervals.
DISCUSSION
MSGC is a rare but histologically diverse entity that represents 23 separate primary salivary gland malignant tumors [24]. Although exposure to Ionizing radiation has been reported as a potential causative factor in MSGC development, the specific underlying etiological factors remain unclear [25]. Therefore, the establishment of treatment-related decisions and follow-up strategies for patients with MSGC is challenging but urgently needed. Nomogram is a statistical tool that can meet these requirements. To date, there is no well-designed nomogram for MSGC based on international database. Using the population-based SEER database with a mean follow-up of 34 months, we developed nomograms for predicting five- and eight-year OS and CSS in individual patients with MSGC by applying competing risks analysis.
To ensure the predictive accuracy of nomograms, we used the Kaplan–Meier method and Cox’s proportional hazards regression model to select factors for the development of the OS nomogram. A competing risks model was used to select factors for the development of the CSS nomogram. In addition, c-indexes and calibration plots were applied to estimate the predictive accuracy of the models by performing internal and external validation. All nomograms had excellent c-indexes higher than 0.8, and the performance of the calibration plots was ideal.
Compared to the widely accepted TNM staging, our nomograms are not only easy to use, but also have the ability to provide a quantified prognosis for an individual patient. For example, consider two patients with T3N0M0 cancer: case A) a 35-year-old woman diagnosed with moderately-differentiated parotid gland cancer, who underwent both surgery and radiotherapy, and case B) a 60-year-old man diagnosed with undifferentiated submandibular gland cancer, who underwent radiotherapy only. Firstly, a vertical line is drawn from every factor to the “Points” line in the nomogram. Second, all the “Points” are summed up to obtain the “Total Points” and a vertical line is drawn from “Total Points” to the “OS” and “CSS” line to obtain corresponding survival. Thus, used nomograms descried in the present study reveal that the patients in case A and B have eight year OS probabilities of 86% and 30%, respectively, and eight year CSS probabilities of 94% and 45%, respectively. However, according to TNM staging [26], both patients would be classified as stage III, which indicating identical outcomes.
In the present study, several clinical and pathologic characteristics were shown to be independent prognostic factors for OS and CSS in patients with MSGC, including age, sex, tumor site, tumor grade, surgery performed, radiation therapy, and TNM classifications, which is consistent with previous reports [5, 6, 8, 11, 27–30]. Apart from these, comorbidity and postoperative complications, which were not included in the present study, have been proven to be accurate prognostic factors [11, 30]. However, data from previous studies have revealed that a higher incidence of comorbidity and complications is significantly associated with advanced age [30, 31]. Thus, this limitation was potentially compensated by the effect of advanced age on mortality in the models.
Interestingly, on the CSS, we found that both 5- and 8-year cause-specific death (CSD) rates of MSGC patients who did not received radiotherapy (15.2% and 15.7%, respectively) were lower than those of MSGC patients who received radiotherapy (22.5% and 23.9%, respectively). In contrast, on the OS, radiotherapy performed improved the 5- and 8-year OS of patient with MSGC. This may be explained as follows: First, whereas 1320 of the 4218 patients with MSGC died of MSGC-related causes, 437 (33.1%) died of other causes other than MSGC, and 5- and 8-year mortality rates from other causes other than MSGC decreased with radiotherapy from 8.7% to 8.3% and 9.9% to 9.3%, respectively. In addition, radiotherapy was primarily used in patients with higher-grade disease or as a treatment option for advanced inoperable salivary gland tumors [6, 21].
The present study has several merits. Our nomograms have excellent accuracy with an overall c-index>0.80, which compares very favorably with those of other widely accepted nomograms in other cancers [15, 18–21], whose c-indexes range from 0.60 to 0.80. Moreover, the variables utilized in these nomograms are easily available in clinical practice. Finally, compared with previous MSGC nomograms, the present nomograms were developed on the basis of information from an international database, and were externally validated by using another independent cohort (FMMU cohort).
Despite these merits, the present study also has some limitations. First, our nomograms were constructed using retrospective data, which introduces the risk of potential selection bias. In addition, data on some important clinicopathological variables were incomplete, reducing the number of eligible case. Second, although the quality of SEER database information is considered high, TNM classifications information was not available until 2004, and the prognostic factor lymph-vascular invasion [32] was not included until 2010. Therefore, we failed to predict a survival time longer than eight years and lymph-vascular invasion was not included in the nomograms, but we plane to address these limitation in a future study. Third, data regarding tumor recurrence, chemotherapy [33], and perineural invasion [32], which are important prognostic factors for MSGC, is not available in the SEER database. Therefore, we failed to collect and analyze these factors, and develop nomograms for predicting loco-regional control.
In summary, based on a large population-based cohort, we have developed and externally validated two clinically useful nomograms that could objectively provide five- and eight-year OS and CSS for patients with MSGC for the first time. The performance of these nomograms was accurate and they may aid patient counselling, clinical decision-making, and the development of follow-up strategies for management of MSGC.
MATERIALS AND METHODS
SEER cohort
We identified information on the clinical and pathologic characteristics of all patients diagnosed with major salivary gland carcinoma between 2004 and 2013 from the SEER program of the National Cancer Institute, which is a national collaboration program [9]. The flow diagram of data selection is shown in Figure 4. Briefly, the basic inclusion criteria were as follows the primary tumor site was major salivary gland, including the parotid, submandibular, and sublingual glands; malignant behavior; and age older than 15 years at diagnosis. To improve the accuracy and homogeneity of the SEER cohort, the final inclusion criteria were as follows: diagnostic information confirmed microscopically and not from a death certificate or autopsy only; active follow-up; patient and tumor information (age, race, sex, marital status, tumor site, tumor laterality, tumor grade, surgery performed, radiation therapy and TNM classifications) were known and exact. A total of 4017 patients were excluded due to indefinite follow-up information or because patients died less than 1 month after treatment. After applying the screen criteria, 4218 patients were included in the final SEER cohort.
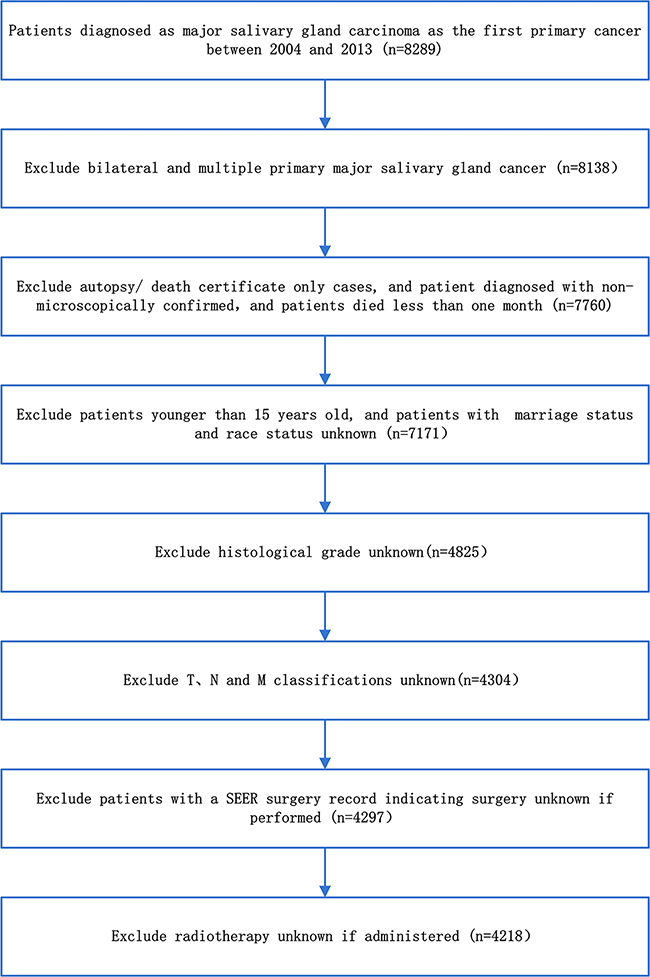
Figure 4: The flow diagram of data selection for the SEER cohort.
For analyses, age was transformed into categorical variables on the basis of recognized cutoff values. Race classification based on the SEER Program was as follows: white, black, and other (American Indian/Alaskan Native and Asian/Pacific Islanders). Tumor grade included I (well differentiated), II (moderately differentiated), III (poorly differentiated) and IV (undifferentiated). All patients TNM classification were staged according to the 7th edition AJCC Staging Manual [26].
FMMU cohort
The FMMU cohort comprised 256 patients who were histologically diagnosed with major salivary gland carcinoma at the department of Oral and Maxillofacial Surgery, School of Stomatology, Fourth Military Medical University (FMMU) in China. All inclusion criteria were identical to those used in the SEER cohort except that all patients were Chinese and received surgery as the primary treatment. Twelve patients were excluded, eight patients because of indefinite follow-up information, and four because they died less than 1 month after surgery. After applying the screen criteria, 244 patients were included in the final FMMU cohort.
Nomograms
The SEER cohort was used to establish the OS and CSS nomogram. OS was defined as the time from diagnosis to death or censoring (if a patient was alive at the last follow-up). The median follow-up time was estimated as the actual patient survival time. The Kaplan-Meier method and log-rank test were used to conduct the univariate prognostic analysis. Variables that were possible prognostic factors (P < 0.001) on univariate analyses were included in the multivariate cox proportional hazards analysis to yield independent MSGC OS factors (P < 0.001) [34]. Next, the nine independent prognostic factors in multivariate analyses were used to build nomogram for five- and eight- year OS in patients with MSGC at by employing a stepwise-selection method in the R software.
When constructing a competing risks nomogram for MSGC, death from MSGC and death from other causes were considered two different event types in this analysis. CSS was defined as the time from diagnosis to death attributed to MSGC or censoring (if a patient was alive at the last follow-up or death from other causes). The cumulative incidence function (CIF) was used to assess the probability of death, and the difference was assessed using Gray’s test [35]. Variables whose P values were less than 0.001 for the CIF values were considered significant independent MSGC CSS factors. Subsequently, by integrating all the significant independent factors, we developed nomograms to predict five- and eight-year CSS in patients with MSGC via a proportional sub-distribution hazards regression method proposed by Fine and Gray [36] using R software“cph” and “step” commands.
Nomograms validation
The SEER and FMMU cohorts were applied to estimate the predictive accuracy of the model by performing internal and external validation, respectively. All the internal and external validations were measured by c -index and calibration plots, and performed using bootstrapping with 1000 resamples and ten-fold cross-validation, respectively. C-indexes quantified the discrimination between predicted and actual situations, with values ranging from 0.5 (no discrimination) to 1.0 (perfect discrimination), proposed by Harrell [37]. In addition, a marginal estimate versus model was used to plot calibration curve that represented the calibration between nomogram-predicted and actual survival.
All statistics analysis was conducted using the SPSS software version 19.0, (SPSS Inc., Chicago, IL, USA) and the R software version 3.3.0 (R Foundation for Statistical Computing, Vienna, Austria; www.R-project.org) with the R packages rms, and cmprsk. All calculated P values were two sided, and P <0.001 was considered statistically significant.
Ethics statement
Our study was approved by the Fourth Military Medical University Ethical Committee. Informed patient consent was not required for data released by the SEER database.
Author contributions
Study conception and design: Yun Li, Jun Ju, Xiaoxiao Liu, Tao Gao, Moyi Sun. Data acquisition and quality control of data: Yun Li, Jun Ju, Zhenyan Zhao, Zhidong Wang. Data analysis and interpretation: Yun Li, Tao Gao, Xiaoxiao Liu, Qianwei Ni, Chao Ma, Zhidong Wang. Statistical analyses of the data: Yun Li, Jun Ju, Tao Gao, Xiaoxiao Liu, Qianwei Ni, Yixiong Ren. Manuscript preparation and editing: Yun Li, Jun Ju, Xiaoxiao Liu, Moyi Sun. Final review and approval of manuscript: All authors.
ACKNOWLEDGMENTS AND FUNDING
This work was supported by grants from the National Natural Science Foundation of China (81072230).
CONFLICTS OF INTEREST
None declared.
REFERENCES
1. Speight PM, Barrett AW. Salivary gland tumours. Oral Dis. 2002; 8:229-40.
2. Boukheris H, Curtis RE, Land CE, Dores GM. Incidence of carcinoma of the major salivary glands according to the WHO classification, 1992 to 2006: a population-based study in the United States. Cancer Epidemiol Biomarkers Prev. 2009; 18:2899-906.
3. Panwar A, Kozel JA, Lydiatt WM. Cancers of major salivary glands. Surg Oncol Clin N Am. 2015; 24:615-33.
4. Mahmood U, Koshy M, Goloubeva O, Suntharalingam M. Adjuvant radiation therapy for high-grade and/or locally advanced major salivary gland tumors. Arch Otolaryngol Head Neck Surg. 2011; 137:1025-30.
5. Ali S, Palmer FL, Yu C, DiLorenzo M, Shah JP, Kattan MW, Patel SG, Ganly I. Postoperative nomograms predictive of survival after surgical management of malignant tumors of the major salivary glands. Ann Surg Oncol. 2014; 21:637-42.
6. Iqbal H, Bhatti AB, Hussain R, Jamshed A. Ten year experience with surgery and radiation in the management of malignant major salivary gland tumors. Asian Pac J Cancer Prev. 2014; 15:2195-99.
7. Ali S, Palmer FL, Yu C, DiLorenzo M, Shah JP, Kattan MW, Patel SG, Ganly I. A predictive nomogram for recurrence of carcinoma of the major salivary glands. JAMA Otolaryngol Head Neck Surg. 2013; 139:698-705.
8. Jegadeesh N, Liu Y, Prabhu RS, Magliocca KR, Marcus DM, Higgins KA, Vainshtein JM, Trad Wadsworth J, Beitler JJ. Outcomes and prognostic factors in modern era management of major salivary gland cancer. Oral Oncol. 2015; 51:770-77.
9. National Cancer Institute. Surveillance, Epidemiology, and End Results Program. http://seer.cancer.gov/.
10. Pfister DG, Spencer S, Brizel DM, Burtness B, Busse PM, Caudell JJ, Cmelak AJ, Colevas AD, Dunphy F, Eisele DW, Foote RL, Gilbert J, Gillison ML, et al. Head and Neck Cancers, Version 1.2015. J Natl Compr Canc Netw. 2015; 13:847-55.
11. Peters TT, van Dijk BA, Roodenburg JL, Plaat BE, Wedman J, van der Laan BF, Halmos GB. Predictors of postoperative complications and survival in patients with major salivary glands malignancies: a study highlighting the influence of age. Head Neck. 2014; 36:369-74.
12. Kupferman ME, de la Garza GO, Santillan AA, Williams MD, Varghese BT, Huh W, Roberts D, Weber RS. Outcomes of pediatric patients with malignancies of the major salivary glands. Ann Surg Oncol. 2010; 17:3301-07.
13. Kattan MW. Nomograms. Introduction. Semin Urol Oncol. 2002; 20:79-81.
14. Lee CK, Goldstein D, Gibbs E, Joensuu H, Zalcberg J, Verweij J, Casali PG, Maki RG, Cioffi A, Mcarthur G, Lord SJ, Yip D, Kanjanapan Y, Rutkowski P. Development and validation of prognostic nomograms for metastatic gastrointestinal stromal tumour treated with imatinib. Eur J Cancer. 2015; 51:852-60.
15. Sun W, Jiang YZ, Liu YR, Ma D, Shao ZM. Nomograms to estimate long-term overall survival and breast cancer-specific survival of patients with luminal breast cancer. Oncotarget. 2016; 7:20496-506. doi: 10.18632/oncotarget.7975.
16. Liu Y, Wang R, Ding Y, Tu S, Liu Y, Qian Y, Xu L, Tong T, Cai S, Peng J. A predictive nomogram improved diagnostic accuracy and interobserver agreement of perirectal lymph nodes metastases in rectal cancer. Oncotarget. 2016; 7:14755-64. doi: 10.18632/oncotarget.7548.
17. Kawachi MH, Bahnson RR, Barry M, Busby JE, Carroll PR, Carter HB, Catalona WJ, Cookson MS, Epstein JI, Etzioni RB, Giri VN, Hemstreet GP 3rd, Howe RJ, et al. NCCN clinical practice guidelines in oncology: prostate cancer early detection. J Natl Compr Canc Netw. 2010; 8:240-62.
18. Gross ND, Patel SG, Carvalho AL, Chu PY, Kowalski LP, Boyle JO, Shah JP, Kattan MW. Nomogram for deciding adjuvant treatment after surgery for oral cavity squamous cell carcinoma. Head Neck. 2008; 30:1352-60.
19. Montero PH, Yu C, Palmer FL, Patel PD, Ganly I, Shah JP, Shaha AR, Boyle JO, Kraus DH, Singh B, Wong RJ, Morris LG, Kattan MW, Patel SG. Nomograms for preoperative prediction of prognosis in patients with oral cavity squamous cell carcinoma. Cancer. 2014; 120:214-21.
20. Shen W, Sakamoto N, Yang L. Cancer-specific mortality and competing mortality in patients with head and neck squamous cell carcinoma: a competing risk analysis. Ann Surg Oncol. 2015; 22:264-71.
21. Ju J, Wang J, Ma C, Li Y, Zhao Z, Gao T, Ni Q, Sun M. Nomograms predicting long-term overall survival and cancer-specific survival in head and neck squamous cell carcinoma patients. Oncotarget. 2016; 7:51059-68. doi: 10.18632/oncotarget.10595.
22. Ganly I, Amit M, Kou L, Palmer FL, Migliacci J, Katabi N, Yu C, Kattan MW, Binenbaum Y, Sharma K, Naomi R, Abib A, Miles B, et al. Nomograms for predicting survival and recurrence in patients with adenoid cystic carcinoma. An international collaborative study. Eur J Cancer. 2015; 51:2768-76.
23. Cho JK, Lee GJ, Yi KI, Cho KS, Choi N, Kim JS, Kim H, Oh D, Choi SK, Jung SH, Jeong HS, Ahn YC. Development and external validation of nomograms predictive of response to radiation therapy and overall survival in nasopharyngeal cancer patients. Eur J Cancer. 2015; 51:1303-11.
24. Eveson JW, Auclair PL, Gnepp DR. Tumors of the salivary glands: introduction. In: Barnes L, Eveson JW, Reichert P. Pathology and genetics of head and neck tumors. Lyon (France): World Health Organization Classification of Tumors; IARC Press 2005. p. 212-7.
25. Wenig BM. Section 4: major and minor salivary glands. Neoplasms of the salivary glands. In:Wenig BM, editor. Atlas of head and neck pathology. 2nd edition. Philadelphia: Elsevier; 2008. p. 582-702.
26. Edge SB, Compton CC. The American Joint Committee on Cancer: the 7th edition of the AJCC cancer staging manual and the future of TNM. Ann Surg Oncol 2010; 17:1471-4.
27. Cheung MC, Franzmann E, Sola JE, Pincus DJ, Koniaris LG. A comprehensive analysis of parotid and salivary gland cancer: worse outcomes for male gender. J Surg Res. 2011; 171:151-58.
28. Bell RB, Dierks EJ, Homer L, Potter BE. Management and outcome of patients with malignant salivary gland tumors. J Oral Maxillofac Surg. 2005; 63:917-28.
29. Terhaard CH, Lubsen H, Van der Tweel I, Hilgers FJ, Eijkenboom WM, Marres HA, Tjho-Heslinga RE, de Jong JM, Roodenburg JL, and Dutch Head and Neck Oncology Cooperative Group. Salivary gland carcinoma: independent prognostic factors for locoregional control, distant metastases, and overall survival: results of the Dutch head and neck oncology cooperative group. Head Neck. 2004; 26:681-92.
30. Terhaard CH, van der Schroeff MP, van Schie K, Eerenstein SE, Lubsen H, Kaanders JH, Smeele LE, Burlage FR, van Den Ende PL, Baatenburg de Jong RJ. The prognostic role of comorbidity in salivary gland carcinoma. Cancer. 2008; 113:1572-79.
31. Lughezzani G, Sun M, Shariat SF, Budäus L, Thuret R, Jeldres C, Liberman D, Montorsi F, Perrotte P, Karakiewicz PI. A population-based competing-risks analysis of the survival of patients treated with radical cystectomy for bladder cancer. Cancer. 2011; 117:103-09.
32. Noh JM, Ahn YC, Nam H, Park W, Baek CH, Son YI, Jeong HS. Treatment results of major salivary gland cancer by surgery with or without postoperative radiation therapy. Clin Exp Otorhinolaryngol. 2010; 3:96-101.
33. Surakanti SG, Agulnik M. Salivary gland malignancies: the role for chemotherapy and molecular targeted agents. Semin Oncol. 2008; 35:309-19.
34. Hosmer D, Lemeshow S. Applied survival analysis: regression modeling of time to event data. New York: John Wiley & Sons; 1991. p. 159.
35. Gray RJ. A class of k-sample tests for comparing the cumulative incidence of a competing risk. Ann Stat. 1988; 16:1141-54.
36. Fine JP, Gray RJ. A proportional hazards model for the sub-distribution of competing risks in survival analysis. J Am Stat Assoc. 1999; 94:496-509.
37. Harrell FE. Regression modeling strategies: With applications to linear models, logistic regression, and survival analysis. New York: Springer; 2001. https://doi.org/10.1007/978-1-4757-3462-1.