
INTRODUCTION
Head and neck squamous cell carcinomas (HNSCCs) account for 5% of all human malignancies and are associated with a constantly poor prognosis for many years [1]. In nearly 50% of all HNSCC patients, lymph node metastases are found at the time of diagnosis, which markedly worsens their outcome and necessitates the intensification of therapy [2, 3]. If no primary tumor is found after the initial staging procedure is completed, the disease is classified as “cancer of unknown primary” (CUP syndrome), which represents a highly malignant disease that is accompanied by a median overall survival time of only eight months [4, 5]. Although the effects of nicotine and alcohol consumption [6, 7], as well as infection of the oral mucosa with high-risk human papillomavirus [8], on the carcinogenesis of HNSCCs have been well known for many years, it is still not completely known which molecular processes drive the malignant transformation in these diseases and which differences in tumor cell biology are responsible for the different clinical phenotypes of HNSCCs compared with CUP syndrome [4, 7, 9, 10]. To uncover candidate oncogenes and tumor suppressor genes that are involved in the carcinogenesis of HNSCCs, numerous molecular genetic analyses were performed. Thus, an amplification of the long arm of chromosome 3 (3q) was identified as a characteristic genetic alteration [11, 12], which was also found in other tumor entities, including non-small-cell lung cancer (NSCLC), cervical cancer and esophageal cancer [13–15]. Subsequently, many groups aimed to identify potential target genes encoded in the 3q region and proposed FXR1, CLAPM1, PIK3CA, EIF4G and P63 as potential oncogenes without, however, being able to prove a functional correlate at the level of cancer cell biology [16–19]. Our group identified SEC62 as a further potential 3q encoded oncogene. SEC62 encodes a transmembrane protein of the endoplasmic reticulum the precise physiological function of which in mammals is still not known. Initial studies have suggested a role for this protein in the intracellular transport of specific proteins and in calcium homeostasis [20–22]. After analyzing the gene copy number and expression of SEC62 in tissue samples of NSCLC patients, we observed that lung cancer tissue shows a SEC62 amplification as well as SEC62 overexpression at both the mRNA and protein levels. In addition, the SEC62 protein level of the cancer tissue significantly correlated with a positive lymph node status and indicated poorer overall survival. Concurrently, functional analyses on lung cancer cell lines showed a marked reduction of the migratory potential of the cells after SEC62 knock-down and stimulation of HEK293 cell migration when the SEC62 gene was overexpressed [22, 23]. Over the past several years, the role of SEC62 as a potential oncogene has been shown in different tumors, including hepatocellular cancer [24], prostate cancer [25, 26] and HNSCCs [27].
However, little is known about the oncogenic function of SEC62 and how this gene is able to affect cell migration and the subsequent formation of metastases. In addition to SEC62, SOX2 constitutes another gene of the 3q26 region that encodes a transcription factor that has an essential role in embryogenesis and the maintenance of stem cell pluripotency [28, 29]. Comparable to SEC62, SOX2 was amplified and overexpressed in different cancers, e.g., HNSCC, esophageal cancer, cervical cancer and lung cancer [30–34]. Furthermore, SOX2 overexpression was associated with a worse prognosis in HNSCC patients [35, 36] and small-cell lung cancer [37]. Compared with SEC62, SOX2 also seems to affect the migration and metastasis of cancer cells; an analysis of SOX2 expression in HNSCC tissue specimens showed a significant correlation with positive lymph node status, [38] and artificial SOX2 overexpression in laryngeal cancer cells stimulated their migratory potential [39, 40]. By contrast, other studies have shown a correlation between high SOX2 expression and negative lymph node status in HNSCC patients [41, 42], as well as a favorable prognosis in NSCLC [43], gastric cancer [44] and HNSCC patients [42]. Ultimately, the role of SOX2 in cancer cell biology and the formation of metastases remain unclear and require further studies.
In our study, we elucidated the function of both 3q26 encoded genes, SEC62 and SOX2, in HNSCCs, with a main focus on their role in migration and metastasis. Therefore, we analyzed the expression level of both genes in lymph node metastases from HNSCC and CUP syndrome patients and performed functional analyses to delineate the effect of SEC62 and SOX2 on the proliferation and migration of HNSCC cells, respectively.
RESULTS
Comparison of clinical characteristics and survival data between HNSCC and CUP patients
In total, 65 HNSCC and 29 head and neck CUP patients who were treated at the Department of Otorhinolaryngology, Head and Neck Surgery of the Saarland University Medical Center between 2004 and 2014 were included in our study. The clinical data of the patients are summarized in Table 1. CUP patients showed more advanced N stages and a higher frequency of poorly differentiated tumors, whereas the patients’ sex and median age were comparable between the HNSCC and CUP group. The majority of HNSCC patients was diagnosed at UICC stages III and IV. For both groups, surgery followed by radiation or radiochemotherapy was the treatment of choice in the majority of cases. When comparing the overall survival (OS) between the CUP and HNSCC patients, we found a significantly worse prognosis for CUP patients compared with HNSCC patients (p = 0.026; log-rank test, Figure 1) with median one-year survival rates of 73% (CUP patients) and 89% (HNSCC patients) and two-year survival rates of 52% (CUP patients) and 73% (HNSCC patients). Regarding the involvement of HPV, we found a higher percentage of HPV positive cases in the HNSCC group (19/65, 29%) compared to the CUP group (5/29, 17%; p = 0.31, Fisher’s exact test) with a non-significant tendency for a survival benefit of the HPV positive patients (p = 0.16, log-rank test).
Table 1: Clinical data of HNSCC and CUP patients
HNSCC |
CUP |
total |
||
|---|---|---|---|---|
number of patients |
65 |
29 |
94 |
|
Sex |
male |
53 (82%) |
23 (79%) |
76 (81%) |
female |
12 (18%) |
6 (21%) |
18 (19%) |
|
median age (years) |
64,6 |
66,1 |
65,3 |
|
HPV positive |
19 (29%) |
5 (17%) |
24 (26%) |
|
T-Stage |
T1 |
19 (29%) |
/ |
/ |
T2 |
26 (40%) |
/ |
/ |
|
T3 |
12 (19%) |
/ |
/ |
|
T4 |
8 (12%) |
/ |
/ |
|
N-Stage |
N1 |
14 (22%) |
5 (17%) |
19 (20%) |
N2a |
6 (9%) |
1 (3%) |
7 (8%) |
|
N2b |
28 (43%) |
7 (24%) |
35 (37%) |
|
N2c |
16 (25%) |
2 (7%) |
18 (19%) |
|
N3 |
1 (1%) |
14 (49%) |
15 (16%) |
|
M-Stage |
M0 |
64 (98%) |
29 (100%) |
93 (99%) |
M1 |
1 (2%) |
0 (0%) |
1 (1%) |
|
Grading |
G2 |
35 (54%) |
8 (28%) |
43 (46%) |
G3 |
30 (46%) |
21 (72%) |
51 (54%) |
|
UICC |
0 |
/ |
/ |
/ |
I |
/ |
/ |
/ |
|
II |
2 (3%) |
/ |
/ |
|
III |
28 (43%) |
/ |
/ |
|
IVa |
22 (34%) |
/ |
/ |
|
IVb |
11 (17%) |
/ |
/ |
|
IVc |
2 (3%) |
/ |
/ |
|
Therapy |
surgery |
8 (12%) |
4 (14%) |
12 (13%) |
surgery + RT |
23 (35%) |
14 (48%) |
37 (39%) |
|
surgery + RCT |
30 (46%) |
7 (24%) |
37 (39%) |
|
primary RT |
1 (2%) |
2 (7%) |
3 (3%) |
|
primary RCT |
3 (5%) |
2 (7%) |
5 (6%) |
|
In total, 94 patients were enrolled in the study comprising 65 HNSCC and 29 CUP patients. For both groups, the patients’ gender, median age, TNM staging, grading and therapy are shown (RT – radiotherapy, RCT – radiochemotherapy).
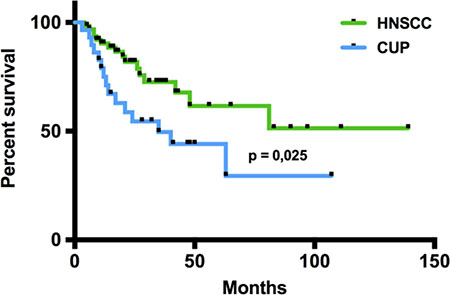
Figure 1: Overall survival of CUP and HNSCC patients. In the Kaplan-Meier analysis, the overall survival of CUP and HNSCC patients was compared revealing a significantly worse prognosis for CUP patients (p=0,026; log-rank-test). Black dots on the survival curves represent censored data.
SEC62 and SOX2 expression in lymph node metastases and the primary tumors of HNSCC patients
To evaluate whether SEC62 and SOX2 expression exerts any influence on lymphatic metastasis of HNSCCs, we analyzed the expression levels of both genes in the primary tumor and the lymph node metastases from all 65 HNSCC patients using immunohistochemical staining. For the quantification of the staining results, we used a modified immunoreactive score (mIRS) that ranged from a minimum of -14 (weak staining) to a maximum of +14 (strong staining). Figure 2 shows examples of strong and weak SEC62 staining (Figure 2A, cytoplasmic signal) as well as strong and weak SOX2 staining (Figure 2B, nuclear signal). When comparing the SEC62- and SOX2-mIRS between the primary tumor and the metastases of the HNSCC patients, we found a weak tendency towards an elevated SEC62 expression (60% of cases; p = 0.221, Mann-Whitney-test) and a significantly lower SOX2 expression (91% of cases; p < 0.0001, Mann-Whitney-test) in the metastases compared with the primary tumor (Figure 2C, 2D).
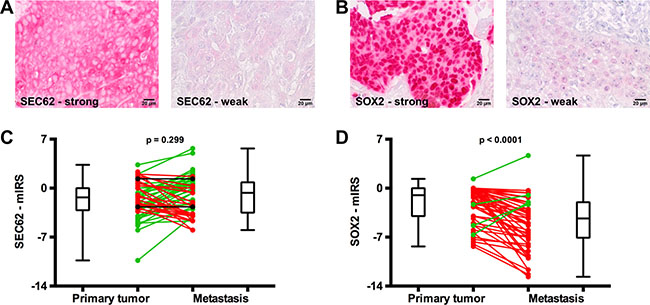
Figure 2: SEC62 and SOX2 expression in the primary tumor and lymph node metastases of HNSCC patients. SEC62 and SOX2 expression was evaluated using immunohistochemistry in tissue specimens from lymph node metastases and the respective primary tumor of 65 HNSCC patients and compared with each other. (A) Strong (left picture) and weak expression (right picture) of SEC62 (cytoplasmic staining signal). (B) Strong (left picture) and weak expression (right picture) of SOX2 (nuclear staining signal). (C) SEC62-mIRS and (D) SOX2-mIRS for the primary tumor (left) and the metastases (right) of the HNSCC patients are shown using box and whisker blots. Each box represents the range from the first quartile to the third quartile. The median is indicated by a line. The whiskers outside the boxes represent the ranges from the minimum to the maximum value of each group. In (C) and (D), the mIRS values of the tumor and the respective metastasis are connected by a line. A green line indicates an increase in mIRS, a black line indicates an unchanged mIRS and a red line indicates a decrease in mIRS in the metastasis compared with the primary tumor.
Comparison of SEC62 and SOX2 expression between lymph node metastases of CUP and HNSCC patients
Next, we analyzed whether the expression of SEC62 and SOX2 in the lymph node metastases from the HNSCC patients significantly differed from the expression of these genes in lymph node metastases from the CUP patients. Thus, we found a weak tendency towards a higher SEC62 expression and a significantly lower SOX2 expression in the lymph node metastases from CUP patients compared with the HNSCC patients (Figure 3A). When comparing the SEC62 and SOX2 expression in the lymph node metastases for all patients grouped according to the histologically proven N stages (pN1, pN2, pN3), the SEC62 expression levels showed a stepwise increase, and the SOX2 expression levels demonstrated a stepwise decrease when proceeding to higher N stages (Figure 3B).
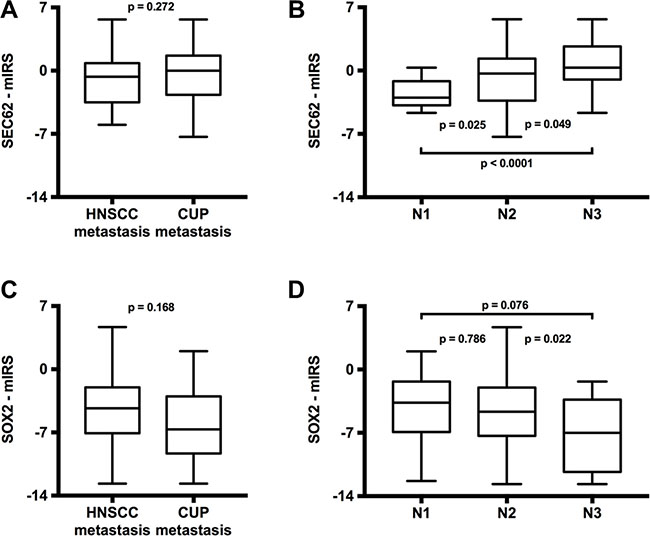
Figure 3: Comparison of SEC62 and SOX2 expression between lymph node metastases of HNSCC and CUP patients (A and C) and between different N-stages (B and D). The SEC62-mIRS (A) and SOX2-mIRS (C) for the lymph node metastases of HNSCC patients compared with the lymph node metastases of CUP patients and for all included patients grouped according to their N-stages (B and D) are shown using box and whisker blots. Each box represents the range from the first quartile to the third quartile. The median is indicated by a line. The whiskers outside the boxes represent the ranges from the minimum to the maximum value of each group.
Effect of SEC62 and SOX2 expression on the proliferation and migration of UM-SCC1 cells
To determine whether different expression levels of SEC62 and SOX2 affect tumor cell biology, as indicated by our immunohistochemical analyses, we performed functional analyses using UM-SCC1 cells as an in vitro model. First, we tested the cells for chromosomal gains and losses using CGH and analyzed both the gene copy number and the expression of SEC62 and SOX2 on the protein level using FISH, immunocytochemistry and western blot analyses (Figures 3, 4). Thus, we found gains on the whole chromosomal 3q region, including 3q26 (Figure 3A), amplifications of the SEC62 and SOX2 genes (Figure 3B) and high SEC62 expression at the protein level (Figure 3C) without any expression of SOX2 (Figure 3D). In karyotyping, all of the investigated UM-SCC1 cells showed a trisomy of chromosome 3. Following this characterization of UM-SCC1 cells, we reduced the SEC62 protein level in these cells using siRNA transfection and then analyzed their proliferative and migratory potential using the xCELLigence (Roche) and FluoroBlok system (BD Falcon). We found a markedly decreased migration potential of the Sec62-depleted cells without any significant change in cell proliferation compared with control siRNA transfected cells (Figure 5). By contrast, the SEC62 overexpression induced by plasmid transfection resulted in a stimulation of cell migration compared with control plasmid-transfected cells without affecting cell proliferation. Because the UM-SCC1 cells showed no SOX2 expression at the protein level (Figure 5D), we were restricted to analyzing the effect of SOX2 overexpression on the migration and proliferation of the cells. We found that SOX2 overexpression resulted in an increased migratory potential, without affecting cell proliferation (Figure 5).
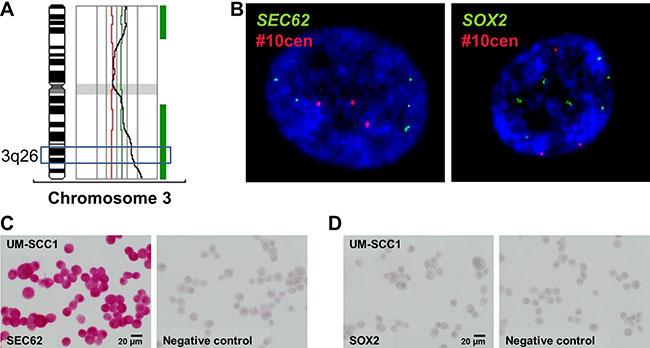
Figure 4: Analysis of copy number variations and expression level of SEC62 and SOX2 in UM-SCC1 cells. (A) CGH analysis showed gains on the long arm of chromosome 3 (3q), including the 3q26 region. (B) FISH analysis showed amplifications of the SEC62 gene (green signals, left picture) and the SOX2 gene (green signals, right picture). A probe directed against the centromere region of chromosome 10 (#10cen) was used as an internal hybridization control (red signals). Nuclei (60× magnification) were counterstained with DAPI. At the protein level, we observed a strong SEC62 expression (C) but no SOX2 expression using immunocytochemistry (D).
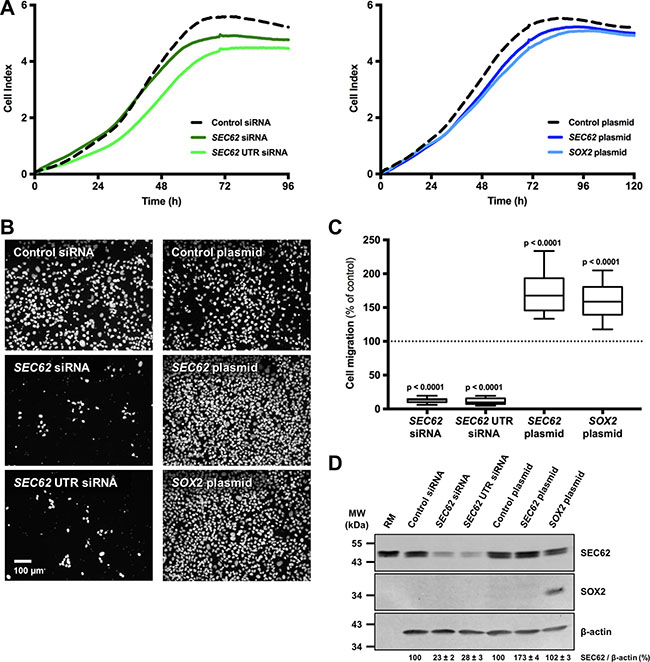
Figure 5: Effect of SEC62 and SOX2 expression on the proliferation and migration of UM-SCC1 cells. The expression level of SEC62 and SOX2 was modified in UM-SCC1 cells using siRNA- and plasmid-transfection. (A) The cell index was measured as an indicator for cell proliferation of UM-SCC1 cells transfected with either two different SEC62-siRNAs, a SEC62-plasmid or SOX2-plasmid and compared with cells transfected with control siRNA or a control plasmid. (B) The cells that migrated through the 8-μm pores of the insert system were fixed and marked with DAPI (white dots). Representative images are shown for the transfected cells. (C) The number of migrated cells was quantified and is presented as a percentage of the respective control cells (= 100%) using box and whisker blots. Each box represents the range from the first quartile to the third quartile. The median is indicated by a line. The whiskers outside the boxes represent the ranges from the minimum to the maximum value of each group. (D) SEC62 and SOX2 protein levels of the cells were measured using western blot analyses at the end (72 h) of the migration experiments. Rough microsomes (RM) served as positive control for Sec62. The relative expression of SEC62 per β-actin is indicated at the bottom as mean value of three identically performed experiments (n = 3) with the respective standard error.
SEC62 and SOX2 are prognostic biomarkers in HNSCC and CUP patients
Following the functional analyses indicating an effect of SEC62 and SOX2 expression on cell migration, we correlated the results of the immunohistochemical SEC62 and SOX2 expression analyses in the lymph node metastases of the included HNSCC and CUP patients with their survival data (Figure 6). A high expression level of SEC62 (SEC62-mIRS ≥ 0) was significantly correlated with a shorter overall survival (p < 0.0001; log-rank test), whereas high expression levels of SOX2 (SOX2-mIRS > -5) indicated a longer overall survival (p = 0.002; log-rank test). When combining both markers, patients with low SEC62 expression and high SOX2 expression showed the best prognosis, followed by patients with low expression of both genes, patients with high expression of both genes and patients with high SEC62 expression and low SOX2 expression.
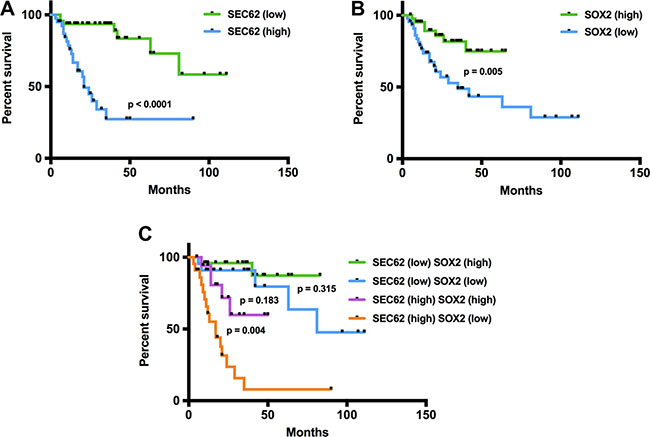
Figure 6: Prognostic relevance of SEC62 and SOX2 expression levels in cervical lymph node metastases of HNSCC and CUP patients. In the Kaplan-Meier analysis, high SEC62 expression and low SOX2 expression were predictors of worse prognosis (A, B). A combination of both biomarkers showed an even higher prognostic relevance with the worst prognosis for patients who had a high SEC62 and low SOX2 expression level (C).
DISCUSSION
3q26 amplification represents a highly frequent chromosomal alteration in HNSCCs [11, 12] and encodes the genes SEC62 and SOX2, which have both been shown to be overexpressed in various cancers [13–15, 45], including HNSCCs [27, 35, 46], and to affect the metastatic potential of cancer cells [22, 23, 26, 37, 39–42, 44, 47]. Moreover, the expression levels of both genes in tumor tissue showed prognostic relevance in HNSCC patients [37, 35, 42, 48, 49]. However, the available data are limited to only a few studies with a small number of patients, particularly for SOX2, which showed contradictory results. In our study, we investigated the expression level of SEC62 and SOX2 in tissue specimens of HNSCC and CUP patients and examined their effect on the migration and proliferation of HNSCC cells in vitro as well as the patients’ survival data to determine their role in the process of lymphatic metastasis in HNSCC patients and their contribution to CUP biology.
When comparing the expression levels of SEC62 and SOX2 in the primary tumor tissue of HNSCC patients with adjacent tumor-free oral mucosa, for all cases, we found a higher expression level in tumor cells than in the healthy keratinocytes (Figure S1). These data were strongly consistent with previous studies focused on the expression of SEC62 [27] and SOX2 [30, 35] in healthy and cancerous tissue of the head and neck region and consistently showed an overexpression of both genes in HNSCC tissue.
For SOX2, immunohistochemical analyses revealed significantly lower expression in the metastases of HNSCC patients compared with the respective primary tumor (p < 0.0001; Figure 2D), a significantly lower expression in the metastases of CUP compared with HNSCC patients (p = 0.01; Figure 3A) and a gradual decrease in the expression level from N1 to N3 cervical lymph node status (Figure 3B). These data indicated the stimulation of lymphatic metastasis in HNSCC patients by low expression levels of SOX2. Comparable results have been published by other groups for both gastric cancer patients [44] and HNSCC patients [41, 42] in terms of a significant correlation between high SOX2 expression levels and a negative lymph node status. However, our functional analyses on UM-SCC1 cells did not support this hypothesis; by contrast, we showed stimulation of cell migration when the SOX2 gene was overexpressed by plasmid transfection (Figure 5). Similar effects of SOX2 overexpression on the migration of HNSCC cells have previously been reported by other groups [37, 39, 40, 47], and an inhibitory effect of SOX2 overexpression on HNSCC cell migration has also been published [42]. Ultimately, the precise effect of SOX2 on the migration and metastasis of HNSCC cells remains unclear because the results of the available studies, including our own study, are contradictory. Potential explanations for these discrepancies in the descriptive analyses of the patient tissue and in cell culture experiments could be the heterogeneity of the relatively small patient cohorts, the molecular diversity of the applied HNSCC cell lines or the different methods that were used for SOX2 down- and upregulation. Finally, further studies enrolling a larger number of patients and a wider spectrum of different HNSCC cell lines are needed to uncover the role of SOX2 on the lymphatic metastasis of HNSCCs.
For SEC62, immunohistochemical analyses of the tissue specimens revealed a tendency towards higher expression levels in the lymph node metastases of HNSCC patients compared with their respective primary tumor (Figure 2C), a tendency towards higher expression in the lymph node metastases of CUP compared with HNSCC patients (Figure 3A) and a gradually increasing expression level from N1 to N3 cervical lymph node status (Figure 3B). Taken together, these data indicate the stimulation of lymphatic metastasis in HNSCC and CUP patients by high SEC62 expression levels, although these correlation analyses did not reach a comparably high significance, as shown for SOX2. Consistent with these findings, we found stimulation of the migratory potential of UM-SCC1 cells when the SEC62 gene was overexpressed and an inhibition of cell migration following SEC62 silencing without any effect on cell proliferation (Figure 5). These data were strongly consistent with the findings obtained in previous studies, which reported a correlation of high SEC62 expression levels with a positive lymph node status in NSCLC patients [23], a stimulation of the migratory potential of HEK293 cells by SEC62 overexpression and inhibition of the migration of prostate cancer, glioblastoma, NSCLC and fibrosarcoma cells by SEC62 silencing [26]. However, the mechanism underlying how SEC62 influences the cellular process of migration and subsequent lymphatic metastasis remains unclear. Uncovering this missing link between SEC62 and cell migration is essential for developing molecular strategies that can inhibit the migration-stimulating function of SEC62 and will be addressed in future studies.
Finally, the analysis of the patients’ survival data showed a prognostic relevance for SEC62 and SOX2 in terms of a significantly longer overall survival when the SEC62 gene was expressed at a low level (p < 0.0001) and the SOX2 gene was expressed at a high level (p = 0.003) in the lymph node metastases of HNSCC and CUP patients (Figure 6). For SEC62, these data confirmed our previously reported findings for a smaller cohort of HNSCC patients, in which we analyzed SEC62 expression in tissue specimens of the primary tumor [27]. For SOX2, some studies were consistent with our results and reported a better outcome of HNSCC patients with high SOX2 expression levels in the primary tumor [42, 48, 49]. By contrast, other studies found a worse prognosis for HNSCC patients with high SOX2 expression in the primary tumor [35, 50]. However, these findings are only partially comparable to our results because no previous study has addressed the prognostic relevance of SEC62 and SOX2 expression in the lymph node metastases of HNSCC patients. Finally, the significance of SOX2 as a prognostic biomarker in HNSCC patients remains unclear, as the currently published studies are contradictory, although the majority of these studies reported high SOX2 expression levels as an adverse prognostic factor in this tumor [50].
Taken together, this study has shown that the expression of both SEC62 and SOX2 shows differences between the primary tumor and lymph node metastases of HNSCC patients and between the lymph node metastases of HNSCC and CUP patients. This may potentially contribute to the different clinical courses of these two tumors because functional analyses revealed a crucial effect of both genes on the migration of HNSCC cells. Furthermore, we found prognostic relevance for the expression level of both genes in the lymph node metastases of HNSCC and CUP patients. However, how this knowledge can be transferred to the clinical management of HNSCC patients and whether SEC62 and SOX2 can be used as therapeutic targets in this entity will be addressed in future studies.
MATERIALS AND METHODS
Patient characteristics and tissue samples
In total, 65 HNSCC patients and 29 CUP syndrome patients were enrolled in this study. For both groups, the patients were matched for age and gender. For further analyses, formalin-fixed paraffin-embedded (FFPE) tissue samples of cervical lymph node metastases, and for HNSCC patients, samples from the primary tumor were obtained.
For all included cases, the histological diagnosis was squamous cell carcinoma (SCC). The primary tumor localizations for the HNSCC group were tonsil (n = 24), tongue base (n = 14), hypopharynx (n = 12), larynx (n = 10), floor of the mouth (n = 4) and tongue border (n = 1). The median follow-up time for all patients was 30 months (31 months for the HNSCC group and 29 months for the CUP group). The Saarland Medical Association ethics review committee approved the scientific use of the patients’ tissue and clinical data. All experiments were performed according to relevant guidelines and regulations. Written informed consent was obtained from all patients.
Immunohistochemistry
FFPE tissue sections were obtained and used for immunohistochemical staining of Sec62 and Sox2. After omitting the first three 10-μm sections, consecutive 4-μm sections were obtained using a Leica RM 2235 rotary microtome (Leica Microsystems, Wetzlar, Germany), transferred onto Superfrost Ultra Plus microscope slides (Menzel-Gläser, Braunschweig, Germany) and dried in an incubator at 65°C overnight. Upon deparaffinization, heat-induced epitope retrieval was performed by microwave treatment in 10 mM citrate buffer (pH 6.0) and unspecific protein binding sites were blocked by incubation in 80 ml 0.1 M Tris/HCl (pH 7.2), 3 g BSA (Sigma Aldrich, St. Louis, MO, USA) and 20 ml FCS (Sigma Aldrich, St. Louis, MO, USA) for 30 min at room temperature. Subsequently, primary antibody incubation was performed using the same antibodies as described for western blot for 1 h at room temperature. For each staining series, a specimen taken from a subcutaneously grown tumor in mice after local injection of UM-SCC1 cells (SEC62) and a human high-grad glioma (SOX2) were used as positive and negative controls by omitting the primary antibody. Visualization was performed using the REAL™ detection system Alkaline Phosphatase (Dako Agilent Technologies, Glostrup, Denmark), according to the manufacturer’s instructions, and the slides were counterstained with hematoxylin (Dako Agilent Technologies, Glostrup, Denmark). SEC62- and SOX2-immunoreactivity was evaluated using a modified immunoreactive score (IRS) according to Remmele and Stegner [51]. Because the majority of tumors did not show complete uniform staining reactivity, we decided to modify the conventional IRS to be able to evaluate different staining intensities on a single slide. Thus, we first identified two areas of the specimen that were representative for the two major staining intensities of the whole slide. Both areas were then evaluated according to the conventional IRS with a score ranging from 0 to 12. The modified IRS (mIRS) was calculated as the sum of both single scores ranging from a minimum of 0 to a maximum of 14. Thus, the percentage of evaluated cells in total did not exceed 100%, which explains why the mIRS cannot exceed a value of 14. Finally, the mIRS for each specimen was related to the mIRS of the respective positive control by calculating the difference between both scores (mIRSfinal = mIRSpositive control – mIRS case), resulting in the final mIRS values ranging from a minimum of -14 to a maximum of 14.
Immunocytochemistry
For the immunocytochemical detection of SEC62 and SOX2 in UM-SCC1 cells, slides from UM-SCC1 cells suspended in 20 ml PreservCyt solution were prepared using the ThinPrep®-system (Hologic Deutschland GmbH, Wiesbaden, Germany) and dried for 30 min at room temperature. Following rehydration in distilled water and a three-fold wash step in phosphate buffered saline (PBS), samples were fixed in formalin for 15 minutes. Next, epitope unmasking was performed by incubation with Target Retrieval Solution (Dako GmbH, Glostrup, Denmark) at 95°C for 30 min. After cooling to room temperature and three consecutive washing steps with PBS, unspecific binding sites were blocked with 3% BSA (bovine serum albumin) in PBS and the slides were incubated with the primary antibody (1:400 dilution in 3% BSA/PBS) for 30 min at room temperature. The same antibodies as described for western blot were used. Visualization was performed using the Dako REAL™ Detection System Alkaline Phosphatase/RED (Dako GmbH; Glostrup, Denmark) according to the manufacturer’s instructions. Finally, the slides were counterstained with hematoxylin. Each analysis included negative controls by omission of the primary antibody. Slides were imaged using the Nikon Eclipse TE2000-S inverted microscope, Nikon Digital Sight DS-5Mc camera and NIS-Elements AR software version 3.2 (Nikon; Tokyo, Japan).
HPV testing
To determine the involvement of HPV in the carcinogenesis of the HNSCC and CUP patients, we used a combination of HPV-DNA-PCR and a simultaneous immunohistochemical detection of p16 and Ki67 as recently described [52].
First, DNA was extracted from the FFPE samples using the QIAamp DNA Blood Mini Kit (Qiagen, Hilden, Germany) according to the manufacturer`s instructions. HPV-PCR was performed with the LightCycler 2.0 instrument (Roche, Mannheim, Germany) using the GP5+/6+ primers as described by De Roda Husman et al. [53]. SYBR green as well as gel electrophoresis were used for detection. After initial denaturation at 95°C for 15 min, 45 PCR cycles followed with denaturation at 95°C for 10 s, annealing at 45°C for 5 s and elongation at 72°C for 18 s. After amplification, a melting curve was performed at temperatures between 45°C and 95°C, with temperature increasing at a rate of 0.2°K s−1. Tm for the HPV16-positive control was 79°C and 82°C for the HPV18-positive control. Glyceraldehyde 3-phosphate dehydrogenase (GAPDH) PCR was performed in parallel for each sample as a control as described in Ruprecht et al. [54].
Second, for the simultaneous p16-Ki67 immuno- histochemical staining the CINtec® PLUS kit (Roche mtm Laboratories, Heidelberg, Germany) was applied according to the manufacturer’s instructions. Each analysis included positive and negative controls.
Only tumors with a positive HPV-DNA-PCR result as well as a dual expression of p16 and Ki67 were rated as positive.
Cell culture and transfection
For the cell culture experiments, UM-SCC1 cells derived from a squamous cell carcinoma of the floor of the mouth were cultured in DMEM (Gibco Invitrogen, Karlsruhe, Germany) containing 10% fetal bovine serum (FBS; Biochrom, Berlin, Germany) and 1% penicillin/streptomycin (PAA, Pasching, Austria) in a humidified environment with 5% CO2 at 37°C. The cell line was authenticated by the German Collection of Microorganisms and Cell Culture (DSMZ) using multiplex PCR of minisatellite markers, isoelectric focusing and karyotyping in march 2016.
For gene silencing, 5.2 × 10⁵ UM-SCC1 cells were seeded onto 6-cm dishes and transfected with SEC62-siRNA (GGCUGUGGCCAAGUAUCUUtt; Ambion, TX, USA), siRNA directed against the 3’ untranslated region of SEC62 (CGUAAAGUGUAUUCUGUACtt; Ambion, TX, USA) or control siRNA (AllStars Neg. control siRNA; Qiagen, Hilden, Germany) using HiPerFect Transfection Reagent (Qiagen, Hilden, Germany) according to the manufacturer’s instructions. After 24 h, the medium was changed, and the cells were transfected again for an additional 24 h.
For the overexpression studies, 5.2 × 10⁵ UM-SCC1 cells were seeded onto 6-cm dishes. After 24 h, the cells were transfected with either the IRES-GFP-SEC62 plasmid (SEC62 plasmid), the IRES-GFP-SOX2 plasmid (SOX2 plasmid) or the negative control IRES-GFP plasmid (Control plasmid) using the X-tremeGENE HP DNA Transfection Reagent (Roche Diagnostics GmbH, Mannheim, Germany) according to the manufacturer’s instructions. For all plasmids, pcDNA3 served as the parent plasmid.
Western blot analyses
2 × 10⁵ cells were lysed in a lysis buffer (aqua dest. + 10 mM NaCl/10 mM Tris (hydroxymethyl)-aminomethan/3 mM MgCl2/5 % NP-40) and proteins were resolved by SDS-PAGE and identified by immunoblotting. We used an affinity-purified polyclonal rabbit anti-peptide antibody directed against the C terminus of human SEC62 (self-made), a polyclonal rabbit antibody directed against the C terminus of human SOX2 (abcam pic, Cambridge, UK) and a monoclonal mouse antibody directed against the N terminus of human b-actin (Sigma-Aldrich Co., St. Louis, MO, USA). The secondary antibodies used were ECL Plex goat anti-rabbit Cy5 or anti-mouse Cy3 conjugates (GE Healthcare, Munich, Germany). Blots were imaged using the Typhoon-Trio system and Image Quant TL software 7.0 (GE Healthcare, Munich, Germany). The SEC62, SOX2 and β-actin levels were quantified and normalized against β-actin.
Comparative genomic hybridization (CGH)
CGH was performed as previously described [27]. Briefly, DNA from UM-SCC1 cells and reference DNA from the blood of a healthy donor were obtained using standard phenol/chloroform extraction, labeled with biotin and digoxigenin by nick translation according to the manufacturer’s protocol (Roche Diagnostics, Mannheim, Germany). Hybridization was performed together with COT-1 DNA (Roche Diagnostics) to normal chromosome metaphase spreads from peripheral blood lymphocytes prepared using the following standard procedures. Post-hybridization washes were performed with 50% formamide/2× standard saline citrate (SSC), 2× SSC and 0.1 × SSC at 45°C. DNA was visualized with fluorescein-isothiocyanate (FITC, Vector Laboratories, Burlingame, CA) and rhodamine (Roche Diagnostics), respectively, and counterstained with a DAPI (4, 6-diamidino-2-phenylindole) anti-fade solution (Vector Laboratories). Fluorescence images were captured using a fluorescence microscope Olympus BX 61 and image processing was performed using the ISIS digital image analysis software system (MetaSystems, Altlussheim, Germany). Average ratio profiles were determined from the analysis of 12–15 metaphases.
Fluorescence in situ hybridization (FISH)
UM-SCC1 cell culture slides were fixed using methanol/acetic acid (3:1) and pretreated with RNase A and pepsin [Sigma-Aldrich, Munich, Germany]. Next, the sections were rinsed in PBS at room temperature, followed by 4% paraformaldehyde/PBS, dehydrated, and air-dried. Bacterial artificial chromosome clones (BAC) for SEC62 (RP11-379K17) and SOX2 (RP11-203N24) purchased from ImaGenes (Berlin, Germany) were extracted using the NucleoBond® PC100 Kit (Macherey-Nagel, Dueren, Germany). BAC clones were labeled by BioPrime® DNA Labeling System (Invitrogen™, Life Technologies, Darmstadt, Germany) and a centromeric probe for chromosome 10 (D10Z3) as an internal hybridization control was labeled with digoxigenin by nick translation (Roche Diagnostics GmbH, Mannheim, Germany) according to the manufacturer´s instructions. Dual color hybridization was performed in 50% formamide/2× SSC and COT-1 DNA (Roche Diagnostics) at 37°C overnight. Stringency washes were performed three times in 50 % formamide/2 × SSC at 42°C and two times in 2× SSC at 42°C. Immunofluorescence detection of the biotin signals was performed using Streptavidin-FITC and biotinylated anti-Streptavidin [Vector Laboratories, Burlingame, CA] for digoxigenin using anti-dig-Cy3 (Roche Diagnostics GmbH, Mannheim, Germany), and the nuclei were counterstained with a DAPI anti-fade solution (Vector Laboratories, Burlingame, CA, USA).
Real-time cell proliferation analysis
The xCELLigence SP system (Roche Diagnostics GmbH, Mannheim, Germany) was used for the real-time analysis of cell proliferation. This system measures the changes in impedance in specific plates, with micro electrodes covering the well bottoms (E-plates, Roche Diagnostics GmbH, Mannheim, Germany). The relative changes were recorded as the Cell Index, which is a dimensionless parameter. 1 × 10⁴ UM-SCC1 cells were transfected with either siRNA or plasmids and seeded onto a 96-well e-plate according to the manufacturer’s instructions. Cells transfected with siRNA were seeded 24 h after the second transfection. Cells transfected with plasmids were seeded 24 h after the plasmid transfection. Cell proliferation was monitored for 120 h, and the data were evaluated using the RTCA 2.0 software (Roche Diagnostics GmbH, Mannheim, Germany). All cell proliferation experiments were repeated three-fold (n = 3), and at least a triplicate of every cell population was analyzed in each experiment.
Migration potential analysis
Cell migration was analyzed using the BD Falcon FluoroBlok system (BD, Franklin Lakes, NJ, USA) with 8-μm pore inserts for 24-well plates. 5 × 10⁴ UM-SCC1 cells transfected with either siRNA or plasmids were loaded into the inserts in normal medium containing 1% FBS. The inserts were then placed in the wells of a 24-well plate in medium with either 10% FBS as a chemoattractant for migration or without FBS (negative control). After 72 h, the cells were fixed with methanol, the nuclei were counterstained with DAPI and the number of migrated cells was analyzed using a bottom reading fluorescence microscope. Three representative images of each insert were obtained, and the number of migrated cells was quantified using NIS-Elements AR software version 3.2 (Nikon, Tokyo, Japan). All cell migration experiments were repeated three-fold (n = 3), and a triplicate of every cell population was analyzed in each experiment.
Statistical analysis
Statistical analysis of the overall survival was performed using the Mantel-Cox test (log-rank test) using GraphPad Prism 6.0h and 7.0 (GraphPad Software, La Jolla, CA, USA). Analysis of the immune reactive scores was performed using the D’Agostino & Pearson normality test and a two-sided Mann-Whitney test. Analysis of cell proliferation and migration was performed using the D’Agostino & Pearson normality test and a two-sided, unpaired Student’s t-test. P-values < 0.05 were considered statistically significant (α = 0.05).
ACKNOWLEDGMENTS
The excellent technical assistance of Ulrike Bechtel, Monika Hoffmann and Barbara Linxweiler is gratefully acknowledged.
CONFLICTS OF INTEREST
None to declare.
GRANT SUPPORT
This study was supported by a HOMFOR (Homburger Forschungsföderungsprogramm) grant to ML.
REFERENCES
1. Ferlay J, Shin HR, Bray F, Forman D, Mathers C, Parkin DM. Estimates of worldwide burden of cancer in 2008: GLOBOCAN 2008. Int J Cancer. 2010; 127:2893–2917.
2. Parkin DM, Bray F, Ferlay J, Pisani P. Global cancer statistics, 2002. CA Cancer J Clin. 2005; 55:74–108.
3. Magnano M, Bongioannini G, Lerda W, Canale G, Tondolo E, Bona M, Viora L, Gabini A, Gabriele P. Lymphnode metastasis in head and neck squamous cells carcinoma: multivariate analysis of prognostic variables. J Exp Clin Cancer Res. 1999; 18:79–83.
4. Pavlidis N, Pentheroudakis G. Cancer of unknown primary site. Lancet. 2012; 379:1428–1435.
5. Petrakis D, Pentheroudakis G, Voulgaris E, Pavlidis N. Prognostication in cancer of unknown primary (CUP): development of a prognostic algorithm in 311 cases and review of the literature. Cancer Treat Rev. 2013; 39:701–708.
6. D’Souza G, Kreimer AR, Viscidi R, Pawlita M, Fakhry C, Koch WM, Westra WH, Gillison ML. Case-control study of human papillomavirus and oropharyngeal cancer. New Engl J Med. 2007; 356:1944–1956.
7. Pavlidis N, Pentheroudakis G, Plataniotis G. Cervical lymph node metastases of squamous cell carcinoma from an unknown primary site: a favourable prognosis subset of patients with CUP. Clinical Transl Oncol. 2009; 11:340–348.
8. Marur S, D’Souza G, Westra WH, Forastiere AA. HPV-associated head and neck cancer: a virus-related cancer epidemic. Lancet Oncol. 2010; 11:781–789.
9. Jereczek-Fossa BA, Jassem J, Orecchia R. Cervical lymph node metastases of squamous cell carcinoma from an unknown primary. Cancer Treat Rev. 2004; 30:153–164.
10. Kamposioras K, Pentheroudakis G, Pavlidis N. Exploring the biology of cancer of unknown primary: breakthroughs and drawbacks. Eur J Clin Invest. 2013; 43:491–500.
11. Bockmühl U, Schwendel A, Dietel M, Petersen I: Distinct patterns of chromosomal alterations in high- and low-grade head and neck squamous cell carcinomas. Cancer Res. 1996; 56:5325–5329.
12. Abou-Elhamd KE, Habib TN. The role of chromosomal aberrations in premalignant and malignant lesions in head and neck squamous cell carcinoma. Eur Arch Otorhinolaryngol. 2008; 265:203–207.
13. Chujo M, Noguchi T, Miura T, Arinaga M, Uchida Y, Tagawa Y. Comparative genomic hybridization analysis detected frequent overrepresentation of chromosome 3q in squamous cell carcinoma of the lung. Lung cancer. 2002; 38:23–29.
14. Caraway NP, Khanna A, Dawlett M, Guo M, Guo N, Lin E, Katz RL. Gain of the 3q26 region in cervicovaginal liquid-based pap preparations is associated with squamous intraepithelial lesions and squamous cell carcinoma. Gynecol Oncol. 2008; 110:37–42.
15. Yen CC, Chen YJ, Pan CC, Lu KH, Chen PC, Hsia JY, Chen JT, Wu YC, Hsu WH, Wang LS, Huang MH, Huang BS, Hu CP et al. Copy number changes of target genes in chromosome 3q25.3-qter of esophageal squamous cell carcinoma: TP63 is amplified in early carcinogenesis but down-regulated as disease progressed. World J Gastroenterol. 2005; 11:1267–1272.
16. Comtesse N, Keller A, Diesinger I, Bauer C, Kayser K, Huwer H, Lenhof HP, Meese E. Frequent overexpression of the genes FXR1, CLAPM1 and EIF4G located on amplicon 3q26–27 in squamous cell carcinoma of the lung. Int J Cancer. 2007; 120:2538–2544.
17. Yamamoto H, Shigematsu H, Nomura M, Lockwood WW, Sato M, Okumura N, Soh J, Suzuki M, Wistuba II, Fong KM, Lee H, Toyooka S, Date H. et al. PIK3CA mutations and copy number gains in human lung cancers. Cancer Res. 2008; 68:6913–6921.
18. Bauer C, Brass N, Diesinger I, Kayser K, Grasser FA, Meese E. Overexpression of the eukaryotic translation initiation factor 4G (eIF4G-1) in squamous cell lung carcinoma. Int J Cancer. 2002; 98:181–185.
19. Massion PP, Taflan PM, Jamshedur Rahman SM, Yildiz P, Shyr Y, Edgerton ME, Westfall MD, Roberts JR, Pietenpol JA, Carbone DP, Gonzalez AL. Significance of p63 amplification and overexpression in lung cancer development and prognosis. Cancer Res. 2003; 63:7113–7121.
20. Lakkaraju AK, Thankappan R, Mary C, Garrison JL, Taunton J, Strub K. Efficient secretion of small proteins in mammalian cells relies on Sec62-dependent posttranslational translocation. Mol Biol Cell. 2012; 23: 2712–2722.
21. Lang S, Benedix J, Fedeles SV, Schorr S, Schirra C, Schäuble N, Jalal C, Greiner M, Hassdenteufel S, Tatzelt J, Kreutzer B, Edelmann L, Krause E et al. Different effects of Sec61α, Sec62 and Sec63 depletion on transport of polypeptides into the endoplasmic reticulum of mammalian cells. J Cell Sci. 2012; 125:1958–1969.
22. Linxweiler M, Schorr S, Schäuble N, Jung M, Linxweiler J, Langer F, Schäfers HJ, Cavalié A, Zimmermann R, Greiner M. Targeting cell migration and the endoplasmic reticulum stress response with calmodulin antagonists: a clinically tested small molecule phenocopy of SEC62 gene silencing in human tumor cells. BMC Cancer. 2013; 13:574. doi: 10.1186/1471–2407–13–574.
23. Linxweiler M, Linxweiler J, Barth M, Benedix J, Jung V, Kim YJ, Bohle RM, Zimmermann R, Greiner M. Sec62 bridges the gap from 3q amplification to molecular cell biology in non-small cell lung cancer. Am J Pathol. 2012; 180:473–483.
24. Weng L, Du J, Zhou Q, Cheng B, Li J, Zhang D, Ling C. Identification of cyclin B1 and Sec62 as biomarkers for recurrence in patients with HBV-related hepatocellular carcinoma after surgical resection. Mol Cancer. 2012; 11:39. doi: 10.1186/1476–4598–11–39.
25. Greiner M, Kreutzer B, Lang S, Jung V, Cavalié A, Unteregger G, Zimmermann R, Wullich B. Sec62 protein level is crucial for the ER stress tolerance of prostate cancer. Prostate. 2011; 71:1074–1083.
26. Greiner M, Kreutzer B, Jung V, Grobholz R, Hasenfus A, Stöhr RF, Tornillo L, Dudek J, Stöckle M, Unteregger G, Kamradt J, Wullich B, Zimmermann R. Silencing of the SEC62 gene inhibits migratory and invasive potential of various tumor cells. Int J Cancer. 2011; 128:2284–2295.
27. Wemmert S, Lindner Y, Linxweiler J, Wagenpfeil S, Bohle RM, Niewald M, Schick B. Sec62 as a new biomarker for poor prognosis in advanced head and neck squamous cell carcinoma. Oncol Lett. 2016; 11:1661–1670.
28. Takahashi K, Tanabe K, Ohnuki M, Narita M, Ichisaka T, Tomoda K, Yamanaka S. Induction of pluripotent stem cells from adult human fibroblasts by defined factors. Cell. 2007; 131:861–872.
29. Kashyap V, Rezende NC, Scotland KB, Shaffer SM, Persson JL, Gudas LJ, Mongan NP. Regulation of stem cell pluripotency and differentiation involves a mutual regulatory circuit of the NANOG, OCT4, and SOX2 pluripotency transcription factors with polycomb repressive complexes and stem cell microRNAs. Stem Cells Dev. 2009; 18:1093–1108.
30. Kokalj Vokač N, Cizmarević B, Zagorac A, Zagradišnik B, Lanišnik B. An evaluation of SOX2 and hTERC gene amplifications as screening markers in oral and oropharyngeal squamous cell carcinomas. Mol Cytogenet. 2014; 7:5. doi: 10.1186/1755–8166–7-5.
31. Bass AJ, Watanabe H, Mermel CH, Yu S, Perner S, Verhaak RG, Kim SY, Wardwell L, Tamayo P, Gat-Viks I, Ramos AH, Woo MS, Weir BA et al. SOX2 is an amplified lineage-survival oncogene in lung and esophageal squamous cell carcinomas. Nature Genet. 2009; 41:1238–1242.
32. Maier S, Wilbertz T, Braun M, Scheble V, Reischl M, Mikut R, Menon R, Nikolov P, Petersen K, Beschorner C, Moch H, Kakies C, Protzel C et al. SOX2 amplification is a common event in squamous cell carcinomas of different organ sites. Human Pathol. 2011; 42:1078–1088.
33. Hussenet T, Dali S, Exinger J, Monga B, Jost B, Dembelé D, Martinet N, Thibault C, Huelsken J, Brambilla E, du Manoir S. SOX2 is an oncogene activated by recurrent 3q26.3 amplifications in human lung squamous cell carcinomas. PLoS One. 2010; 5:e8960. doi: 10.1371/journal.pone.0008960.
34. Justilien V, Walsh MP, Ali SA, Thompson EA, Murray NR, Fields AP. The PRKCI and SOX2 oncogenes are coamplified and cooperate to activate Hedgehog signaling in lung squamous cell carcinoma. Cancer Cell. 2014; 25:139–151.
35. Huang CF, Xu XR, Wu TF, Sun ZJ, Zhang WF. Correlation of ALDH1, CD44, OCT4 and SOX2 in tongue squamous cell carcinoma and their association with disease progression and prognosis. Journal Oral Pathol Med. 2014; 43:492–498.
36. Du L, Yang Y, Xiao X, Wang C, Zhang X, Wang L, Zhang X, Li W, Zheng G, Wang S, Dong Z. Sox2 nuclear expression is closely associated with poor prognosis in patients with histologically node-negative oral tongue squamous cell carcinoma. Oral Oncol. 2011; 47:709–713.
37. Yang F, Gao Y, Geng J, Qu D, Han Q, Qi J, Chen G. Elevated expression of SOX2 and FGFR1 in correlation with poor prognosis in patients with small cell lung cancer. Int J Clin Exp Pathol. 2013; 6:2846–2854.
38. Michifuri Y, Hirohashi Y, Torigoe T, Miyazaki A, Kobayashi J, Sasaki T, Fujino J, Asanuma H, Tamura Y, Nakamori K, Hasegawa T, Hiratsuka H, Sato N. High expression of ALDH1 and SOX2 diffuse staining pattern of oral squamous cell carcinomas correlates to lymph node metastasis. Pathol Int. 2012; 62:684–689.
39. Yang N, Hui L, Wang Y, Yang H, Jiang X. SOX2 promotes the migration and invasion of laryngeal cancer cells by induction of MMP-2 via the PI3K/Akt/mTOR pathway. Oncol Rep. 2014; 31:2651–2659.
40. Yang N, Hui L, Wang Y, Yang H, Jiang X. Overexpression of SOX2 promotes migration, invasion, and epithelial-mesenchymal transition through the Wnt/ß-catenin pathway in laryngeal cancer Hep-2 cells. Tumour Biol. 2014; 35:7965–7973.
41. Züllig L, Roessle M, Weber C, Graf N, Haerle SK, Jochum W, Stoeckli SJ, Moch H, Huber GF. High sex determining region Y-box 2 expression is a negative predictor of occult lymph node metastasis in early squamous cell carcinomas of the oral cavity. Eur J Cancer. 2013; 49:1915–1922.
42. Bayo P, Jou A, Stenzinger A, Shao C, Gross M, Jensen A, Grabe N, Mende CH, Rados PV, Debus J, Weichert W, Plinkert PK, Lichter P et al. Loss of SOX2 expression induces cell motility via vimentin up-regulation and is an unfavourable risk factor for survival of head and neck squamous cell carcinoma. Mol Oncol. 2015; 9:1704–1719.
43. Wilbertz T, Wagner P, Petersen K, Stiedl AC, Scheble VJ, Maier S, Reischl M, Mikut R, Altorki NK, Moch H, Fend F, Staebler A, Bass AJ et al. SOX2 gene amplification and protein overexpression are associated with better outcome in squamous cell lung cancer. Modern Pathol. 2011; 24:944–953.
44. Chen Y, Huang Y, Zhu L, Chen M, Huang Y, Zhang J, He S, Li A, Chen R, Zhou J. SOX2 inhibits metastasis in gastric cancer. J Cancer Res Clin Oncol. 2016; 142:1221–30.
45. Fields AP, Justilien V, Murray NR. The chromosome 3q26 OncCassette: A multigenic driver of human cancer. Adv Biol Regul. 2016; 60:47–63.
46. Qiao B, He B, Cai J, Yang W. The expression profile of Oct4 and Sox2 in the carcinogenesis of oral mucosa. Int J Clin Exp Pathol. 2013; 7:28–37.
47. Yang N, Wang Y, Hui L, Li X, Jiang X. Silencing SOX2 Expression by RNA Interference Inhibits Proliferation, Invasion and Metastasis, and Induces Apoptosis through MAP4K4/JNK Signaling Pathway in Human Laryngeal Cancer TU212 cells. J Histochem Cytochem. 2015; 63:721–733.
48. Ge N, Lin HX, Xiao XS, Guo L, Xu HM, Wang X, Jin T, Cai XY, Liang Y, Hu WH, Kang T. Prognostic significance of Oct4 and Sox2 expression in hypopharyngeal squamous cell carcinoma. J Transl Med. 2010; 8: 94. doi: 10.1186/1479–5876–8–94.
49. González-Márquez R, Llorente JL, Rodrigo JP, Garcia-Pedrero JM, Álvarez-Marcos C, Suárez C, Hermsen MA. SOX2 expression in hypopharyngeal, laryngeal and sinonasal squamous cell carcinoma. Hum Pathol. 2014; 45:851–857.
50. Dong Z, Liu G, Huang B, Sun J, Wu D. Prognostic significance of SOX2 in head and neck cancer: a meta-analysis. Int J Clin Exp Med. 2014; 7:5010–5020.
51. Remmele W, Stegner HE. Recommendation for uniform definition of an immunreactive score (IRS) for immunohistochemical detection (ER-ICA) in breast cancer tissue. Pathologe. 1987; 8:138–140.
52. Linxweiler M, Bochen F, Wemmert S, Lerner C, Hasenfus A, Bohle RM, Al Kadah B, Takacs ZF, Smola S, Schick B. Combination of p16(INK4a)/Ki67 immunocytologie and HPV polymerase chain reaction for the noninvasive analysis of HPV involvement in head and neck cancer. Cancer Cytopathol. 2015; 123:219–229.
53. De Roda Husman AM, Walboomers JM, van den Brule AJ, Meijer CJ, Snijders PJ. The use of general primers GP5 and GP6 elongated at their 3’ ends with adjacent highly conserved sequences improves human papillomavirus detection by PCR. J Gen Virol. 1995; 76:1057–1062.
54. Ruprecht K, Ferreira H, Flockerzi A, Wahl S, Sauter M, Mayer J, Müller-Lantzsch N. Human endogenous retrovirus family HERV-K(HML-2) RNA transcripts are selectively packaged into retroviral particles produced by the human germ cell tumor line Tera-1 and originate mainly from a provirus on chromosome 22q11.21. J Virol. 2008; 82:10008–10016.