
INTRODUCTION
Breast cancer (BC), one of the most common malignant tumors among women worldwide, has the highest mortality rate in female cancer. Its incidence rate is increasing year by year and the patients are becoming younger and younger in the world [1, 2]. BC is the result of the interaction of environmental and genetic factors. Under the same carcinogenic factors, only a small fraction of people develop BC, which suggests that the genetic background differences lead to individual differences in BC susceptibility [3].
In recent years, genome-wide association study (GWAS) provides a good technical support for the study on the susceptibility loci with high variation frequency and low penetrance [4]. Large numbers of BC related susceptibility genes and single nucleotide polymorphism sites have been found through GWAS, such as LSP1, MAP3K1, FGFR2, TGFB1, TOX3, etc [5]. The discovery of these genes will have an important impact on the prevention and treatment of BC, especially FGFR2 (rs2981582, rs2420946 and rs2981578). FGFR2 gene is located in 10q26, and contains at least 22 exons [6]. FGFR2 is a member of the tyrosine kinase receptor family. It is a transmembrane protein, and is mainly composed of three parts: extracellular region, transmembrane region and intracellular region. The extracellular segment has three immunoglobulin like protein functional areas. Through the combination with FGFs, the functional areas could activate the tyrosine kinase activity and induce receptor tyrosine phosphorylation. It also starts series of cascade reaction through the RAS-MAPK, JAK-STATs and PLC-Y signal system, and then regulate the transcription of downstream genes involve in the body's physiological and pathological activities, such as cell proliferation, differentiation, migration and apoptosis, angiogenesis, skeletal development. So FGFR2 plays an important role in the processes of human growth and development [7].
Lots of researches have reported the association between FGFR2 (rs2981582, rs2420946 and rs2981578) polymorphism and BC risk. However, due to differences in ethnic and regional and other factors, the conclusions of related reports are still inconclusive. Raskin et al [8] found FGFR2 rs2420946 was significantly associated with BC risk in Ashkenazi and Sephardi Jews, with a similar but not significant trend in Arabs. Liang et al’s [9] study indicated that each of thesingle nucleotide polymorphisms (SNPs) (rs2981582and rs2420946) was significantly associated with increased BC risk, and the risk was the highest for those carrying the 2 mutation sites at the same time. While, there are also some different reports. Liu et al [10] found that FGFR2 rs2420946was not significantly correlated with the occurrence of BC in Chinese population. These different conclusions may result from the diversity of genetic background and carcinogenic factors, therefore, further studies in different populations should be implemented to assess the correlation between SNPs and BC risk. Although five meta-analysis [11–15] on the associations between FGFR2 (rs2981582, rs2420946 and rs2981578) polymorphism and BC risk had been implemented, yet the results remained inconclusive and some just no subgroup. Therefore, we carried out this meta-analysis on all the included case-control researches to make a more accurate assessment of the relationship.
RESULTS
Characteristics of included papers
The specific search process is shown in Figure 1. A total of 563 references were preliminarily identified at first based on our selection strategy. We also identified 2 papers through other sources. 454 records left after removing repeated studies. We refer to titles or abstracts of all the included literatures, and then removed obviously irrelevant papers. In the end, the whole of the rest of the papers were checked based on the inclusion and exclusion criteria. Finally, 35 studies on FGFR2 (rs2981582, rs2420946 and rs2981578) polymorphism and the occurrence of BC were eventually included in our study. Characteristics of eligible analysis are shown in Table 1. The 35 case-control papers were published between 2007 and 2015, among them, 1 study was performed in African, 17 in Asian, 14 in Caucasians and 3 in both Asian and Caucasians. All studies were case-controlled.
Table 1: Characteristics of the studies included in the meta-analysis
First author |
Year |
Country |
Ethnicity |
Source of controls |
Genotyping medthod |
Number(case/control) |
HWE |
rs2981582 (C>T) |
|||||||
Kawase [20] |
2009 |
Japan |
Asian |
HB |
TaqMan |
455/912 |
0.773315 |
Hu [25] |
2011 |
China |
Asian |
PB |
PCR-RFLP |
203/200 |
0.758366 |
Li [26] |
2011 |
China |
Asian |
HB |
MassArray |
401/441 |
0.219207 |
Chen [27] |
2012 |
China |
Asian |
PB |
PCR-SSCP |
388/424 |
0.048991 |
Butt [28] |
2012 |
Swedish |
Caucasian |
PB |
MassArray |
713/1399 |
0.816442 |
Shan [29] |
2012 |
Tunisian |
African |
PB |
TaqMan |
600/358 |
0.060883 |
Fu [30] |
2012 |
China |
Asian |
HB |
iPLEX |
118/104 |
0.474243 |
Campa [31] |
2011 |
Mixed |
Mixed |
PB |
Taqman |
8313/11594 |
0.607558 |
Slattery [32] |
2011 |
American |
Caucasian |
PB |
Taqman |
1734/2040 |
0.822253 |
Han [33] |
2011 |
Korean |
Asian |
PB |
Taqman |
3232/3489 |
0.361342 |
Tamimi [34] |
2010 |
Swedish |
Caucasian |
PB |
Taqman |
680/734 |
0.535243 |
Gorodnova [35] |
2010 |
Russian |
Caucasian |
NA |
Taqman |
140/174 |
0.000621 |
Ren [36] |
2010 |
China |
Asian |
HB |
Taqman |
956/471 |
0.024883 |
McInerney [37] |
2009 |
British |
Caucasian |
PB |
KASPar |
941/997 |
0.83057 |
Boyarskikh [38] |
2009 |
Russia |
Caucasian |
PB |
Taqman |
744/628 |
0.659988 |
Garcia-Closas [39] |
2008 |
Mixed |
Mixed |
PB, HB |
Taqman |
16882/26058 |
0.892667 |
Liang [9] |
2008 |
China |
Asian |
HB |
Taqman |
1026/1062 |
0.97418 |
Antoniou [40] |
2008 |
European |
Mixed |
NA |
Taqman, MALDI-TOF |
4990/4301 |
0.596563 |
Zhao [41] |
2010 |
China |
Asian |
HB |
PCR-RFLP |
956/471 |
0.024883 |
Xi [42] |
2014 |
China |
Asian |
HB |
MALDI-TOF |
815/849 |
0.959015 |
Campa [19] |
2015 |
Mixed |
Caucasian |
PB |
TaqMan |
1234/12231 |
0.779613 |
Slattery [43] |
2013 |
American |
Caucasian |
PB |
multiplexed bead array |
3560/4138 |
0.364662 |
Chan [44] |
2012 |
China |
Asian |
HB |
Taqman |
1168/1475 |
0.164674 |
Dai [45] |
2012 |
China |
Asian |
HB |
TaqMan |
1768/1844 |
0.423521 |
Jara [46] |
2013 |
Chile |
Caucasian |
PB |
TaqMan |
351/802 |
0.138274 |
Liang [18] |
2015 |
China |
Asian |
HB |
MassARRAY |
607/856 |
0.298476 |
Liu [47] |
2013 |
China |
Asian |
HB |
PCR-RFLP |
203/200 |
0.758366 |
Murillo-Zamora [48] |
2013 |
Mexico |
Caucasian |
PB |
Multiplexed assays |
687/907 |
0.351295 |
Ottini [49] |
2013 |
Italy |
Caucasian |
PB |
TaqMan |
413/745 |
0.76716 |
Ozgoz [50] |
2013 |
Turkey |
Caucasian |
PB |
PCR-RFLP |
31/30 |
0.281979 |
Siddiqui [51] |
2014 |
India |
Asian |
HB |
PCR-RFLP |
368/484 |
0.526174 |
rs2420946 (C>T) |
|||||||
Raskin [8] |
2008 |
USA |
Caucasian |
PB |
TaqMan |
1480/1474 |
0.224235 |
Kawase [20] |
2009 |
Japan |
Asian |
HB |
TaqMan |
453/912 |
0.519554 |
Liu [10] |
2009 |
China |
Asian |
PB |
PCR-RFLP |
106/116 |
0.361602 |
Hu [25] |
2011 |
China |
Asian |
PB |
PCR-RFLP |
203/200 |
0.325727 |
Li [26] |
2011 |
China |
Asian |
HB |
MassArray |
391/432 |
0.703117 |
Fu [30] |
2012 |
China |
Asian |
HB |
iPLEX |
118/104 |
0.505449 |
Liang [9] |
2008 |
China |
Asian |
HB |
Taqman |
1020/1050 |
0.413194 |
Hunter [52] |
2007 |
USA |
Caucasian |
PB |
Taqman |
2912/3212 |
0.293864 |
Jara [46] |
2013 |
Chile |
Caucasian |
PB |
TaqMan |
351/802 |
0.292806 |
Liang [18] |
2015 |
China |
Asian |
HB |
MassARRAY |
603/847 |
0.063645 |
Liu [47] |
2013 |
China |
Asian |
HB |
PCR-RFLP |
203/200 |
0.325727 |
rs2981578 (A>G) |
|||||||
Chen [27] |
2012 |
China |
Asian |
PB |
PCR-SSCP |
378/458 |
0.290218 |
Lin [53] |
2012 |
Taiwan |
Asian |
PB |
PCR-RFLP |
87/70 |
0.724138 |
Siddiqui [51] |
2014 |
India |
Asian |
HB |
PCR-RFLP |
368/484 |
0.278456 |
HWE: hardy-weinberg equilibrium; PB: population based; HB: hospital-based.
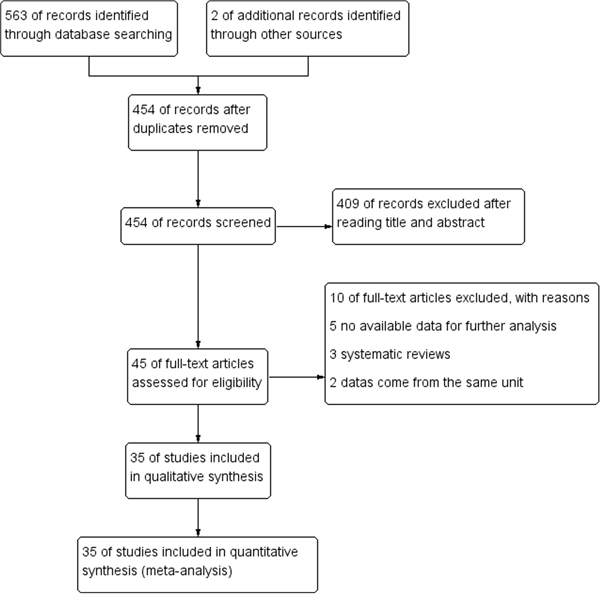
Figure 1: Flow chart of studies selection in this meta-analysis.
Meta-analysis results
The FGFR2 (rs2981582, rs2420946 and rs2981578) polymorphisms genotype distribution and allele frequencies incase groups and control groups were shown in Table 2. Main results of our study were shown in Table 3. There were 31 studies with 54,677 cases and 80,418 controls for FGFR2 rs2981582 variants. As shown in Table 3, Figure 2 and Figure 3, the pooled results indicated that the correlation between FGFR2 rs2981582 polymorphism and the occurrence of BC was significant in any genetic model: Allele model (OR: 1.23; 95% CI: 1.19- 1.26; P< 0.00001), Dominant model (OR: 1.29; 95% CI: 1.24-1.34; P< 0.00001), Recessive model (OR: 1.35; 95% CI: 1.31-1.40; P<0.00001), Homozygous genetic model (OR: 1.50; 95% CI: 1.42-1.58; P< 0.00001), Heterozygote comparison (OR: 1.22; 95% CI: 1.17-1.27; P< 0.00001). In ethnicity specific analysis, FGFR2 rs2981582 were significantly associated with BC risk both in Asians (Allele model: OR=1.19, 95% CI=1.15- 1.24, P< 0.00001; Dominant model: OR=1.23, 95% CI=1.17-1.29, P< 0.00001; Recessive model: OR=1.31, 95% CI=1.21-1.42, P< 0.00001; Homozygous genetic model: OR=1.42, 95% CI=1.31-1.54, P< 0.00001; Heterozygote comparison: OR=1.18, 95% CI=1.12-1.25, P< 0.00001) and Caucasians (Allele model: OR=1.25, 95% CI=1.21-1.30, P< 0.00001; Dominant model: OR=1.33, 95% CI=1.26-1.40, P< 0.00001; Recessive model: OR=1.37, 95% CI=1.28-1.46, P< 0.00001; Homozygous genetic model: OR=1.56, 95% CI=1.45-1.68, P< 0.00001; Heterozygote comparison: OR=1.26, 95% CI=1.19-1.33, P< 0.00001). We didn’t discuss the African subgroup for just one study from African. The analysis in different source of controls showed the same association between FGFR2 rs2981582 polymorphism and BC susceptibility both in HB(Allele model: OR=1.22, 95% CI=1.16-1.27, P< 0.00001; Dominant model: OR=1.27, 95% CI=1.20-1.35, P< 0.00001; Recessive model: OR=1.31, 95% CI=1.20-1.44, P< 0.00001; Homozygous genetic model: OR=1.45, 95% CI=1.31-1.60, P< 0.00001; Heterozygote comparison: OR=1.23, 95% CI=1.15-1.31, P< 0.00001) and PB(Allele model: OR=1.24, 95% CI=1.19-1.29, P< 0.00001; Dominant model: OR=1.31, 95% CI=1.23-1.40, P< 0.00001; Recessive model: OR=1.35, 95% CI=1.29-1.42, P< 0.00001; Homozygous genetic model: OR=1.50, 95% CI=1.43-1.58, P< 0.00001; Heterozygote comparison: OR=1.23, 95% CI=1.15-1.31, P< 0.00001).
Table 2: Polymorphisms genotype distribution and allele frequency in cases and controls
First author |
Genotype (N) |
Allele frequency (N) |
||||||||||
Case |
Control |
Case |
Control |
|||||||||
rs2981582 (C>T) |
Total |
TT |
TC |
CC |
Total |
TT |
TC |
CC |
T |
C |
T |
C |
Kawase [20] |
455 |
42 |
192 |
221 |
912 |
63 |
347 |
502 |
276 |
634 |
473 |
1351 |
Hu [25] |
203 |
47 |
78 |
78 |
200 |
26 |
95 |
79 |
172 |
234 |
147 |
253 |
Li [26] |
401 |
54 |
180 |
167 |
441 |
60 |
189 |
192 |
288 |
514 |
309 |
573 |
Chen [27] |
388 |
48 |
208 |
132 |
424 |
60 |
224 |
140 |
304 |
472 |
344 |
504 |
Butt [28] |
713 |
124 |
356 |
233 |
1399 |
185 |
653 |
561 |
604 |
822 |
1023 |
1775 |
Shan [29] |
600 |
147 |
315 |
138 |
358 |
64 |
154 |
140 |
609 |
591 |
282 |
434 |
Fu [30] |
118 |
21 |
55 |
42 |
104 |
8 |
47 |
49 |
97 |
139 |
63 |
145 |
Campa [31] |
8313 |
1568 |
3951 |
2794 |
11594 |
1718 |
5456 |
4420 |
7087 |
9539 |
8892 |
14296 |
Slattery [32] |
1734 |
315 |
884 |
535 |
2040 |
318 |
981 |
741 |
1514 |
1954 |
1617 |
2463 |
Han [33] |
3232 |
342 |
1393 |
1497 |
3489 |
281 |
1457 |
1751 |
2077 |
4387 |
2019 |
4959 |
Tamimi [34] |
680 |
136 |
304 |
240 |
734 |
91 |
324 |
319 |
576 |
784 |
506 |
962 |
Gorodnova [35] |
140 |
23 |
67 |
50 |
174 |
25 |
54 |
95 |
113 |
167 |
104 |
244 |
Ren [36] |
956 |
130 |
400 |
426 |
471 |
56 |
181 |
234 |
660 |
1252 |
293 |
649 |
McInerney [37] |
941 |
214 |
458 |
269 |
997 |
179 |
483 |
335 |
886 |
996 |
841 |
1153 |
Boyarskikh [38] |
744 |
126 |
371 |
247 |
628 |
71 |
273 |
284 |
623 |
865 |
415 |
841 |
Garcia-Closas [39] |
16882 |
3243 |
8218 |
5421 |
26058 |
3747 |
12255 |
10056 |
14704 |
19060 |
19749 |
32367 |
Liang [9] |
1026 |
119 |
460 |
447 |
1062 |
91 |
439 |
532 |
698 |
1354 |
621 |
1503 |
Antoniou [40] |
4990 |
936 |
2407 |
1647 |
4301 |
703 |
2051 |
1547 |
4279 |
5701 |
3457 |
5145 |
Zhao [41] |
956 |
130 |
400 |
426 |
471 |
56 |
181 |
234 |
660 |
1252 |
293 |
649 |
Xi [42] |
815 |
100 |
423 |
292 |
849 |
94 |
376 |
379 |
623 |
1007 |
564 |
1134 |
Campa [19] |
1234 |
241 |
608 |
385 |
12231 |
1847 |
5793 |
4591 |
1090 |
1378 |
9487 |
14975 |
Slattery [43] |
3560 |
708 |
1749 |
1103 |
4138 |
638 |
2009 |
1491 |
3165 |
3955 |
3285 |
4991 |
Chan [44] |
1168 |
155 |
527 |
486 |
1475 |
162 |
618 |
695 |
837 |
1499 |
942 |
2008 |
Dai [45] |
1768 |
216 |
820 |
732 |
1844 |
164 |
796 |
884 |
1252 |
2284 |
1124 |
2564 |
Jara [46] |
351 |
80 |
178 |
93 |
802 |
141 |
366 |
295 |
338 |
364 |
648 |
956 |
Liang [18] |
607 |
103 |
266 |
238 |
856 |
111 |
375 |
370 |
472 |
742 |
597 |
1115 |
Liu [47] |
203 |
47 |
78 |
78 |
200 |
26 |
95 |
79 |
172 |
234 |
147 |
253 |
Murillo-Zamora [48] |
687 |
145 |
309 |
233 |
907 |
139 |
415 |
353 |
599 |
775 |
693 |
1121 |
Ottini [49] |
413 |
98 |
205 |
110 |
745 |
139 |
361 |
245 |
401 |
425 |
639 |
851 |
Ozgoz [50] |
31 |
9 |
16 |
6 |
30 |
10 |
12 |
8 |
34 |
28 |
32 |
28 |
Siddiqui [51] |
368 |
56 |
168 |
144 |
484 |
53 |
205 |
226 |
280 |
456 |
311 |
657 |
rs2420946 (C>T) |
Total |
TT |
TC |
CC |
Total |
TT |
TC |
CC |
T |
C |
T |
C |
Raskin [8] |
1480 |
356 |
715 |
409 |
1474 |
285 |
700 |
489 |
1427 |
1533 |
1270 |
1678 |
Kawase [20] |
453 |
60 |
226 |
167 |
912 |
99 |
416 |
397 |
346 |
560 |
614 |
1210 |
Liu [10] |
106 |
16 |
51 |
39 |
116 |
21 |
51 |
44 |
83 |
129 |
93 |
139 |
Hu [25] |
203 |
50 |
92 |
61 |
200 |
34 |
105 |
61 |
192 |
214 |
173 |
227 |
Li [26] |
391 |
74 |
186 |
131 |
432 |
68 |
202 |
162 |
334 |
448 |
338 |
526 |
Fu [30] |
118 |
25 |
55 |
38 |
104 |
9 |
48 |
47 |
105 |
131 |
66 |
142 |
Liang [9] |
1020 |
163 |
519 |
338 |
1050 |
142 |
505 |
403 |
845 |
1195 |
789 |
1311 |
Hunter [52] |
2912 |
603 |
1409 |
900 |
3212 |
484 |
1562 |
1166 |
2615 |
3209 |
2530 |
3894 |
Jara [46] |
351 |
85 |
175 |
91 |
802 |
143 |
374 |
285 |
345 |
357 |
660 |
944 |
Liang [18] |
603 |
116 |
297 |
190 |
847 |
145 |
379 |
323 |
529 |
677 |
669 |
1025 |
Liu [47] |
203 |
50 |
92 |
61 |
200 |
34 |
105 |
61 |
192 |
214 |
173 |
227 |
rs2981578 (A>G) |
Total |
GG |
GA |
AA |
Total |
GG |
GA |
AA |
G |
A |
G |
A |
Chen [27] |
378 |
150 |
188 |
40 |
458 |
160 |
212 |
86 |
488 |
268 |
532 |
384 |
Lin [53] |
87 |
35 |
39 |
13 |
70 |
21 |
36 |
13 |
109 |
65 |
78 |
62 |
Siddiqui [51] |
368 |
129 |
185 |
54 |
484 |
151 |
228 |
105 |
443 |
293 |
530 |
438 |
Table 3: Meta-analysis results
Outcome or Subgroup |
Studies |
Participants |
Statistical Method |
Effect Estimate |
P value |
Heterogeneity |
|
I2 |
P value |
||||||
Allele model |
|||||||
rs2981582 (C>T) |
31 |
270190 |
OR (M-H, Random, 95% CI) |
1.23 [1.19, 1.26] |
< 0.00001 |
41% |
0.01 |
Asian |
15 |
51892 |
OR (M-H, Fixed, 95% CI) |
1.19 [1.15, 1.24] |
< 0.00001 |
0% |
0.54 |
Caucasian |
12 |
72106 |
OR (M-H, Fixed, 95% CI) |
1.25 [1.21, 1.30] |
< 0.00001 |
4% |
0.4 |
HB |
12 |
36020 |
OR (M-H, Fixed, 95% CI) |
1.22 [1.16, 1.27] |
< 0.00001 |
0% |
0.87 |
PB |
16 |
129080 |
OR (M-H, Random, 95% CI) |
1.24 [1.19, 1.29] |
< 0.00001 |
46% |
0.02 |
rs2420946 (C>T) |
11 |
34378 |
OR (M-H, Fixed, 95% CI) |
1.23 [1.18, 1.29] |
< 0.00001 |
0% |
0.67 |
Asian |
8 |
13916 |
OR (M-H, Fixed, 95% CI) |
1.19 [1.11, 1.28] |
< 0.00001 |
0% |
0.67 |
Caucasian |
3 |
20462 |
OR (M-H, Fixed, 95% CI) |
1.26 [1.19, 1.33] |
< 0.00001 |
0% |
0.53 |
HB |
6 |
12666 |
OR (M-H, Fixed, 95% CI) |
1.20 [1.12, 1.29] |
< 0.00001 |
0% |
0.61 |
PB |
5 |
21712 |
OR (M-H, Fixed, 95% CI) |
1.25 [1.18, 1.32] |
< 0.00001 |
0% |
0.5 |
rs2981578 (A>G) |
3 |
3690 |
OR (M-H, Fixed, 95% CI) |
1.29 [1.13, 1.47] |
0.0002 |
0% |
0.93 |
Dominant model |
|||||||
rs2981582 (C>T) |
31 |
135095 |
OR (M-H, Random, 95% CI) |
1.29 [1.24, 1.34] |
< 0.00001 |
46% |
0.003 |
Asian |
15 |
25946 |
OR (M-H, Fixed, 95% CI) |
1.23 [1.17, 1.29] |
< 0.00001 |
0% |
0.63 |
Caucasian |
12 |
36053 |
OR (M-H, Fixed, 95% CI) |
1.33 [1.26, 1.40] |
< 0.00001 |
16% |
0.28 |
HB |
12 |
18010 |
OR (M-H, Fixed, 95% CI) |
1.27 [1.20, 1.35] |
< 0.00001 |
0% |
0.89 |
PB |
16 |
64540 |
OR (M-H, Random, 95% CI) |
1.31 [1.23, 1.40] |
< 0.00001 |
55% |
0.004 |
rs2420946 (C>T) |
11 |
17189 |
OR (M-H, Fixed, 95% CI) |
1.28 [1.20, 1.37] |
< 0.00001 |
0% |
0.77 |
Asian |
8 |
6958 |
OR (M-H, Fixed, 95% CI) |
1.25 [1.13, 1.39] |
< 0.00001 |
0% |
0.75 |
Caucasian |
3 |
10231 |
OR (M-H, Fixed, 95% CI) |
1.31 [1.20, 1.42] |
< 0.00001 |
0% |
0.38 |
HB |
6 |
6333 |
OR (M-H, Fixed, 95% CI) |
1.28 [1.15, 1.42] |
< 0.00001 |
0% |
0.73 |
PB |
5 |
10856 |
OR (M-H, Fixed, 95% CI) |
1.29 [1.19, 1.40] |
< 0.00001 |
0% |
0.44 |
rs2981578 (A>G) |
3 |
1845 |
OR (M-H, Fixed, 95% CI) |
1.71 [1.32, 2.21] |
< 0.0001 |
0% |
0.63 |
Recessive model |
|||||||
rs2981582 (C>T) |
31 |
135095 |
OR (M-H, Fixed, 95% CI) |
1.35 [1.31, 1.40] |
< 0.00001 |
15% |
0.24 |
Asian |
15 |
25946 |
OR (M-H, Fixed, 95% CI) |
1.31 [1.21, 1.42] |
< 0.00001 |
19% |
0.24 |
Caucasian |
12 |
36053 |
OR (M-H, Fixed, 95% CI) |
1.37 [1.28, 1.46] |
< 0.00001 |
0% |
0.74 |
HB |
12 |
18010 |
OR (M-H, Fixed, 95% CI) |
1.31 [1.20, 1.44] |
< 0.00001 |
0% |
0.5 |
PB |
16 |
64540 |
OR (M-H, Fixed, 95% CI) |
1.35 [1.29, 1.42] |
< 0.00001 |
0% |
0.45 |
rs2420946 (C>T) |
11 |
17189 |
OR (M-H, Fixed, 95% CI) |
1.36 [1.26, 1.48] |
< 0.00001 |
4% |
0.4 |
Asian |
8 |
6958 |
OR (M-H, Fixed, 95% CI) |
1.27 [1.12, 1.45] |
0.0003 |
8% |
0.37 |
Caucasian |
3 |
10231 |
OR (M-H, Fixed, 95% CI) |
1.42 [1.29, 1.57] |
< 0.00001 |
0% |
0.61 |
HB |
6 |
6333 |
OR (M-H, Fixed, 95% CI) |
1.27 [1.11, 1.46] |
0.0006 |
4% |
0.39 |
PB |
5 |
10856 |
OR (M-H, Fixed, 95% CI) |
1.41 [1.28, 1.56] |
< 0.00001 |
0% |
0.46 |
rs2981578 (A>G) |
3 |
1845 |
OR (M-H, Fixed, 95% CI) |
1.24 [1.02, 1.50] |
0.03 |
0% |
0.75 |
Homozygous genetic model |
|||||||
rs2981582 (C>T) |
31 |
71786 |
OR (M-H, Random, 95% CI) |
1.50 [1.42, 1.58] |
< 0.00001 |
33% |
0.04 |
Asian |
15 |
14673 |
OR (M-H, Fixed, 95% CI) |
1.42 [1.31, 1.54] |
< 0.00001 |
2% |
0.43 |
Caucasian |
12 |
18824 |
OR (M-H, Fixed, 95% CI) |
1.56 [1.45, 1.68] |
< 0.00001 |
0% |
0.73 |
HB |
12 |
10192 |
OR (M-H, Fixed, 95% CI) |
1.45 [1.31, 1.60] |
< 0.00001 |
0% |
0.69 |
PB |
16 |
34101 |
OR (M-H, Fixed, 95% CI) |
1.50 [1.43, 1.58] |
< 0.00001 |
32% |
0.11 |
rs2420946 (C>T) |
11 |
8925 |
OR (M-H, Fixed, 95% CI) |
1.52 [1.39, 1.66] |
< 0.00001 |
0% |
0.54 |
Asian |
8 |
3629 |
OR (M-H, Fixed, 95% CI) |
1.40 [1.21, 1.62] |
< 0.00001 |
0% |
0.57 |
Caucasian |
3 |
5296 |
OR (M-H, Fixed, 95% CI) |
1.60 [1.43, 1.79] |
< 0.00001 |
0% |
0.56 |
HB |
6 |
3303 |
OR (M-H, Fixed, 95% CI) |
1.43 [1.22, 1.66] |
< 0.00001 |
0% |
0.53 |
PB |
5 |
5622 |
OR (M-H, Fixed, 95% CI) |
1.57 [1.41, 1.76] |
< 0.00001 |
0% |
0.47 |
rs2981578 (A>G) |
3 |
957 |
OR (M-H, Fixed, 95% CI) |
1.80 [1.36, 2.39] |
< 0.0001 |
0% |
0.8 |
Heterozygote genetic model |
|||||||
rs2981582 (C>T) |
31 |
114046 |
OR (M-H, Random, 95% CI) |
1.22 [1.17, 1.27] |
< 0.00001 |
42% |
0.007 |
Asian |
15 |
23025 |
OR (M-H, Fixed, 95% CI) |
1.18 [1.12, 1.25] |
< 0.00001 |
1% |
0.44 |
Caucasian |
12 |
30051 |
OR (M-H, Fixed, 95% CI) |
1.26 [1.19, 1.33] |
< 0.00001 |
26% |
0.19 |
HB |
12 |
15893 |
OR (M-H, Fixed, 95% CI) |
1.23 [1.15, 1.31] |
< 0.00001 |
0% |
0.75 |
PB |
16 |
54285 |
OR (M-H, Random, 95% CI) |
1.23 [1.15, 1.31] |
< 0.00001 |
52% |
0.009 |
rs2420946 (C>T) |
11 |
14127 |
OR (M-H, Fixed, 95% CI) |
1.21 [1.13, 1.29] |
< 0.00001 |
0% |
0.69 |
Asian |
8 |
5852 |
OR (M-H, Fixed, 95% CI) |
1.21 [1.08, 1.34] |
0.0005 |
0% |
0.62 |
Caucasian |
3 |
8275 |
OR (M-H, Fixed, 95% CI) |
1.21 [1.11, 1.32] |
< 0.0001 |
0% |
0.37 |
HB |
6 |
5348 |
OR (M-H, Fixed, 95% CI) |
1.23 [1.10, 1.38] |
0.0002 |
0% |
0.66 |
PB |
5 |
8779 |
OR (M-H, Fixed, 95% CI) |
1.19 [1.09, 1.30] |
< 0.0001 |
0% |
0.42 |
rs2981578 (A>G) |
3 |
1199 |
OR (M-H, Fixed, 95% CI) |
1.65 [1.26, 2.16] |
0.0003 |
0% |
0.51 |
CI: Confidence interval.
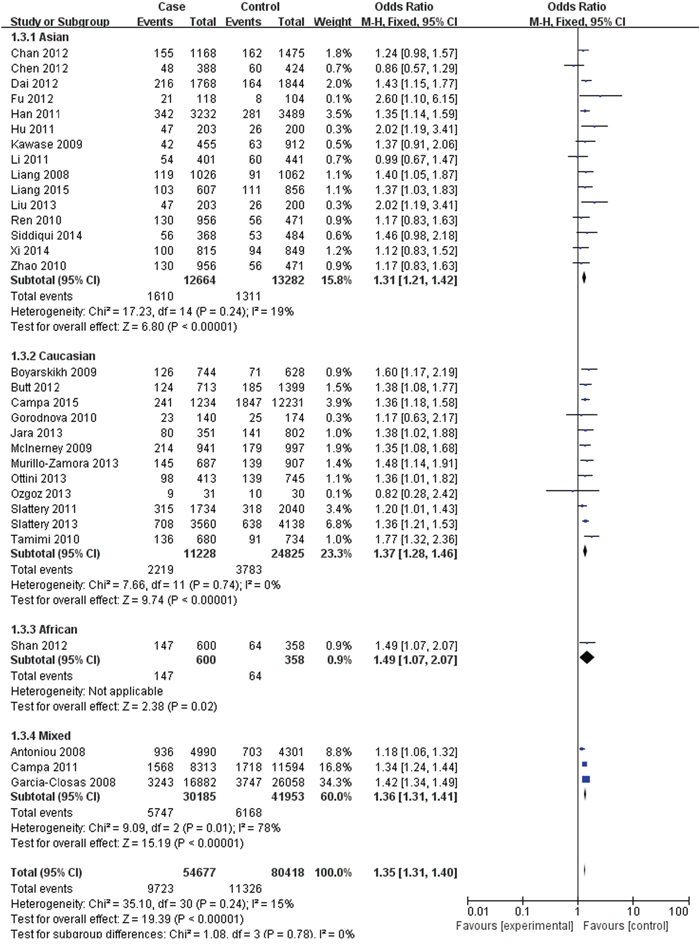
Figure 2: Forest plots of rs2981582 (C>T) polymorphism and breast cancer risk stratified by ethnicity (Recessive model TT vs. CC + TC).
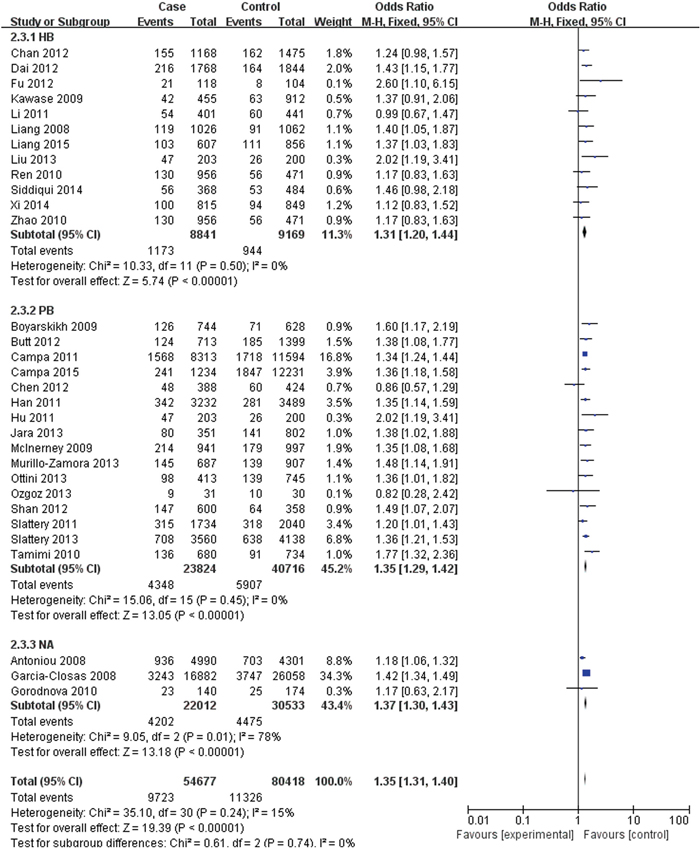
Figure 3: Forest plots of rs2981582 (C>T) polymorphism and breast cancer risk stratified by Source of controls (Recessive model TT vs. CC + TC).
For rs2420946, 11 studies with 7,840 cases and 9,349 controls were included to assess the association. As shown in Table 3, Figure 4 and Figure 5, the pooled ORs suggested that rs2420946 was significantly associated with BC susceptibility in all the five genetic models: Allele model 1.23 (95% CI: 1.18-1.29; P< 0.00001), Dominant model 1.28 (95% CI: 1.20-1.37; P< 0.00001), Recessive model 1.36 (95% CI: 1.26-1.48; P< 0.00001), Homozygous genetic model 1.52 (95% CI: 1.39-1.66; P< 0.00001), Heterozygote comparison 1.21 (95% CI: 1.13-1.29; P< 0.00001). When stratified by Ethnicity and Source of controls, the results showed that FGFR2 rs2420946 was significantly associated with BC risk in Asians, Caucasians, HB and PB.
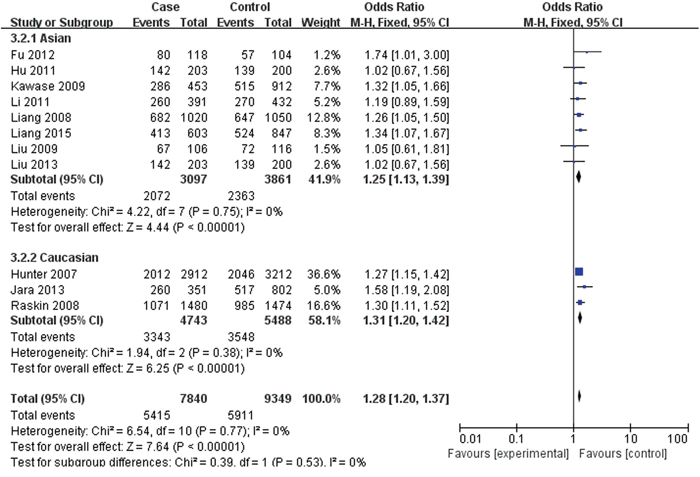
Figure 4: Forest plots of rs2420946 (C>T) polymorphism and breast cancer risk stratified by ethnicity (Dominant model TC + TT vs. CC).
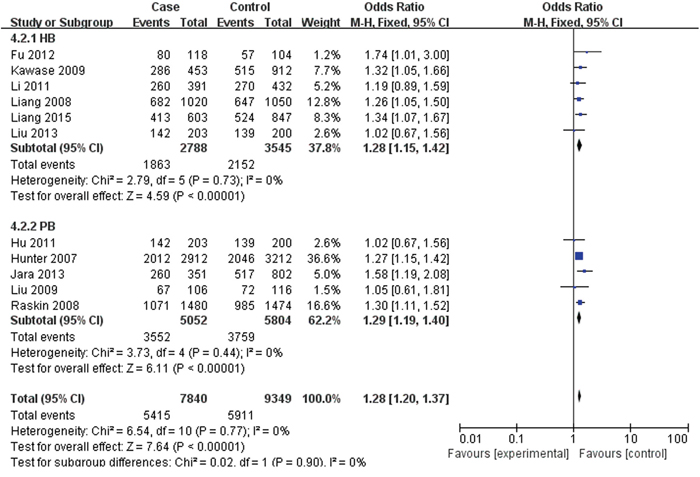
Figure 5: Forest plots of rs2420946 (C>T) polymorphism and breast cancer risk stratified by Source of controls (Dominant model TC + TT vs. CC).
3 papers with 833 cases and 1012 controls were adopted to evaluate the association between the rs2981578 polymorphism and the BC risk. As shown in Table 3, Figure 6, the association between rs2981578 variant and BC susceptibility was also significant in any genetic model (Allele model: OR= 1.29, 95% CI= 1.13-1.47, P= 0.0002; Dominant model: OR= 1.71, 95% CI= 1.32-2.21, P< 0.0001; Recessive model: OR= 1.24, 95% CI= 1.02-1.50, P= 0.03; Homozygous genetic model: OR= 1.80, 95% CI= 1.36-2.39, P< 0.0001; Heterozygote comparison: OR= 1.65, 95% CI= 1.26-2.16, P= 0.0003).
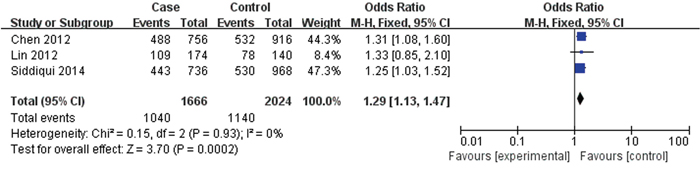
Figure 6: Forest plots of rs2981578 (A>G) polymorphism and breast cancer risk (Allele model G vs. A).
Sensitivity analyses
As shown in Table 1, all the studies conformed to the balance of HWE in controls except Chen’s(2012), Gorodnova’s(2012), Ren’s(2012), Zhao’s(2012) studies(P<0.05) in rs2981582 group, however, after performing the sensitivity analyses, the overall outcomes were no statistically significant change when removing any of the articles, indicating that our study has good stability and reliability.
Detection for heterogeneity
Heterogeneity among studies was obtained by Q statistic. Random-effect models were applied if p-value of heterogeneity tests were less than 0.1 (p ≤ 0.1), otherwise, fixed-effect models were selected (Table 3).
Publication bias
As Figure 7 indicated, the symmetrical funnel plot indicated that there is no significant publication bias in the total population. We use Begg's funnel plot and Egger test to evaluate the published bias, no significant publication bias was found in the Begg's test and Egger's test (P>0.05).
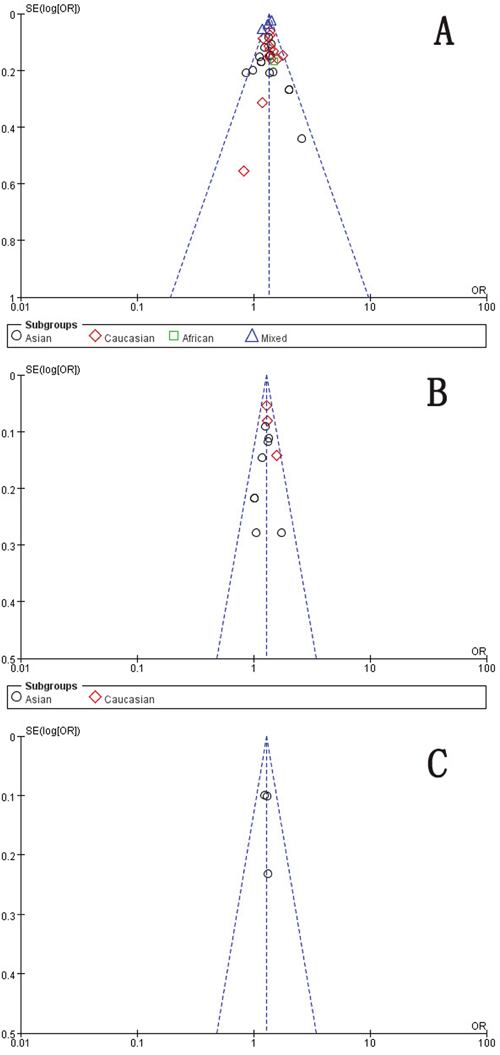
Figure 7: Funnel plot assessing evidence of publication bias. A. rs2981582 (C>T) (Recessive model TT vs. CC + TC). B. rs2420946 (C>T) (Dominant model TC + TT vs. CC). C. rs2981578 (A>G) (Allele model G vs. A). SE: standard error; OR: odds ratio.
DISCUSSION
FGFR2 has been proved to be associated with many diseases, especially the relationship between FGFR2 and cancer, which has become a hot research topic in recent years [16]. GWAS analysis revealed that FGFR2 gene was one of the BC susceptibility genes. There are 8 SNPs(rs35054928, rs2981578, rs2912778, rs2912781, rs35393331, rsl0736303, rs7895676, rs33971856) in its second intron and the SNPs of FGFR2 have become the hotspot in BC susceptibility gene study [17–19]. But the difference of SNPs allele frequency and LD structure reflects the difference of the genetic variation in the race, so the occurrence and characteristics of BC were different. Therefore, a variation in one study does not have the same risk impact on other crowds. This requires repeated studies on previously related locis in multiple populations worldwide.
Lots of researches have reported the association between FGFR2 (rs2981582, rs2420946 and rs2981578) polymorphism and BC risk. However, due to differences in ethnic and regional and other factors, the conclusions of related reports are still inconclusive. Thus, we conducted the meta-analysis to evaluate the relationship between FGFR2 (rs2981582, rs2420946 and rs2981578) polymorphism and BC risk.
In our study, there were 31 studies with 54,677 cases and 80,418 controls for FGFR2 rs2981582 variants. In the total population, the pooled results indicated that the correlation between FGFR2 rs2981582 polymorphism and the occurrence of BC was significant in any genetic model. Furthermore, in ethnicity-specific analysis, FGFR2 rs2981582 were also significantly associated with BC risk both in Asians and Caucasians. We didn’t discuss the African subgroup for just one study was from African. The analysis in different source of controls showed the same association between FGFR2 rs2981582 polymorphism and BC susceptibility both in HB and PB, indicating that both hospital populations and general populations followed the same relationship. For rs2420946, 11 studies with 7,840 cases and 9,349 controls were included to assess the association. In the total population, the pooled ORs suggested that rs2420946 was significantly associated with BC susceptibility in all the five genetic models. When stratified by ethnicity and source of controls, the results showed the same association in Asians, Caucasians, hospital populations and general populations, indicating that different genetic backgrounds and living environment were not strong enough to change these associations. All the results for the two variants (rs2981582, rs2420946) were partially consistent with the consequences of Wang’s [13], Peng’s [14], Zhang’s [12] and Jia’s [15] meta-analysis, while they didn’t conduct analysis in different source of controls, making our results more valuable. Furthermore, they didn’t use all the five genetic models(allele model, dominant model, recessive model, homozygous model and heterozygous model) to assess the strength of association. Wang’s [13] study also reported that the association appeared to be much stronger for estrogen receptor-positive and progesterone receptor-positive BC, which was not analyzed in our study. Peng’s [14] study was conducted on the base of present mata-ananlyses, which may missed some individual studies with larger sample sizes, and this type meta-analysis may not appropriate. In Zhang’s [12] study, the increased risk was found in the subgroup of postmenopausal women for rs2420946. However, only one study [20] reported that risk in premenopausal women. For Jia’s [15] study, in the ethnicity subgroup, using Non-Caucasians represent different ethnicities may cause some heterogeneity.
Three articles with 833 cases and 1012 controls were adopted to evaluate the association between the rs2981578 polymorphism and the BC risk. As the preceding two variants, the association between rs2981578 variant and BC susceptibility was also significant in any genetic model. For just only 3 studies, no stratified study was conducted for rs2981578 polymorphism. However, in Zhou’s [11] meta-analysis, they found that rs2981578 polymorphism might decrease BC risk. This may result from the literature selection bias. While the sample size of our study for rs2981578 was so small, data from a large sample of multiple centers is still needed to assess the association.
Our meta-analysis has several limitations. First, our study is a summary of the data. For lack of all individual raw data, we could not assess the cancer risk stratified by other covariates including age, sex, environment, hormone level, menopause age and other risk factors. We also cannot analyze the potential interaction of gene-environment and gene-gene. Second, only published papers were included in our meta-analysis, there still may be some unpublished studies which are in line with the conditions. Therefore, publication bias may exist even no statistical evidence was found in the meta-analysis. Third, for just only 3 papers, no stratified study was conducted for rs2981578 polymorphism. Moreover, our study is a summary of the data. We did not verify it from the level of molecular mechanism. Data from large scale multicenter epidemiological studies is still needed to confirm the relationship between FGFR2 (rs2981582, rs2420946 and rs2981578) polymorphisms and BC risk, and the molecular mechanism for the associations need to be elucidated further.
In conclusion, our meta-analysis based on case-control studies provides strong evidence that FGFR2 (rs2981582, rs2420946 and rs2981578) polymorphisms are significantly associated with the BC risk. For rs2981582 and rs2420946, the association remained significant in Asians, Caucasians, general populations and hospital populations. However, further large scale multicenter epidemiological studies are warranted to confirm this finding and the molecular mechanism for the associations need to be elucidated further.
MATERIALS AND METHODS
Literature search
We searched PubMed, Web of science and the Cochrane Library for relevant studies published before October 11, 2015. The following keywords were used: (Fibroblast Growth Factor Receptor 2 or FGFR2) and (variant* or genotype or polymorphism or SNP) and (breast) and (cancer or carcinom* or neoplasm* or tumor), and the combined phrases for all genetic studies on the association between the FGFR2 (rs2981582, rs2420946 and rs2981578) polymorphism and BC risk. The reference lists of all articles were also manually screened for potential studies. Abstracts and citations were screened by two researchers independently. All the eligible articles need a second screening for the full-text. The searching was done without language limitations.
Selection and exclusion criteria
Inclusion criteria: A study was included in this meta-analysis if it met the following criteria: i)independent case-control studies for humans; ii) the study evaluating the association between FGFR2 (rs2981582, rs2420946 and rs2981578) polymorphism and BC risk; iii) the study presenting available genotype frequencies in cancer cases and control subjects for risk estimated; iiii) cases should have been diagnosed by a pathological examination. We excluded comments, editorials, systematic reviews and studies lacking sufficient data or studies with male cases. If the researches were duplicated or shared in more than one study, the most recent publications were included.
Data extraction and synthesis
We used endnote bibliographic software to construct an electronic library of citations identified in the literature search. All the PubMed, Web of science and the Cochrane Library searches were performed using Endnote. Duplicates were found automatically by endnote and deleted manually. All data extraction were checked and calculated twice according to the inclusion criteria listed above by two independent investigators. Data extracted from the included studies were as follows: First author, year of publication, country, Ethnicity, Source of controls, Genotyping method, number of cases and controls and evidence of Hardy-Weinberg equilibrium(HWE) in controls. A third reviewer would participate if some disagreements were emerged, and a final decision was made by the majority of the votes.
Statistical analysis
All statistical analyses were performed using STATA version 11.0 software (StataCorp LP, College Station, TX) and Review Manage version 5.2.0 (The Cochrane Collaboration, 2012). Hardy-Weinberg equilibrium (HWE) was assessed by χ2 test in the control group of each study [21]. The strength of associations between the FGFR2 (rs2981582, rs2420946 and rs2981578) polymorphism and BC risk were measured by odds ratio (ORs) with 95% confidence interval (CIs). Z test was used to assess the significance of the ORs, I2 and Q statistics was used to determine the statistical heterogeneity among studies. A random-effect model was used if p value of heterogeneity tests was no more than 0.1 (p ≤ 0.1), and otherwise, a fixed-effect model was selected [21, 22]. Sensitivity analyses were performed to assess the stability of the results. We used Begg’s funnel plot and Egger’s test to evaluate the publication bias [23, 24]. The strength of the association was estimated in the allele model, the dominant model, the recessive model, the homozygous genetic model and the heterozygous genetic model, respectively. p< 0.05 was considered statistically significant. We performed subgroup according to Ethnicity and Source of controls.
CONFLICTS OF INTEREST
The authors have declared that no conflicts of interest exists.
REFERENCES
1. Torre LA, Bray F, Siegel RL, Ferlay J, Lortet-Tieulent J, Jemal A. Global cancer statistics, 2012. CA Cancer J Clin. 2015; 65: 87-108. doi: 10.3322/caac.21262.
2. Lee YC, Chuang JP, Hsieh PC, Chiou MJ, Li CY. A higher incidence rate of acute coronary syndrome following radiation therapy in patients with breast cancer and a history of coronary artery diseases. Breast Cancer Res Treat. 2015; 152: 429-35. doi: 10.1007/s10549-015-3481-5.
3. Domchek SM. Evolution of genetic testing for inherited susceptibility to breast cancer. J Clin Oncol. 2015; 33: 295-6. doi: 10.1200/JCO.2014.59.3178.
4. Hotta K. [New insight of genome-wide association study (GWAS)]. Nihon Rinsho. 2013; 71: 231-6.
5. Huang Y, Song F, Chen K. [Current status of genome-wide association studies (GWAS) on breast cancer and application values of single nucleotide polymorphisms identified from GWAS]. Zhonghua Liu Xing Bing Xue Za Zhi. 2015; 36: 1058-61. doi: 10.3760/cma.j.issn.0254-6450.2015.10.004.
6. Ingersoll RG, Paznekas WA, Tran AK, Scott AF, Jiang G, Jabs EW. Fibroblast growth factor receptor 2 (FGFR2): genomic sequence and variations. Cytogenet Cell Genet. 2001; 94: 121-6. doi: 48802.
7. Wesche J, Haglund K, Haugsten EM. Fibroblast growth factors and their receptors in cancer. Biochem J. 2011; 437: 199-213. doi: 10.1042/bj20101603.
8. Raskin L, Pinchev M, Arad C, Lejbkowicz F, Tamir A, Rennert HS, Rennert G, Gruber SB. FGFR2 is a breast cancer susceptibility gene in Jewish and Arab Israeli populations. Cancer Epidemiology Biomarkers & Prevention. 2008; 17: 1060-5. doi: 10.1158/1055-9965.epi-08-0018.
9. Liang J, Chen P, Hu Z, Zhou X, Chen L, Li M, Wang Y, Tang J, Wang H, Shen H. Genetic variants in fibroblast growth factor receptor 2 (FGFR2) contribute to susceptibility of breast cancer in Chinese women. Carcinogenesis. 2008; 29: 2341-6. doi: 10.1093/carcin/bgn235.
10. Mei LIU, Keren S, Yan HE, Ting Z, Xiaolan QI, Yan Z, Changxue WU, Chanjuan W, Xiaoliang W, Zhizhong G, Xilin REN. The Relationship between Two FGFR2 Polymorphisms and Breast Cancer. Chinese Journal of Clinical Oncology. 2009; 36: 413-6. doi: 10.3969/j.issn.1000-8179.2009.07.014.
11. Zhou L, Yao F, Luan H, Wang Y, Dong X, Zhou W, Wang Q. Three novel functional polymorphisms in the promoter of FGFR2 gene and breast cancer risk: a HuGE review and meta-analysis. Breast Cancer Research and Treatment. 2012; 136: 885-97. doi: 10.1007/s10549-012-2300-5.
12. Zhang J, Qiu L-X, Wang Z-H, Leaw S-J, Wang B-Y, Wang J-L, Cao Z-G, Gao J-L, Hu X-C. Current evidence on the relationship between three polymorphisms in the FGFR2 gene and breast cancer risk: a meta-analysis. Breast Cancer Research and Treatment. 2010; 124: 419-24. doi: 10.1007/s10549-010-0846-7.
13. Wang H, Yang Z, Zhang H. Assessing interactions between the associations of fibroblast growth factor receptor 2 common genetic variants and hormone receptor status with breast cancer risk. Breast Cancer Research and Treatment. 2013; 137: 511-22. doi: 10.1007/s10549-012-2343-7.
14. Peng S, Lue B, Ruan W, Zhu Y, Sheng H, Lai M. Genetic polymorphisms and breast cancer risk: evidence from meta-analyses, pooled analyses, and genome-wide association studies. Breast Cancer Research and Treatment. 2011; 127: 309-24. doi: 10.1007/s10549-011-1459-5.
15. Jia C, Cai Y, Ma Y, Fu D. Quantitative assessment of the effect of FGFR2 gene polymorphism on the risk of breast cancer. Breast Cancer Research and Treatment. 2010; 124: 521-8. doi: 10.1007/s10549-010-0872-5.
16. Andre F, Cortes J. Rationale for targeting fibroblast growth factor receptor signaling in breast cancer. Breast Cancer Res Treat. 2015; 150: 1-8. doi: 10.1007/s10549-015-3301-y.
17. Xia P, Li B, Geng T, Deng Z, Dang C, Chang D, Kang L, Jin T, Chen C. FGFR2 gene polymorphisms are associated with breast cancer risk in the Han Chinese population. American Journal of Cancer Research. 2015; 5: 1854-61.
18. Liang H, Yang X, Chen L, Li H, Zhu A, Sun M, Wang H, Li M. Heterogeneity of Breast Cancer Associations with Common Genetic Variants in FGFR2 according to the Intrinsic Subtypes in Southern Han Chinese Women. Biomed Research International. 2015. doi: 10.1155/2015/626948.
19. Campa D, Barrdahl M, Gaudet MM, Black A, Chanock SJ, Diver WR, Gapstur SM, Haiman C, Hankinson S, Hazra A, Henderson B, Hoover RN, Hunter DJ, et al. Genetic risk variants associated with in situ breast cancer. Breast Cancer Research. 2015; 17. doi: 10.1186/s13058-015-0596-x.
20. Kawase T, Matsuo K, Suzuki T, Hiraki A, Watanabe M, Iwata H, Tanaka H, Tajima K. FGFR2 intronic polymorphisms interact with reproductive risk factors of breast cancer: Results of a case control study in Japan. International Journal of Cancer. 2009; 125: 1946-52. doi: 10.1002/ijc.24505.
21. Mantel N, Haenszel W. Statistical aspects of the analysis of data from retrospective studies of disease. J Natl Cancer Inst. 1959; 22: 719-48.
22. DerSimonian R, Laird N. Meta-analysis in clinical trials. Control Clin Trials. 1986; 7: 177-88. doi: 10.1016/0197-2456(86)90046-2.
23. Begg CB, Mazumdar M. Operating characteristics of a rank correlation test for publication bias. Biometrics. 1994; 50: 1088-101. doi: 10.2307/2533446.
24. Egger M, Davey Smith G, Schneider M, Minder C. Bias in meta-analysis detected by a simple, graphical test. BMJ. 1997; 315: 629-34. doi: 10.1136/bmj.315.7109.629.
25. Hu X. (2011). Association of FGFR2 polymorphisms with the risk of breast cancer in Chinese women of Ningxia Han population Ningxia Medical University).
26. Li X. (2011). The breast cancer susceptive locus screening in Han chinese women and meta-analysis on common breast cancer risk factors. Southern Medical University).
27. Chen F, Lu M, Xue Y, Zhou J, Hu F, Chen X, Zhao Z, Li Y, Wang X. Genetic variants of fibroblast growth factor receptor 2 (FGFR2) are associated with breast cancer risk in Chinese women of the Han nationality. Immunogenetics. 2012; 64: 71-6. doi: 10.1007/s00251-011-0564-2.
28. Butt S, Harlid S, Borgquist S, Ivarsson M, Landberg G, Dillner J, Carlson J, Manjer J. Genetic predisposition, parity, age at first childbirth and risk for breast cancer. BMC research notes. 2012; 5: 414-. doi: 10.1186/1756-0500-5-414.
29. Shan J, Mahfoudh W, Dsouza SP, Hassen E, Bouaouina N, Abdelhak S, Benhadjayed A, Memmi H, Mathew RA, Aigha, II, Gabbouj S, Remadi Y, Chouchane L. Genome-Wide Association Studies (GWAS) breast cancer susceptibility loci in Arabs: susceptibility and prognostic implications in Tunisians. Breast Cancer Res Treat. 2012; 135: 715-24. doi: 10.1007/s10549-012-2202-6.
30. Fu F, Wang C, Huang M, Song C, Lin S, Huang H. Polymorphisms in Second Intron of the FGFR2 Gene Are Associated with the Risk of Early-Onset Breast Cancer in Chinese Han Women. Tohoku Journal of Experimental Medicine. 2012; 226: 221-9. doi: 10.1620/tjem.226.221.
31. Campa D, Kaaks R, Le Marchand L, Haiman CA, Travis RC, Berg CD, Buring JE, Chanock SJ, Diver WR, Dostal L, Fournier A, Hankinson SE, Henderson BE, et al. Interactions between genetic variants and breast cancer risk factors in the breast and prostate cancer cohort consortium. J Natl Cancer Inst. 2011; 103: 1252-63. doi: 10.1093/jnci/djr265.
32. Slattery ML, Baumgartner KB, Giuliano AR, Byers T, Herrick JS, Wolff RK. Replication of five GWAS-identified loci and breast cancer risk among Hispanic and non-Hispanic white women living in the Southwestern United States. Breast Cancer Research and Treatment. 2011; 129: 531-9. doi: 10.1007/s10549-011-1498-y.
33. Han W, Woo JH, Yu J-H, Lee M-J, Moon H-G, Kang D, Noh D-Y. Common Genetic Variants Associated with Breast Cancer in Korean Women and Differential Susceptibility According to Intrinsic Subtype. Cancer Epidemiology Biomarkers & Prevention. 2011; 20: 793-8. doi: 10.1158/1055-9965.epi-10-1282.
34. Tamimi RM, Lagiou P, Czene K, Liu J, Ekbom A, Hsieh C-C, Adami H-O, Trichopoulos D, Hall P. Birth weight, breast cancer susceptibility loci, and breast cancer risk. Cancer Causes & Control. 2010; 21: 689-96. doi: 10.1007/s10552-009-9496-7.
35. Gorodnova TV, Kuligina ES, Yanus GA, Katanugina AS, Abysheva SN, Togo AV, Imyanitov EN. Distribution of FGFR2, TNRC9, MAP3K1, LSP1, and 8q24 alleles in genetically enriched breast cancer patients versus elderly tumor-free women. Cancer Genetics and Cytogenetics. 2010; 199: 69-72. doi: 10.1016/j.cancergencyto.2010.01.020.
36. Ren L, Zhang B, Cao X-c, Chen Y, Ge J. Association of FGFR2 gene polymorphism with estrogen receptor positive breast cancer detected by fluorescent quantitative PCR. Zhonghua Yixue Yichuanxue Zazhi. 2010; 27: 445-8. doi: 10.3760/cma.j.issn.1003-9406.2010.04.019.
37. McInerney N, Colleran G, Rowan A, Walther A, Barclay E, Spain S, Jones AM, Tuohy S, Curran C, Miller N, Kerin M, Tomlinson I, Sawyer E. Low penetrance breast cancer predisposition SNPs are site specific. Breast Cancer Research and Treatment. 2009; 117: 151-9. doi: 10.1007/s10549-008-0235-7.
38. Boyarskikh UA, Zarubina NA, Biltueva JA, Sinkina TV, Voronina EN, Lazarev AF, Petrova VD, Aulchenko YS, Filipenko ML. Association of FGFR2 gene polymorphisms with the risk of breast cancer in population of West Siberia. European Journal of Human Genetics. 2009; 17: 1688-91. doi: 10.1038/ejhg.2009.98.
39. Garcia-Closas M, Hall P, Nevanlinna H, Pooley K, Morrison J, Richesson DA, Bojesen SE, Nordestgaard BG, Axelsson CK, Arias JI, Milne RL, Ribas G, Gonzalez-Neira A, et al. Heterogeneity of breast cancer associations with five susceptibility loci by clinical and pathological characteristics. PLoS Genet. 2008; 4: e1000054. doi: 10.1371/journal.pgen.1000054.
40. Antoniou AC, Spurdle AB, Sinilnikova OM, Healey S, Pooley KA, Schmutzler RK, Versmold B, Engel C, Meindl A, Arnold N, Hofmann W, Sutter C, Niederacher D, et al. Common breast cancer-predisposition alleles are associated with breast cancer risk in BRCA1 and BRCA2 mutation carriers. American Journal of Human Genetics. 2008; 82: 937-48. doi: 10.1016/j.ajhg.2008.02.008.
41. Zhao H, Zhang B, Yao H, Li X, Song Y, Wang X, Liu X, Cao X. Correlations between FGFR2 Gene Polymorphism and Susceptibility of Breast Cancer. Chinese Journal of Clinical Oncology. 2010; 37: 626-9. doi: 10.3969/j.issn.1000-8179.2010.11.008.
42. Xi J, Su Y, Fadiel AB, Lin Y, Su F-X, Jia W-H, Tang L-Y, Ren Z-F. Association of physical activity and polymorphisms in FGFR2 and DNA methylation related genes with breast cancer risk. Cancer Epidemiology. 2014; 38: 708-14. doi: 10.1016/j.canep.2014.09.002.
43. Slattery ML, John EM, Stern MC, Herrick J, Lundgreen A, Giuliano AR, Hines L, Baumgartner KB, Torres-Mejia G, Wolff RK. Associations with growth factor genes (FGF1, FGF2, PDGFB, FGFR2, NRG2, EGF, ERBB2) with breast cancer risk and survival: the Breast Cancer Health Disparities Study. Breast Cancer Research and Treatment. 2013; 140: 587-601. doi: 10.1007/s10549-013-2644-5.
44. Chan M, Ji SM, Liaw CS, Yap YS, Law HY, Yoon CS, Wong CY, Yong WS, Wong NS, Ng R, Ong KW, Madhukumar P, Oey CL, et al. Association of common genetic variants with breast cancer risk and clinicopathological characteristics in a Chinese population. Breast Cancer Res Treat. 2012; 136: 209-20. doi: 10.1007/s10549-012-2234-y.
45. Dai J, Hu Z, Jiang Y, Shen H, Dong J, Ma H, Shen H. Breast cancer risk assessment with five independent genetic variants and two risk factors in Chinese women. Breast Cancer Research. 2012; 14. doi: 10.1186/bcr3101.
46. Jara L, Gonzalez-Hormazabal P, Cerceno K, Di Capua GA, Reyes JM, Blanco R, Bravo T, Peralta O, Gomez F, Waugh E, Margarit S, Ibanez G, Romero C, et al. Genetic variants in FGFR2 and MAP3K1 are associated with the risk of familial and early-onset breast cancer in a South-American population. Breast Cancer Research and Treatment. 2013; 137: 559-69. doi: 10.1007/s10549-012-2359-z.
47. Liu C-L, Hu X-P, Guo W-D, Yang L, Dang J, Jiao H-Y. Case-Control Study on the Fibroblast Growth Factor Receptor 2 Gene Polymorphisms Associated with Breast Cancer in Chinese Han Women. Journal of Breast Cancer. 2013; 16: 366-71. doi: 10.4048/jbc.2013.16.4.366.
48. Murillo-Zamora E, Moreno-Macias H, Ziv E, Romieu I, Lazcano-Ponce E, Angeles-Llerenas A, Perez-Rodriguez E, Vidal-Millan S, Fejerman L, Torres-Mejia G. Association Between rs2981582 Polymorphism in the FGFR2 Gene and the Risk of Breast Cancer in Mexican Women. Archives of Medical Research. 2013; 44: 459-66. doi: 10.1016/j.arcmed.2013.08.006.
49. Ottini L, Silvestri V, Saieva C, Rizzolo P, Zanna I, Falchetti M, Masala G, Navazio AS, Graziano V, Bianchi S, Manoukian S, Barile M, Peterlongo P, et al. Association of low-penetrance alleles with male breast cancer risk and clinicopathological characteristics: results from a multicenter study in Italy. Breast Cancer Research and Treatment. 2013; 138: 861-8. doi: 10.1007/s10549-013-2459-4.
50. Ozgoz A, Samli H, Ozturk KH, Orhan B, Icduygu FM, Aktepe F, Imirzalioglu N. An investigation of the effects of FGFR2 and B7-H4 polymorphisms in breast cancer. Journal of Cancer Research and Therapeutics. 2013; 9: 370-5. doi: 10.4103/0973-1482.114434.
51. Siddiqui S, Chattopadhyay S, Akhtar MS, Najm MZ, Deo SV, Shukla NK, Husain SA. A study on genetic variants of Fibroblast growth factor receptor 2 (FGFR2) and the risk of breast cancer from North India. PLoS One. 2014; 9: e110426. doi: 10.1371/journal.pone.0110426.
52. Hunter DJ, Kraft P, Jacobs KB, Cox DG, Yeager M, Hankinson SE, Wacholder S, Wang Z, Welch R, Hutchinson A, Wang J, Yu K, Chatterjee N, et al. A genome-wide association study identifies alleles in FGFR2 associated with risk of sporadic postmenopausal breast cancer. Nature Genetics. 2007; 39: 870-4. doi: 10.1038/ng2075.
53. Lin C-Y, Ho C-M, Bau D-T, Yang S-F, Liu S-H, Lin P-H, Lin T-H, Tien N, Shih M-C, Lu J-J. Evaluation of Breast Cancer Susceptibility Loci on 2q35, 3p24, 17q23 and FGFR2 Genes in Taiwanese Women with Breast Cancer. Anticancer Research. 2012; 32: 475-82.