
INTRODUCTION
Gliomas are the most frequently occurring primary brain tumors in adults [1]. Its incidence has been increasing in the elderly population [2]. In spite of recent important advances in basic molecular mechanisms of gliomas, effective improvements in imaging, surgery, and radiotherapy, as well as the discovery of new promising drugs and targeted agents, its overall prognosis remains poor.
Histone acetyl transferases (HATs) and histone deacetylases (HDACs) are targets for cancer therapy. They determine the acetylation status of histones, the chromatin structure and gene expression. SAHA is the first histone deacetylase inhibitor (HDACi) drug, approved by Food and Drug Administration (FDA) of USA. It has multiple cellular effects and inhibits class I, II and IV HDACs, including the cytoplasmic HDAC6, a member of class IIb [3, 4]. SAHA has the permeability to cross the blood brain barrier and cause biological responses in the mouse brain, therefore making it as a preferred candidate drug for testing in gliomas [5].
A major pathway of intracellular protein degradation includes the proteasome, a multi-subunit enzyme complex that resides in the cytosol and nucleus [6]. MG132 is a proteasome inhibitor that induces apoptosis in tumor cells. The combination of proteasome inhibitors with some anti-tumor drugs such as SAHA comprises a new emerging field in oncology. Therefore, we observed the anti-tumor effects and relevant molecular mechanisms of SAHA or/and MG132 on the aggressive phenotypes of glioma cells in vitro and vivo. To clarify the clinicopathological significance of acetyl-histones 3 and 4, we determined their expression in normal brain tissues and glioma samples by immunohistochemistry, and compared them with clinicopathological parameters of gliomas.
RESULTS
The effects of SAHA or/and MG132 on the aggressive phenotypes of glioma cells
According to MTT assay, SAHA and MG132 reduced proliferation of the glioma cell lines in either time- or dose-dependent manner (Figure 1a, p<0.05). Additionally, there was an additive effect of SAHA and MG132 on the proliferative inhibition of glioma cells (Figure 1b, p<0.05). SAHA and MG132 can effectively inhibit the energy metabolism of both cells lines (Figure 1c, p<0.05). SAHA or/and MG132 treatment induced G2 arrest and apoptosis in both U87 and U251 cells in a concentration-dependent manner (Figure 2a-2d, p<0.05). SAHA or/and MG132 exposure suppressed lamellipodia formation in both glioma cells, as indicated by the loss of F-actin structure (Figure 3a). The wound healing and matrigel transwell invasion assays showed that SAHA or/and MG132 decreased cell migration and invasion (Figure 3b-3e, p<0.05). In addition, SAHA and MG132 acted an additive effect to cause cycle arrest, induce apoptosis, and inhibit cell migration, invasion, lamellipodia formation and cellular energy metabolism in U87 and U251 cells.
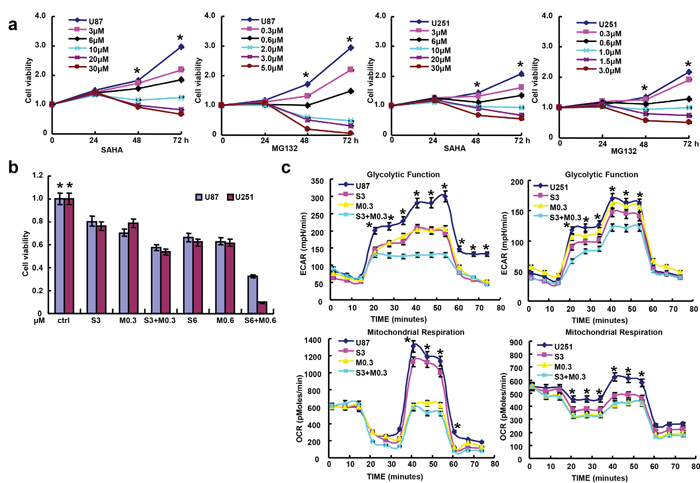
Figure 1: Effects of SAHA or/and MG132 on the proliferation and cellular energy metabolism of glioma cells. MTT assays showed that SAHA or MG132 treatment suppressed the proliferation of U87 and U251 cells in either a concentration- or time-dependent manner a. with an additive effect b. Cellular energy metabolism assay was performed after cells were treated with both drugs for 48 h c. Results are representative of 3 different experiments, and the data is expressed as mean ±standard deviation with the control as “1”. Note: S3, SAHA 3 μM; M0.3, MG132 0.3 μM; S6, SAHA 6 μM; M0.6, MG132 0.6 μM; S3 + M0.3, SAHA 3 μM and MG132 0.3 μM; S6 + M0.6, SAHA 6 μM and MG132 0.6 μM. *p< 0.05, vs treatment groups.
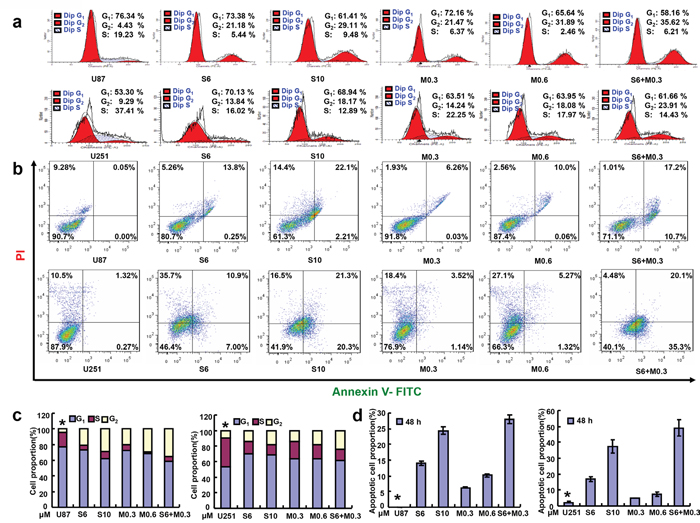
Figure 2: Effects of SAHA or/and MG132 on the cell cycle and apoptosis of glioma cells. Flow cytometric analyses of glioma cell lines after PI staining showed that SAHA or/and MG132 treatment induced G2 arrest in a concentration-dependent manner in U87 and U251 cells after 48 h a, c. SAHA or/and MG132 exposure results in higher levels of apoptosis in U87and U251cells after 48 h b, d. Results are representative of 3 different experiments, and the data is expressed as mean ±standard deviation. Note: S6, SAHA 6 μM; M0.3, MG132 0.3 μM; S10, SAHA 10 μM; M0.6, MG132 0.6 μM; S6 + M0.3, SAHA 6 μM and MG132 0.3 μM. *p < 0.05, vs treatment groups.
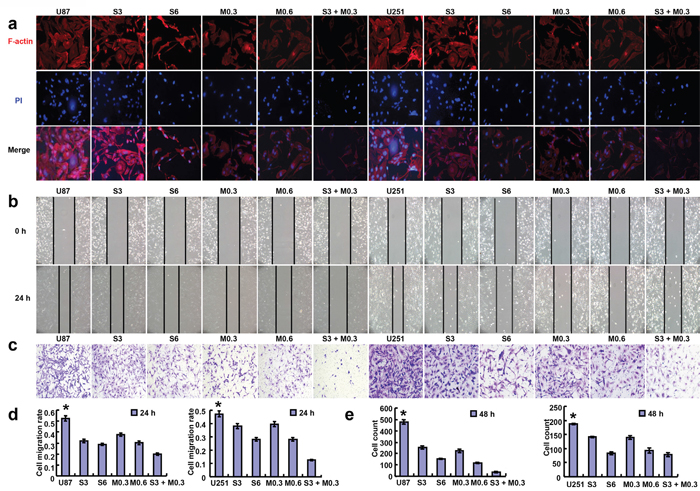
Figure 3: Effects of SAHA or/and MG132 on the migration and invasion of glioma cells. The lamellipodia formation in glioma cells was evaluated by immunofluorescence as indicated by F-actin structure after 48 h (a, 400×). Wound healing assays showed that SAHA or/and MG132 treatment decreased the ability of U87 and U251 cells to migrate in a concentration-dependent manner b, d. and reduced the invasive potential of U87 and U251 cells (c, e, 200×). Results are representative of 3 different experiments, and the data is expressed as mean ±standard deviation. Note: S3, SAHA 3 μM; M0.3, MG132 0.3 μM; S6, SAHA 6 μM; M0.6, MG132 0.6 μM; S3 + M0.3, SAHA 3 μM and MG132 0.3 μM. * p < 0.05, vs treatment groups.
The mRNA and protein expression of phenotype-related molecules in glioma cells after the exposure to SAHA or/and MG132
After the treatment with SAHA or/and MG132, the mRNA expression levels of p21, p27, Cdc25C, Cyclin B1, Cyclin D1, Cdc2, c-myc, Bcl-2, MMP9 and Nanog in U87 and U251 cells were lower than those observed in the control, while the mRNA expression levels of p53, 14-3-3 and Bax were higher than those of control cells (Figure 4a, 4b, p<0.05). According to Western blot, SAHA or/and MG132 exposure up-regulated the expression of acetyl-histones 3 and 4, p53, 14-3-3 and Bax proteins, and down-regulated the expression of p21, p27, Cdc25C, Cyclin B1, Cyclin D1, Cdc2, c-myc, Bcl-2 and MMP9 in both cell lines (Figure 4c).
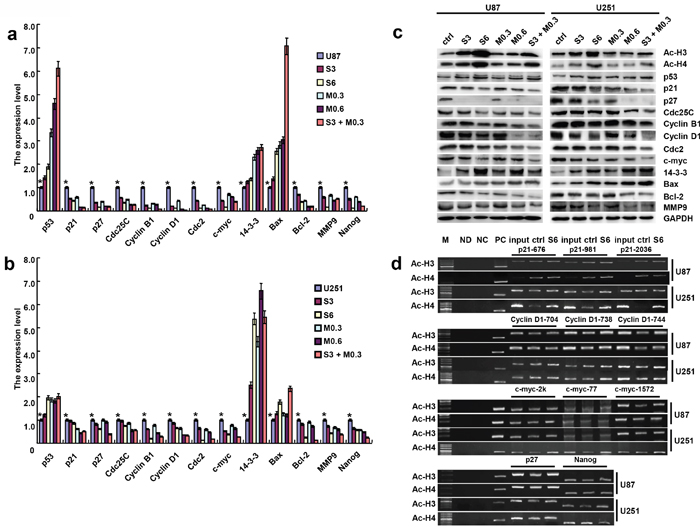
Figure 4: The mRNA and protein expression of gliomas cells treated with SAHA or/and MG132. After the treatment with SAHA or/and MG132, the expression levels of phenotype- related molecules were screened in U87 and U251 cells by real-time RT-PCR a, b. and Western blot c. The promoter binding sites of acetylation-histone 3 and 4 were determined by ChIP; M: DNA marker; ND: No DNA control; NC: Negative control; PC: Positive control d. Results are representative of 3 different experiments, and the data are expressed as mean ±standard deviation with the control as “1”. Note: S3, SAHA 3 μM; M0.3, MG132 0.3 μM; S6, SAHA 6 μM; M0.6, MG132 0.6 μM; S3 + M0.3, SAHA 3 μM and MG132 0.3 μM. *p < 0.05, vs treatment groups.
ChIP assay results indicated that acetyl-histone 3 and 4 bound to the p21, p27, Cyclin D1, c-myc and Nanog promoters. The binding acetyl-histone 3 and 4 to p21, p27, Cyclin D1, c-myc and Nanog promoters were increased after glioma cells were treated with SAHA (Figure 4d).
The association of acetyl-histone 3 and 4 expression with the pathogenesis and clinicopathological parameters of glioma
Acetyl-histones 3 and 4 were positively expressed in glioma tissues (Figure 5b-5d, 5f-5h) and normal brain tissues (Figure 5a, 5e). Based on the expression frequency and density, acetyl- histones 3 and 4 were found to be higher expressed in glioma tissues than normal brain tissues (Table 1, p<0.05). There was a close correlation between acetyl-histone 4 expression and several clinicopathological factors including sex, age and histological subtyping (astrocytoma, anaplastic astrocytoma and glioblastoma) in gliomas (Table 2, p<0.05).
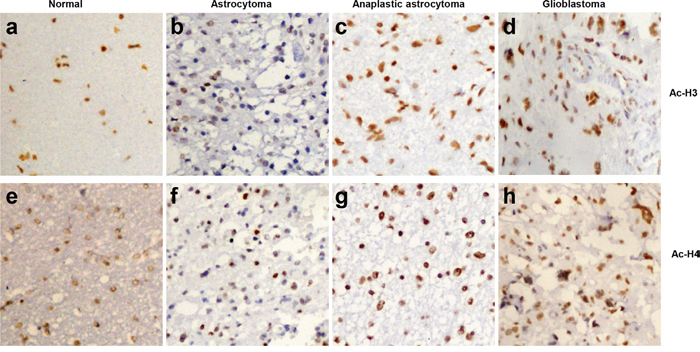
Figure 5: The expression of acetyl-histones 3 and 4 in gliomas. Acetyl-histones 3 and 4 proteins were analyzed by immunohistochemistry (200×) in normal brain tissues a, e. astrocytoma b, f. anaplastic astrocytoma c, g. and glioblastoma d, h.
Table 1: The acetyl-histones 3 and 4 expression levels in glioma tissues
Groups |
acetyl-histone 3 expression |
acetyl-histone 4 expression |
||||||||||||
|---|---|---|---|---|---|---|---|---|---|---|---|---|---|---|
n |
- |
+ |
++ |
+++ |
PR(%) |
p |
n |
- |
+ |
++ |
+++ |
PR(%) |
p |
|
Normal |
33 |
2 |
4 |
17 |
10 |
93.9 |
0.048* |
14 |
3 |
5 |
5 |
1 |
78.6 |
<0.001* |
Cancer |
187 |
9 |
22 |
57 |
99 |
95.2 |
40 |
1 |
7 |
8 |
24 |
97.5 |
||
* p < 0.05, compared to normal brain tissues; PR, positive rate
Table 2: Relationship between acetyl-histones 3 and 4 expression and the clinicopathological features of glioma
Clinicopathological features |
acetyl-histone 3 expression |
acetyl-histone 4 expression |
||||||||||||
|---|---|---|---|---|---|---|---|---|---|---|---|---|---|---|
n |
- |
+ |
++ |
+++ |
PR(%) |
p |
n |
- |
+ |
++ |
+++ |
PR(%) |
p |
|
Sex |
||||||||||||||
Male |
111 |
9 |
14 |
31 |
57 |
91.9 |
0.229 |
111 |
13 |
19 |
33 |
46 |
88.3 |
0.014* |
Female |
75 |
0 |
8 |
25 |
42 |
100 |
76 |
1 |
10 |
23 |
42 |
98.7 |
||
Age (years) |
||||||||||||||
<44 |
83 |
4 |
8 |
25 |
46 |
95.2 |
0.482 |
85 |
7 |
18 |
30 |
30 |
91.8 |
0.004* |
≥44 |
102 |
5 |
14 |
31 |
52 |
95.1 |
101 |
7 |
11 |
25 |
58 |
93.1 |
||
Pathological grading |
||||||||||||||
I-II |
81 |
3 |
7 |
31 |
40 |
96.3 |
0.260 |
84 |
7 |
14 |
34 |
29 |
91.7 |
0.112 |
III-IV |
51 |
5 |
10 |
12 |
24 |
90.2 |
47 |
6 |
6 |
8 |
27 |
87.2 |
||
Pathological classification |
||||||||||||||
astrocytoma |
102 |
8 |
12 |
33 |
49 |
92.2 |
0.384 |
103 |
11 |
20 |
33 |
39 |
89.3 |
0.004* |
anaplastic |
32 |
1 |
4 |
7 |
20 |
96.9 |
31 |
2 |
3 |
7 |
19 |
93.5 |
||
glioblastoma |
26 |
0 |
5 |
8 |
13 |
100 |
25 |
0 |
3 |
7 |
15 |
100 |
||
* p< 0.05; PR, positive rate
SAHA and/or MG132 inhibits glioma growth in vivo
The tumor volumes of U87 xenografts became smaller than the control after the treatment with SAHA or/and MG132 by calculation and weighting (Figure 6a-6c, p<0.05). The suppressing effect was positively correlated with a low proliferation and a high apoptosis in comparison to the control by ki-67 immunostaining and TUNEL assay (Figure 6d). After treatment with SAHA, glioma cells showed a higher expression of acetyl-histones 3 and 4 than the control (Figure 6d).
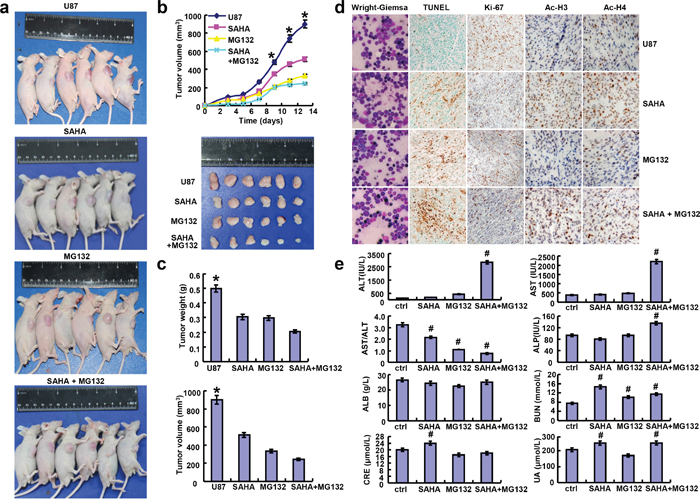
Figure 6: SAHA or/and MG132 suppressed the growth of glioma cells in vivo. After the exposure to SAHA and/ or MG132, the growth of U87 cells was revealed by measurement of tumor size a. and growth curve b. volumeand weight c. Wright-Giemsa staining was used to observe the morphological appearance of bone marrow. Stronger acetyl-histones 3 and 4 staining was observed in SAHA group than the control d. Either weaker ki-67 or stronger TUNEL staining was seen in SAHA or/and MG132 group than the control (d). The serum levels of ALT, AST, ALP, ALB, BUN, CRE and UA were measured by automatic biochemical analyzer e. Note: SAHA, 20 mg/kg; MG132, 2 mg/kg; SAHA+MG132, SAHA 20 mg/kg and MG132 2 mg/kg. *p< 0.05, vs treatment groups; #p < 0.05, vs control group.
According to bone marrow staining, we found that SAHA or/and MG132 didn’t suppress the hematopoiesis (Figure 6d). However, SAHA or MG132 exposure increased the serum level of blood urea nitrogen (BUN), and the combination of both reagents had a worse effect on alanine aminatransferase (ALT), aspartate aminotransferase (AST) and alkaline phosphatase (ALP), but the converse was true for AST/ALT. There appeared a high level of creatinine (CRE) and uric acid (UA) in tumor-bearing nude mice, exposed to SAHA alone (Figure 6e, p<0.05).
DISCUSSION
The anti-tumor effects of SAHA have been reported in chronic myelogenous leukemia [7], lung [8], pancreatic [9], liver [10], cervical [11], head and neck [12], breast [13] and ovarian cancers [14]. In a clinical phase I study of advanced leukemias and myelodysplastic syndrome, a significant antileukemia activity was observed at or below maximum tolerated dose, and SAHA effectively inhibited HDAC activity in peripheral blood and bone marrow blasts [15]. Reportedly, co-administration of ABT-737 and SAHA can induce apoptosis in PTEN-intact malignant human glioma cells [16]. Continuous intracranial administration of SAHA inhibits tumor growth in an orthotopic glioma model [17]. Glutamate transporter xCT promotes glioma progression and SAHA specifically inhibits the xCT transporter expression to normalize the glioma microenvironment [18]. Here, we found that SAHA inhibited cell viability, energy metabolism of both cells lines, induced apoptosis, G2 arrest and inhibited migration, invasion and the ability to form lamellipodia in U87 and U251 glioma cells when used alone. The combination of MG132 and SAHA exhibited an additive effect, suggesting that this dual effect may more effective in the treatment of glioma than SAHA alone.
In the present study, we for the first time found that SAHA or/and MG132 might remarkably inhibit glioma growth in tumor-bearing mice with no marrow toxicity, but hepatic and renal toxicity occurred. Furthermore, their inhibitory effects were closely linked to lower proliferation and higher apoptosis. Reportedly, the combination of SAHA and XL184 synergistically induced cell apoptosis and inhibited tumor growth of prostate and lung cancer cells [19]. The similar results were observed in gastric [20] and hepatocellular [21] cancer cells, treated by oxaliplatin and SAHA. Therefore, they might be employed to treat the glioma if both hepatic and renal injuries are avoided and ameliorated in clinical practice.
Both p21 and p27 can interact with cyclin-CDK complex to arrest G1 phage of cell cycle. SAHA or/and MG132 treatment resulted in significant decreases in mRNA and protein expression of p21 and p27 in both glioma cells, suggesting that SAHA down-regulated p21 and p27 for G2 arrest [22]. Cdc25C gene contains tumor suppressor p53 binding sites and is demonstrated to contribute to the p53-dependent cell cycle arrest [23]. Cyclin B1 is involved in the early events of mitosis by interacting with Cdk1, and Cdc2 is an M-phase promoting factor that induces entry into mitosis [24–26]. Our results showed that the mRNA and protein expression of p53 were significantly increased by SAHA or/and MG132 treatment, but Cdc2, Cyclin B1 and Cdc25C decreased, indicating their roles in G2 arrest. Cell apoptosis was induced by the translocation of Bax to mitochondria through phosphorylation of 14-3-3 [27]. SAHA or/and MG132 induced apoptosis in the glioma cells was attributable to the down-regulation of Bcl-2 protein levels and the up-regulation of 14-3-3, Bax, Caspase 9, Capase 3 expression via extrinsic and intrinsic pathways [28, 29]. Our results also showed that SAHA or/and MG132 decreased expression of MMP9 and Nanog in both glioma cells. MMP9 overexpression enhances cancer metastasis via breakdown of the extracellular matrix [30]. Nanog is a stem cell transcription factor that is essential for malignant transformation and progression [31]. It has been reported that down regulation of Nanog by histone deacetylase inhibitor could lead to cell cycle arrest, differentiation and apoptosis in human embryonic carcinoma NCCIT cells [32].
Here, we performed the ChIP assay with the antibodies against acetyl-histone 3 and 4 targeting the promoters of p21, p27, Cyclin D1, c-myc and Nanog. It was found that SAHA promoted acetylation of histones 3 and 4 in glioma cells, which were recruited to the promoter of p21, p27, Cyclin D1, c-myc and Nanog for their down-regulated transcription. To investigate the clinicopathological significance of both of these acetyl-histone proteins, we carried out immunohistochemistry analysis. There showed a significantly higher expression of both acetyl-histone 3 and 4 in gliomas than in normal brain tissues. These findings suggest that the overexpression of both the proteins may be a reactive response in glioma. Additionally, acetyl-histone 4 expression was positively correlated with histological aggressiveness of glioma in line with the data from renal cell carcinomas [33]. In our previous study, we found that acetyl-histone 4 expression was highly expressed in more poorly- differentiated ovarian cancer in agreement with this finding [34]. Therefore, the expression of acetyl-histones 3 and 4 would be potential marker to monitor the efficacy of SAHA as described in peripheral blood mononuclear cells [15].
In line with our results, it was found that the combination of SAHA with cisplatin or decitabine could enhance the anti-tumor effect in oral squamous cell carcinoma [35] and a clinical study [36]. The combination of MG132 with cisplatin or arsenic trioxide could increase sensitivity to drug therapy in ovarian cancer [37] or Raji cells [38]. But the serum toxicity of combined drugs in nude mice was not reported. In agreement with the result from O'Connor et al. [39], our study showed that the nude mice serum analysis showed that the level of CRE, UA and BUN were higher exposed to SAHA alone. Therefore, they can be employed to kill or inhibit cancer cell growth at an additive manner, but its safety and effectiveness should be monitored in clinical practice.
In conclusion, SAHA and MG132 in vitro and vivo have an additive effect in glioma cell lines by inducing apoptosis, G2 arrest, and suppressing proliferation, energy metabolism, migration, invasion, lamellipodia formation and tumor growth. SAHA may increase the expression of acetyl-histones 3 and 4 and thereby down-regulate the mRNA expression of downstream genes, including p21, p27, Cyclin D1, c-myc and Nanog. Overexpression of these acetyl-histones may be positively linked to the tumorigenesis and differentiation of glioma. Therefore, SAHA or/and MG132 could potentially be employed as a chemotherapeutic agent in clinical practice, but we must prevent the hepatic and renal toxicity in glioma treatment.
MATERIALS AND METHODS
Cell culture
Glioma cells U87 and U251 were obtained from ATCC (Manassas, VA, USA) and grown in a humidified atmosphere of 5% CO2 at 37 °C in MEM (U87) or DMEM (U251) with 10% fetal bovine serum (FBS), 100 U/ml penicillin and 100 μg/ml streptomycin added. All cells were collected by centrifugation, washed in phosphate buffered saline (PBS) and subjected to RNA and protein extraction. We treated glioma cells to SAHA (Sigma, USA) and MG132 (Sigma, USA) for the following experiments.
Proliferation assay
Cells were planted at 2.0×10³ cells per well in 96-well plates and maintained in media containing 10% FBS. At the time points, 20 μl of 5 mg/ml MTT was added to each well, and then incubated for 4 h at 37 °C. After that, the media was discarded, and 150 μl of DMSO was added to each well to dissolve the precipitates. The absorbance was measured at 490 nm using a microplate reader (M200pro, Switzerland).
Cellular energy metabolism
Mitochondrial respiration and glycolysis were measured by Seahorse XF Extracellular Flux Analyzer. Respiration and glycolysis are respectively measured as the rate of oxygen consumption (OCR) and extracellular acidification (ECAR). According to the standard protocol, we injected the regents in the following order: 10 mM glucose, 1.5 μM oligomycin (which blocks ATP synthase to assess respiration required for ATP turnover), 50 mM 2-DG for glycolysis assay and 1.5 μM oligomycin, 2 μM FCCP (a proton ionophore which induces chemical uncoupling and maximal respiration), 0.5 μM rotenone and antimycin A (which completely inhibits electron transport to measure non-mitochondrial respiration) for mitochondrial respiration. OCR and ECAR values were determined from 3 wells per sample and experiments were replicated.
Cell cycle analysis
After the treatment of reagents, each group cells were washed twice with PBS, and then detached by trypsinization. Cells were collected and added with 1 ml precool 70% ethanol for at least 2 h. The cells were washed twice with PBS again and incubated for 1 h at 37°C with 1 ml RNase (0.25 mg/ml). The cells were resuspended in propidium iodide (PI) at a concentration of 50 μg/ml and cycle analysis was performed by flow cytometry.
Apoptosis assay
The apoptosis rate was determined by using PI and FITC-labeled annexin V (KeyGEN Biotech, Nanjing, China) following the manufacturer's instruction. In brief, cells were washed twice with ice-cold PBS, resuspended in 200 μl 1×binding Buffer at a concentration of 1×10⁶ cells/ml, incubated with 10 μl FITC-Annexin V for 15 min in the dark and then resuspended in 300 μl 1×bingding buffer with 5 μl PI added. Flow cytometry was performed within 1 h of incubation and apoptosis was analyzed by FlowJo software.
Immunofluorescence
2.0×10³ cells were planted in 6-well plates with glass coverslips, fixed with 4% paraformldehyde for 15 min and permeabilized with 0.5% Triton X-100 in PBS for 15 min at room temperature. After washed with PBS, the cells were incubated overnight at 4°C with 5 μg/ml Phalloidin (Invitrogen, Carlsbad, CA, USA). Nuclei were stained with 1 mg/ml DAPI (Sigma, USA) for 2-3 min at room temperature. The coverslips were then mounted with anti-fade mounting medium and observed under a confocal laser microscope.
Wound healing assay
Cell migration was assessed using a wound healing assay as described previously [34]. Briefly, cells of 6×10⁵ were seeded into 6-well plate and incubated overnight. A scratch wound was made with a tip. Cells were washed three times with PBS, and cultured in FBS-free media, photographed after 24 h. The scratch area was measured using Image pro-Plus 6.0.
Cell invasion assay
Cell invasion assay was conducted using a matrigel-coated transwell inserts. 2.5×10⁵ cells were resuspended in 200 μl serum-free MEM (U87) or DMEM (U251) and planted to each insert. 600 μl of media was added to the lower chambers contained 10% FBS. After incubation at 37 °C and 5% CO2 for 48 h, the cells on the upper surface of the inserts were wiped away with a cotton swab. The cells on the lower surface of the membrane were washed twice with PBS, fixed with 4% paraformaldehyde for 15 min, washed with PBS again, and stained with crystal violet dye (0.1%) for the measurement.
Real-time reverse transcriptase–polymerase chain reaction (RT-PCR)
Total RNA was isolated from glioma cells after 48 h of treatment using Trizol (Takara, Japan) and quantified by a Nanodrop spectrophotometer (Wilmington, USA). Reverse transcription was performed from 2 μg of total RNA using AMV reverse transcriptase and random primers (Takara, Japan). PCR primers were designed according to the sequences in GenBank and are listed in Table 3. Amplification of cDNA was performed using SYBR Premix Ex Taq II kit (Takara, Japan) using GAPDH as an internal control.
Table 3: Primer sequences selected for real-time RT-PCR
Name |
Primer sequence |
Distribution |
AT(°C) |
Product size (bp) |
Extension time (s) |
|---|---|---|---|---|---|
p53 |
F: 5' - ACCTATGGAAACTACTTCCTGA - 3' |
NM_001276696.1 |
60 |
139 |
39 |
p21 |
F: 5' - ACTGTCTTGTACCCTTGTGCC - 3' |
XM_003950827 |
60 |
108 |
39 |
pP27 |
F: 5' - GGCTCCGGCTAACTCTGA - 3' |
XM_522347 |
60 |
157 |
39 |
Cdc25C |
F: 5' - ACTGGTCACCTGGATTCTT - 3' |
XM_011543763.1 |
60 |
113 |
39 |
Cyclin B1 |
F: 5' - GTTATGCAGCACCTG - 3' |
NM_001088590 |
60 |
150 |
39 |
Cyclin D1 |
F: 5' - TGCCACAGATGTGAAGTTCATT - 3' |
NG_000002 |
60 |
162 |
39 |
Cdc2 |
F: 5' - GGGCACTCCCAATAA - 3' |
XM_572099 |
60 |
93 |
39 |
c-myc |
F: 5' - AGCGACTCTGAGGAGGAACA - 3' |
XM_00676 |
60 |
108 |
39 |
14-3-3 |
F: 5' - CAAAGACAGCACCCTCA - 3' |
XM_010379682.1 |
60 |
91 |
39 |
Bax |
F: 5' - GATTGCCGCCGTGGAC - 3' |
DQ926869 |
60 |
88 |
39 |
Bcl-2 |
F: 5' - GCCTTCTTTGAGTTCGGTGGG - 3' |
DQ926871 |
60 |
115 |
39 |
MMP9 |
F: 5' - TGTACCGCTATGGTTACACT - 3' |
KJ897197.1 |
60 |
189 |
39 |
Nanog |
F: 5' -CAAAGGCAAACAACCCACTT- 3' |
NM_024865.2 |
60 |
158 |
39 |
GAPDH |
F: 5' - CAATGACCCCTTCATTGACC - 3' |
NM_ 002046.3 |
60 |
135 |
39 |
Abbreviation: AT, annealing temperature
Western blot analysis
Cells were washed with cold PBS twice and sonicated in RIPA lysis buffer. Protein assays were performed by Kaumas brilliant blue method, resolved in 10% SDS-PAGE and electrotransferred to a PVDF membrane. The membrane was blocked with 5 % skim milk in Tris-buffered saline with Tween 20 for 1 h at room temperature and incubated with the primary antibodies (Table 4) on the shaker at 4 °C overnight. The membranes were rinsed with TBST, and incubated with anti-rabbit, anti-mouse or anti-goat IgG antibody conjugated to horseradish peroxidase (HRP, Dako, USA). Bands were visualized with LAS4010 (GE healthcare Life Science, USA) by ECL-Plus detection reagents (Santa Cruz, USA). Densitometric quantification of protein bands was performed with GAPDH as a control using Image J (NIH, USA).
Table 4: Antibodies used for western blot
Name |
Source |
Dilution |
Company |
|---|---|---|---|
Ac-histone 3 (Lys 9/14) |
Goat |
1:500 |
Santa Cruz Biotechnology |
Ac-histone 4 (Lys 8) |
Rabbit |
1:500 |
Santa Cruz Biotechnology |
p53 |
Rabbit |
1:1000 |
Wanleibio |
p21 (F-5) |
Mouse |
1:500 |
Santa Cruz Biotechnology |
p27 (C-19) |
Rabbit |
1:500 |
Santa Cruz Biotechnology |
Cdc25C |
Rabbit |
1:1000 |
Wanleibio |
Cyclin B1 |
Rabbit |
1:1000 |
Wanleibio |
Cyclin D1 (H-295) |
Rabbit |
1:500 |
Santa Cruz Biotechnology |
Cdc2 (C-9) |
Mouse |
1:500 |
Santa Cruz Biotechnology |
c-myc (9E10) |
Mouse |
1:500 |
Santa Cruz Biotechnology |
14-3-3 (H-8) |
Mouse |
1:500 |
Santa Cruz Biotechnology |
Bax (B-9) |
Mouse |
1:500 |
Santa Cruz Biotechnology |
Bcl-2 (C21) |
Rabbit |
1:300 |
Santa Cruz Biotechnology |
MMP9 |
Rabbit |
1:1000 |
Wanleibio |
ki-67 |
Rabbit |
1:80 |
Abcam |
GAPDH |
Rabbit |
1:2000 |
Wanleibio |
Chromatin immunoprecipitation
ChIP assays were performed with ChIP assay kit (MILLIPORE Magna ChIPTM G). U87 and U251 cells were fixed with 1% formaldehyde for 10 min and quenched with 0.25 mM glycine. Immunoprecipitation was performed with the following antibody against acetyl-histone H3 (Lys 9/14, Santa Cruz, USA), acetyl-histone H4 (Lys 8, Santa Cruz, USA), RNA Polymerase II (05-623B, MILLIPORE) or normal mouse IgG (12-371B, MILLIPORE). DNA was purified using spin columns. PCR reaction was performed as follows: initial denaturation at 95 °C for 5 min followed by 30 cycles of denaturation at 95 °C for 30 s, then annealing for 30 s and extension at 72 °C for 30 s. PCR primers are listed in Table 5.
Table 5: Primer sequences for ChIP
Name |
Primer sequence |
AT (°C) |
Product size (bp) |
Extension time (s) |
|---|---|---|---|---|
p21-676 |
F:5'-CCCGGAAGCATGTGACAATC-3' |
56 |
354 |
30 |
p21-981 |
F:5'-GGAGGCAAAAGTCCTGTGTTC-3' |
56 |
306 |
30 |
p21-2036 |
F:5'-GGAGTCAGATTCTGTGTGTG-3' |
56 |
368 |
30 |
Cyclin D1-704 |
F:5'-TGAAAATGAAAGAAGATGCAGTCG-3' R:5'-CTGTAGTCCGGTTTTCATAGAAATGC-3' |
57 |
328 |
30 |
Cyclin D1-738 |
F:5'-GTCCTACTTCAAATGTGTGCAGAAGG-3' |
57 |
290 |
30 |
Cyclin D1-744 |
F:5'-CCCAGTTACTGTCGTTATCTCTCATC-3' |
57 |
294 |
30 |
c-myc-2k |
F:5'-TCACGTTTGCCATTACCGGTTC -3' |
58 |
171 |
30 |
c-myc-77 |
F:5'-CAGGGCTTCTCAGAGGCTTGG-3' |
58 |
162 |
30 |
c-myc-1572 |
F:5'-CAGATCAGCAACAACCG AAA-3' |
58 |
167 |
30 |
p27 |
F: 5' -CTGTCACATTCTGGAGCGTA- 3' |
60 |
230 |
30 |
Nanog |
F: 5' -GTTCTGTTGCTCGGTTTTCT- 3' |
60 |
95 |
30 |
Poly II |
F: 5' -TACTAGCGGTTTTACGGGCG- 3' |
59 |
116 |
30 |
Abbreviation: AT, annealing temperature
Selection of patient samples
A total of 220 glioma cases were collected from surgical resection in The First Affiliated Hospital of Jinzhou Medical University (n=100) from 2002 to 2014, and Shengjing Hospital of China Medical University (n=120) from 2007 to 2014. The average age of the patients at surgery was 43.4 years (2-80 years). The majority of samples were routinely prepared for storage in pathological blocks. None of the patients had undergone chemotherapy, radiotherapy or adjuvant treatment prior to surgery. Informed written consent was obtained from all participants and the study was approved by Ethics Committees of both Universities.
Pathology and tissue microarray (TMA)
All tissues were fixed in 10% neutral formalin, embedded in paraffin and sliced into 4 μm- thick sections. The sections were stained with hematoxylin-and-eosin (HE) for histological analysis. The clinicopathological staging was evaluated for each glioma sample according to TNM staging system. Tumor histology was determined according to World Health Organization classification system.
Representative areas of solid tumors were identified in HE-stained slices of selected tumor samples and 2mm-in-diameter tissue cores were punched out from each donor block and transferred to a recipient block using a Tissue Microarrayer (AZUMAYA KIN-1, Tokyo, Japan). Consecutive 4μm sections were incised from the recipient block and transferred to poly-lysine-coated glass slides.
Xenograft models
Balb/c nude mice of 6-8 weeks were kept in a specific pathogen-free (SPF) facility with a 12 h light/dark cycle. The experiments were carried out in accordance to Animal Experiment Ethical Statement. All experimental protocols were approved by The First Affiliated Hospital of Jinzhou Medical University Ethics Committee.
U87 cells were detached by trypsinization, washed and re-suspended in serum-free medium. Subcutaneous xenografts were established by injection of 1× 10⁶ cells per mouse to axilla (n=6 mice/group). Until tumor diameter reached 8 mm, we began to intraperitoneally inject 20 mg/kg SAHA, 2 mg/kg MG132 and 20 mg/kg SAHA + 2 mg/kg MG132 into mice from 8th, 10th, and 12th day of cell injection. Tumor growth was then monitored for 13 days and calculated as follows: length×width×width×0.5. At the end of the experiment, mice from each group was anesthetized, photographed, and sacrificed for further analysis.
In brief, the peripheral blood of nude mice was collected from abdominal vein after being killed by cervical dislocation, kept into a venous blood sample collection vessel, and centrifuged at 4000 rpm per minutes for 5 min. After that, the supernatant was analyzed for alanine aminatransferase (ALT), aspartate aminotransferase (AST), alkaline phosphatase (ALP), albumin (ALB), blood urea nitrogen (BUN), creatinine (CRE) and uric acid (UA) by automatic biochemical analyzer (Hitachi 7600, Japan). The bone marrow was taken out from femurs of nude mice for Giemsa-Wright staining.
Immunohistochemistry (IHC)
IHC was carried out on consecutive 4 μm-thick sections using intermittent microwave irradiation two-step method [40]. The samples were deparaffinized with xylene three times, rehydrated with alcohol, and subjected to antigen retrieval by heating in target retrieval solution (TRS, Dako, Japan) for 20 min in a microwave oven. The sections were quenched with 3% hydrogen peroxide for 5 min to block endogenous peroxidase activity. Non-specific binding was prevented by adding 5% bovine serum albumin for 5 min. The sections were incubated with rabbit anti-acetyl-histone-3 (1:200, Lys 9/14, Santa Cruz, USA), rabbit anti-acetyl-histone H4 (1:200, Lys 8, Santa Cruz, USA) or rabbit anti-ki-67 (1:80, Abcam, UK) for 2 h, then incubated with anti-rabbit antibody conjugated to HRP (Dako) for 1 h. After each treatment, all sections were washed three times with TBST and the binding sites were visualized with diaminobenzidine (DAB). After counterstained with hematoxylin, the sections were dehydrated, cleared and mounted. Two independent observers (YXF and ZZJ) randomly selected five representative fields from each section. Any discrepancies were checked by both observers until a consensus was reached. Positive expression was graded as follows: “–” = negative, “+” = 1–50%, “++” = 50–74%, “+++” = ≥ 75%.
Terminal deoxynucleotide transferase mediated dUTP nick labeling (TUNEL)
TUNEL was performed using Apoptosis Detection Kit (Millipore, USA). According the manufacturer’s instruction, paraffin-embedded sections were incubated with proteinase K at 37 °C for 30 min. Endogenous peroxidase activity was blocked by incubation with 3 % hydrogen peroxide in methanol. The sections were washed three times with PBS then subjected to TUNEL staining. The conjugated horseradish peroxidase was visualized with DAB, followed by counterstaining with methyl green.
Statistical analysis
Statistical evaluation was performed using Spearman’s correlation coefficient to analyze ranked data, and Mann-Whitney U to differentiate the means of different groups. The correlations were performed using linear regression analysis. A p-value < 0.05 was considered as statistically significant. SPSS 10.0 software was employed to analyze all data.
ACKNOWLEDGMENTS
This study was supported by President Fund of Jinzhou Medical University (XZJJ20140201; XZJJ20140203; AH2015010; AH2015009), Liaoning BaiQianWan Talents Program, A Project Supported by Scientific Research Fund of Liaoning Provincial Education Department (LJQ2014093); a Key Scientific and Technological Project of Liaoning Province (2015408001) and National Natural Scientific Foundation of China (81472544; 81672700).
CONFLICTS OF INTEREST
The authors have declared that no competing interests exist.
REFERENCES
1. Mirimanoff RO. High-grade gliomas: reality and hopes. Chin J Cancer. 2014; 33:1-3.
2. Farina P, Lombardi G, Bergo E, Roma A, Zagonel V. Treatment of malignant gliomas in elderly patients: a concise overview of the literature. Biomed Res Int. 2014; 734281.
3. Li D, Marchenko ND, Moll UM. SAHA shows preferential cytotoxicity in mutant p53 cancer cells by destabilizing mutant p53 through inhibition of the HDAC6-Hsp90 chaperone axis. Cell Death Differ. 2011; 18:1904-1913.
4. Kim YZ. Altered histone modifications in gliomas. Brain Tumor Res Treat. 2014; 2:7-21.
5. Hockly E, Richon VM, Woodman B, Smith DL, Zhou X, Rosa E, Sathasivam K, Ghazi-Noori S, Mahal A, Lowden PA, Steffan JS, Marsh JL, Thompson LM, Lewis CM, Marks PA, Bates GP. Suberoylanilide hydroxamic acid, a histone deacetylase inhibitor, ameliorates motor deficits in a mouse model of Huntington's disease. Proc Natl Acad Sci U S A. 2003; 100:2041-2046.
6. Cui W, Bai Y, Luo P, Miao L, Cai L. Preventive and therapeutic effects of MG132 by activating Nrf2-ARE signaling pathway on oxidative stress-induced cardiovascular and renal injury. Oxid Med Cell Longev. 2013; 306073.
7. Bu Q, Cui L, Li J, Du X, Zou W, Ding K, Pan J. SAHA and S116836, a novel tyrosine kinase inhibitor, synergistically induce apoptosis in imatinib-resistant chronic myelogenous leukemia cells. Cancer Biol Ther. 2014; 15:951-962.
8. Lee TG, Jeong EH, Kim SY, Kim HR, Kim CH. The combination of irreversible EGFR TKIs and SAHA induces apoptosis and autophagy-mediated cell death to overcome acquired resistance in EGFR T790M-mutated lung cancer. Int J Cancer. 2015; 136:2717-2729.
9. Kumagai T, Wakimoto N, Yin D, Gery S, Kawamata N, Takai N, Komatsu N, Chumakov A, Imai Y, Koeffler HP. Histone deacetylase inhibitor, suberoylanilide hydroxamic acid (Vorinostat, SAHA) profoundly inhibits the growth of human pancreatic cancer cells. Int J Cancer. 2007; 121:656-665.
10. Liang BY, Xiong M, Ji GB, Zhang EL, Zhang ZY, Dong KS, Chen XP, Huang ZY. Synergistic suppressive effect of PARP-1 inhibitor PJ34 and HDAC inhibitor SAHA on proliferation of liver cancer cells. J Huazhong Univ Sci Technolog Med Sci. 2015; 35:535-540.
11. Xing J, Wang H, Xu S, Han P, Xin M, Zhou JL. Sensitization of suberoylanilide hydroxamic acid (SAHA) on chemoradiation for human cervical cancer cells and its mechanism. Eur J Gynaecol Oncol. 2015; 36:117-122.
12. Kumar B, Yadav A, Lang JC, Teknos TN, Kumar P. Suberoylanilide hydroxamic acid (SAHA) reverses chemoresistance in head and neck cancer cells by targeting cancer stem cells via the downregulation of nanog. Genes Cancer. 2015; 6:169-181. doi: 10.18632/genesandcancer.54.
13. Min A, Im SA, Kim DK, Song SH, Kim HJ, Lee KH, Kim TY, Han SW, Oh DY, Kim, TY, O'Connor MJ, Bang YJ. Histone deacetylase inhibitor, suberoylanilide hydroxamic acid (SAHA), enhances anti-tumor effects of the poly (ADP-ribose) polymerase (PARP) inhibitor olaparib in triple-negative breast cancer cells. Breast Cancer Res. 2015; 17:33.
14. Liu Z, Tong Y, Liu Y, Liu H, Li C, Zhao Y, Zhang Y. Effects of suberoylanilide hydroxamic acid (SAHA) combined with paclitaxel (PTX) on paclitaxel-resistant ovarian cancer cells and insights into the underlying mechanisms. Cancer Cell Int. 2014; 14:112.
15. Garcia-Manero G, Yang H, Bueso-Ramos C, Ferrajoli A, Cortes J, Wierda WG, Fader S, Koller C, Morris G, Rosner G, Loboda A, Fantin VR, Randolph SS, Hardwick JS, Reilly JF, Chen C, Ricker JL, Secrist JP, Richon VM, Frankel SR, Kantarjian HM. Phase 1 study of the histone deacetylase inhibitor vorinostat (suberoylanilide hydroxamic acid [SAHA]) in patients with advanced leukemias and myelodysplastic syndromes. Blood. 2008; 111:1060-1166.
16. Foster KA, Jane EP, Premkumar DR, Morales A, Pollack IF. Co-administration of ABT-737 and SAHA induces apoptosis, mediated by Noxa upregulation, Bax activation and mitochondrial dysfunction in PTEN-intact malignant human glioma cell lines. J Neurooncol. 2014; 120:459-472.
17. Ugur HC, Ramakrishna N, Bello L, Menon LG, Kim SK, Black PM, Carroll RS. Continuous intracranial administration of suberoylanilide hydroxamic acid (SAHA) inhibits tumor growth in an orthotopic glioma model. J Neurooncol. 2007; 83:267-275.
18. Wolf IM, Fan Z, Rauh M, Seufert S, Hore N, Buchfelder M, Savaskan NE, Eyüpoglu IY Histone deacetylases inhibition by SAHA/Vorinostat normalizes the glioma microenvironment via xCT equilibration. Sci Rep. 2014; 4:6226.
19. Ding L, Zhang Z, Liang G, Yao Z, Wu H, Wang B, Zhang J, Tariq M, Ying M, Yang B. SAHA triggered MET activation contributes to SAHA tolerance in solid cancer cells. Cancer Lett. 2015; 356:828-836.
20. Chang H, Rha SY, Jeung HC, Jung JJ, Kim TS, Kwon HJ, Kim BS, Chung HC. Identification of genes related to a synergistic effect of taxane and suberoylanilide hydroxamic acid combination treatment in gastric cancer cells. J Cancer Res Clin Oncol. 2010; 136:1901-1913.
21. Liao B, Liang H, Chen J, Liu Q, Zhang B, Chen X. Suberoylanilide hydroxamic acid enhances chemosensitivity to 5-fluorouracil in hepatocellular carcinoma via inhibition of thymidylate synthase. Tumour Biol. 2015; 36:9347-9356.
22. Zhou Q, Dalgard CL, Wynder C, Doughty ML. Histone deacetylase inhibitors SAHA and sodium butyrate block G1-to-S cell cycle progression in neurosphere formation by adult subventricular cells. BMC Neurosci. 2011; 12:50.
23. Le GG, Esteve PO, Ferec C, Pradhan S. DNA damage-induced down-regulation of human Cdc25C and Cdc2 is mediated by cooperation between p53 and maintenance DNA (cytosine-5) methyltransferase 1. J Biol Chem. 2006; 281:24161-24170.
24. Wu G, Lin N, Xu L, Liu B, Feitelson MA. UCN-01 induces S and G2/M cell cycle arrest through the p53/p21(waf1) or CHK2/CDC25C pathways and can suppress invasion in human hepatoma cell lines. BMC Cancer. 2013; 13:167.
25. Hu X, Moscinski LC. Cdc2: a monopotent or pluripotent CDK. Cell Prolif. 2011; 44:205-211.
26. Miyazaki T, Arai S. Two distinct controls of mitotic cdk1/cyclin B1 activity requisite for cell growth prior to cell division. Cell Cycle. 2007; 6:1419-1425.
27. Ucar EO, Arda N, Aitken A. Extract from mistletoe, Viscum album L., reduces Hsp27 and 14-3-3 protein expression and induces apoptosis in C6 rat glioma cells. Genet Mol Res. 2012; 11:2801-2813.
28. Harmalkar M, Upraity S, Kazi S, Shirsat NV. Tamoxifen-induced cell death of malignant glioma cells is brought about by oxidative-stress-mediated alterations in the expression of BCL2 family members and is enhanced on miR-21 inhibition. J Mol Neurosci. 2015; 57:197-202.
29. Tsuruta F, Sunayama J, Mori Y, Hattori S, Shimizu S, Tsujimoto Y, Yoshioka K, Masuyama N, Gotoh Y. JNK promotes Bax translocation to mitochondria through phosphorylation of 14-3-3 proteins. EMBO J. 2004; 23:1889-1899.
30. Zheng H, Takahashi H, Murai Y, Cui Z, Nomoto K, Niwa H, Tsuneyama K, Takano Y. Expressions of MMP-2, MMP-9 and VEGF are closely linked to growth, invasion, metastasis and angiogenesis of gastric carcinoma. Anticancer Res. 2006; 26:3579-3583.
31. Yang Y, Niu CS, Cheng CD. Pin1-Nanog expression in human glioma is correlated with advanced tumor progression. Oncol Rep. 2013; 30:560-566.
32. You JS, Kang JK, Seo DW, Park JH, Park JW, Lee JC, Jeon YJ, Cho EJ, Han JW. Depletion of embryonic stem cell signature by histone deacetylase inhibitor in NCCIT cells: involvement of Nanog suppression. Cancer Res. 2009; 69:5716-5725.
33. Juengel E, Makarevi J, Tsaur I, Bartsch G, Nelson K, Haferkamp A, Blaheta RA. Resistance after chronic application of the HDAC-inhibitor valproic acid is associated with elevated Akt activation in renal cell carcinoma in vivo. PLoS One. 2013; 8:e53100.
34. Chen S, Zhao Y, Gou WF, Zhao S, Takano Y, Zheng HC. The anti-tumor effects and molecular mechanisms of suberoylanilide hydroxamic acid (SAHA) on the aggressive phenotypes of ovarian carcinoma cells. PLoS One. 2013; 8:e79781.
35. Li J, Gong C, Feng X, Zhou X, Xu X, Xie L, Wang R, Zhang D, Wang H, Deng P, Zhou M, Ji N, Zhou Y, Wang Y, Wang Z, Liao G, Geng N, Chu L, Qian Z, Wang Z, Chen Q Biodegradable thermosensitive hydrogel for SAHA and DDP delivery: therapeutic effects on oral squamous cell carcinoma xenografts. PLoS One. 2012; 7:e33860.
36. Patel K, Guichard SM, Jodrell DI. Simultaneous determination of decitabine and vorinostat (Suberoylanalide hydroxamic acid, SAHA) by liquid chromatography tandem mass spectrometry for clinical studies. J Chromatogr B Analyt Technol Biomed Life Sci. 2008; 863:19-25.
37. Guo N, Peng Z, Zhang J. Proteasome inhibitor MG132 enhances sensitivity to cisplatin on ovarian carcinoma cells in vitro and in vivo. Int J Gynecol Cancer. 2016; 26:839-844.
38. Cavaliere V, Lombardo T, Costantino SN, Kornblihtt L, Alvarez EM, Blanco GA. Synergism of arsenic trioxide and MG132 in Raji cells attained by targeting BNIP3, autophagy, and mitochondria with low doses of valproic acid and vincristine. Eur J Cancer. 2014; 50:3243-3261.
39. O'Connor OA, Heaney ML, Schwartz L, Richardson S, Willim R, MacGregor-Cortelli B, Curly T, Moskowitz C, Portlock C, Horwitz S, Zelenetz AD, Frankel S, Richon V, Marks P, Kelly WK. Clinical experience with intravenous and oral formulations of the novel histone deacetylase inhibitor suberoylanilide hydroxamic acid in patients with advanced hematologic malignancies. J Clin Oncol. 2006; 24:166-173.
40. Kumada T, Tsuneyama K, Hatta H, Ishizawa S, Takano Y. Improved 1-h rapid immunostaining method using intermittent microwave irradiation: practicability based on 5 years application in Toyama Medical and Pharmaceutical University Hospital. Mod Pathol. 2004;17:1141-1149.