
Introduction
The proportion of the population that is overweight or obese has increased dramatically worldwide in recent decades, and obesity has become an important public health issue [1]. Obesity is linked to the development of many diseases, including metabolic syndromes, diabetes mellitus, cardiovascular diseases, and cancers [2]. Recent research has also indicated that being overweight or obese is strongly associated with disc degeneration [3, 4]; in particular, abdominal obesity has been implicated in lumbar disc degeneration [5], which is related to lower back pain (LBP) and diminished physical and social functioning [6, 7]. Several mechanisms, including mechanical overloading, metabolic syndromes, and systematic chronic inflammation, may account for this link [8, 9].
Body mass index (BMI) is widely used to measure body composition and classify patients as overweight or obese [3, 6, 10]. Another measurement, waist circumference (WC), is usually used to specifically evaluate abdominal obesity. However, both methods have obvious limitations; for example, BMI does not account for the distribution of body fat and muscle mass or their relative proportions [11], and is therefore skewed in individuals who are highly muscular or who have muscle wasting. However, magnetic resonance imaging (MRI) has proven useful for measuring adipose tissue in the body [12] and abdominal obesity [13]; the use of MRI rather than BMI would also improve investigations of the relationship between obesity and lumbar disk degeneration. MRI is also superior to WC or waist-to-hip ratio in assessing visceral abdominal fat and subcutaneous adipose tissue [14, 15].
Due to the limitations of BMI and WC, a better method of assessing the association between abdominal obesity and lumbar disc degeneration is needed. However, few studies have explored the relationship between abdominal adiposity measured by MRI and disc degeneration. In this study, we explored the association between abdominal adipose tissue thickness determined using MRI and lumbar disc degeneration in a Chinese patient population.
Results
Disc degeneration grade distributions by gender
As shown in Table 1, grade 1 and 2 lumbar disc degeneration were more common in men than in women (both P < 0.001), while grade 3 and 5 degeneration were more common in women than in men (both P < 0.01). Women had higher mean L1/L2, L2/L3, L3/L4, and L4/L5 disc degeneration grades than men (all P < 0.01). Furthermore, women had higher disc degeneration sum grades than men (P < 0.001).
Table 1: Distribution of lumbar disc degeneration according to gender
Total |
Male |
Female |
|
|
N = 2415 |
N= 1098 |
N= 1317 |
P |
|
Grade 1, n (%) |
15 (0.12%) |
15 (0.27%) |
0 (0%) |
<0.001 |
Grade 2, n (%) |
4668 (38.66%) |
2305 (41.99%) |
2346 (35.63%) |
<0.001 |
Grade 3, n (%) |
2922 (24.2%) |
1247 (22.71%) |
1675 (25.44%) |
0.001 |
Grade 4, n (%) |
1772 (14.67%) |
803 (14.63%) |
969 (14.72%) |
0.89 |
Grade 5, n (%) |
2024 (16.76%) |
771 (14.04%) |
1253 (19.03%) |
<0.001 |
Grade 6, n (%) |
518 (4.29%) |
252 (4.59%) |
266 (4.04%) |
0.14 |
Grade 7, n (%) |
147 (1.22%) |
74 (1.35%) |
73 (1.11%) |
0.23 |
Grade 8, n (%) |
9 (0.07%) |
6 (0.11%) |
3 (0.05%) |
0.20 |
Mean grade of disc degeneration |
||||
L1/2 |
2.46±0.82 |
2.41±0.83 |
2.51±0.82 |
0.006 |
L2/3 |
2.66±0.98 |
2.56±0.93 |
2.73±1.01 |
<0.001 |
L3/4 |
3.07±1.12 |
2.95±1.10 |
3.17±1.13 |
<0.001 |
L4/5 |
3.98±1.19 |
3.87±1.22 |
4.07±1.15 |
<0.001 |
L5/S1 |
4.21±1.45 |
4.19±1.43 |
4.23±1.47 |
0.53 |
Sum grades of disc degeneration |
16.38±3.63 |
15.98±3.52 |
16.71±3.69 |
<0.001 |
Data are shown as mean ± SD or number (percentage).
Adiposity diameters differed between men and women
As shown in Table 2, AD and SAD were higher in men than in women (both P < 0.001), while VST and DST were lower in men than in women (both P < 0.001).
Table 2: Characteristics of adiposity parameters
Variables |
Total |
Male |
Female |
|
|
N= 2415 |
N= 1098 |
N= 1317 |
P |
Age, year |
45.0 (38.0-55.0) |
44.0 (36.0-53.0) |
47.0 (39.0-56.0) |
<0.001 |
AD, cm |
92.4 (77.8-108.4) |
97.5 (83.3-114.7) |
88.0 (74.4-103.8) |
<0.001 |
SAD, cm |
185.6 (168.4-204.5) |
193.4 (177.0-212.1) |
179.0 (163.4-197.5) |
<0.001 |
VST, cm |
18.9 (14.1-25.4) |
15.2 (11.5-19.1) |
23.5 (18.1-29.1) |
<0.001 |
DST, cm |
15.1 (10.7-20.5) |
12.3 (8.8-17.0) |
17.5 (13.1-22.8) |
<0.001 |
Data are shown as median (interquartile ranges).
Abbreviations: AD indicates abdominal diameter; SAD, sagittal diameter; VST, ventral subcutaneous thickness;
DST, dorsal subcutaneous thickness.
Associations between adiposity diameters and lumbar disc degeneration sum grades
As shown in Table 3, Spearman correlation analysis revealed that AD and SAD were positively correlated with lumbar disc degeneration sum grades in men (r = 0.120 and r = 0.131, respectively, both P < 0.001). Conversely, DST was negatively associated with lumbar disc degeneration sum grades in men (r = -0.079, P = 0.009). VST was not associated with lumbar disc degeneration sum grades in men. In women, AD, SAD and VST were positively correlated with lumbar disc degeneration sum grades (r = 0.294, r = 0.295 and r = 0.187, respectively, all P < 0.001). DST was not associated with lumbar disc degeneration sum grades in women.
Table 3: The associations between adiposity diameters and sum grades of lumbar disc degeneration
Sum grades of lumbar disc degeneration |
||||
Male |
Female |
|||
|
r |
P |
r |
P |
AD, cm |
0.120 |
<0.001 |
0.294 |
<0.001 |
SAD, cm |
0.131 |
<0.001 |
0.295 |
<0.001 |
VST, cm |
−0.025 |
0.41 |
0.187 |
<0.001 |
DST, cm |
−0.079 |
0.009 |
−0.005 |
0.86 |
Abbreviations: r indicates spearman correlation coefficient; AD, abdominal
diameter; SAD, sagittal diameter; VST, ventral subcutaneous thickness; DST,
dorsal subcutaneous thickness.
Associations between adiposity diameters and severe lumbar disc degeneration
As shown in Table 4, the crude model indicated that AD, SAD, and VST were positively associated with severe lumbar disc degeneration in men (all P < 0.05); men in the highest quartiles for AD, SAD, and VST were at higher odds ratio of severe lumbar disc degeneration than those in the lowest quartiles (odds ratio (OR) = 1.82, 95%CI = 1.29-2.57; OR = 2.04, 95%CI = 1.45-2.87; OR = 1.49, 95%CI = 1.06-2.09; respectively). After adjusting for age, men in the highest quartiles for AD, SAD, and VST were still at higher odds ratio of severe lumbar disc degeneration (OR = 1.55, 95%CI = 1.09-2.21; OR = 1.79, 95%CI = 1.26-2.55; OR = 1.77, 95%CI = 1.24-2.52; respectively). DST was not associated with severe lumbar disc degeneration in men in either model. In women, the crude model indicated that AD, SAD, and VST were positively associated with severe lumbar disc degeneration (all P < 0.01), and women in the highest quartile for AD, SAD, and VST were at higher odd ratio of severe lumbar disc degeneration than those in the lowest quartiles (OR = 2.49, 95%CI = 1.78-3.48; OR = 2.57, 95%CI = 1.83-3.61; OR = 1.60, 95%CI = 1.15-2.21; respectively). After adjusting for age, women in the highest quartiles for AD and SAD were still at higher odds ratio of severe lumbar disc degeneration (OR = 1.80, 95%CI = 1.26-2.56; OR = 1.94, 95%CI = 1.37-2.77; respectively). However, VST was not associated with severe lumbar disc degeneration in women in the adjusted model, and DST was not associated with severe lumbar disc degeneration in women in either model.
Table 4: Association analysis of adiposity diameters with severe lumbar disc degeneration
Severe lumbar disc degeneration |
||||
Males |
Females |
|||
|
Crude OR (95% CI) |
Adjusted* (95% CI) |
Crude OR (95% CI) |
Adjusted* (95% CI) |
AD quartiles |
||||
Quartile 1 |
1.00 |
1.00 |
1.00 |
1.00 |
Quartile 2 |
1.42 (1.01-1.99) |
1.25 (0.88-1.77) |
1.17 (0.86-1.59) |
1.08 (0.79-1.48) |
Quartile 3 |
1.36 (0.97-2.25) |
1.18 (0.83-1.67) |
1.99 (1.43-2.75) |
1.67 (1.19-2.33) |
Quartile 4 |
1.82 (1.29-2.57) |
1.55 (1.09-2.21) |
2.49 (1.78-3.48) |
1.80 (1.26-2.56) |
P for trend |
0.002 |
0.03 |
<0.001 |
<0.001 |
SAD quartiles |
||||
Quartile 1 |
1.00 |
1.00 |
1.00 |
1.00 |
Quartile 2 |
1.89 (1.34-2.65) |
1.70 (1.20-2.41) |
1.20 (0.88-1.63) |
1.05 (0.76-1.45) |
Quartile 3 |
1.75 (1.25-2.46) |
1.51 (1.06-2.14) |
1.60 (1.16-2.20) |
1.29 (0.93-1.80) |
Quartile 4 |
2.04 (1.45-2.87) |
1.79 (1.26-2.55) |
2.57 (1.83-3.61) |
1.94 (1.37-2.77) |
P for trend |
<0.001 |
0.004 |
<0.001 |
<0.001 |
VST quartiles |
||||
Quartile 1 |
1.00 |
1.00 |
1.00 |
1.00 |
Quartile 2 |
1.40 (1.00-1.97) |
1.39 (0.98-1.97) |
1.12 (0.81-1.54) |
1.02 (0.73-1.41) |
Quartile 3 |
1.60 (1.14-2.25) |
1.72 (1.21-2.44) |
1.32 (0.96-1.82) |
1.13 (0.81-1.57) |
Quartile 4 |
1.49 (1.06-2.09) |
1.77 (1.24-2.52) |
1.60 (1.15-2.21) |
1.29 (0.92-1.81) |
P for trend |
0.01 |
<0.001 |
0.003 |
0.11 |
DST quartiles |
||||
Quartile 1 |
1.00 |
1.00 |
1.00 |
1.00 |
Quartile 2 |
1.01 (0.72-1.42) |
1.05 (0.74-1.50) |
0.79 (0.57-1.09) |
0.80 (0.58-1.11) |
Quartile 3 |
1.02 (0.72-1.43) |
1.10 (0.77-1.56) |
1.00 (0.72-1.39) |
1.07 (0.76-1.49) |
Quartile 4 |
0.98 (0.70-1.38) |
1.13 (0.79-1.61) |
0.94 (0.68-1.31) |
1.03 (0.74-1.44) |
P for trend |
0.92 |
0.48 |
0.90 |
0.48 |
* Adjusted for age
Abbreviations: OR indicates odds ratio; CI, confidence interval; AD, abdominal diameter; SAD, sagittal diameter;
VST, ventral subcutaneous thickness; DST, dorsal subcutaneous thickness.
Discussion
In this study, we found that increased AD and SAD were associated with a higher odds ratio of severe lumbar disc degeneration in both men and women, while high VST was associated with an increased odds ratio of severe lumbar disc degeneration only in men.
Disc degeneration is characterized by a reduction in signals of the nucleus pulposus and the inner fibers of the anulus [16]. Lumbar disc degeneration plays a key role in lower back pain [17]. Many factors, including genetic inheritance, early environment, age, loading history, and inadequate metabolite transport, can weaken discs and result in structural failure during routine daily activities [18-20]. In addition to the above factors, our findings suggest that increased abdominal adipose tissue thickness is associated with lumbar disc degeneration.
Previous research has revealed that high BMI is closely associated with an increased risk of lumbar disc degeneration. Like et al. gathered 4 years of follow-up data in a population-based MRI study and found that a BMI ≥ 25kg/m2 increases the risk of lumbar disc degeneration; patients who were overweight at young age were at particularly high risk [10]. Another population-based study performed by Samartzis et al. indicated that overweight or obese adults had higher rates of, more extensive, and more severe lumbar disc degeneration [3]. They also found that high BMI was strongly associated with the presence and severity of juvenile disc degeneration [6].
The above-mentioned studies all used BMI to measure body composition, despite its limitations. Adiposity parameters measured using MRI are strongly correlated with BMI and waist circumference (WC), and are superior to WC for assessing amounts of abdominal fat [14]. Recently, Jani et al. demonstrated that increased measures of abdominal obesity obtained using MRI are associated with increased lumbar disc degeneration in young men. However, they only measured AD and SAD, and did not identify a similar correlation in females. Our results are consistent with their findings in men. Furthermore, we identified the same correlation in women, and found that VST was also related to lumbar disc degeneration in men. Differences in patient age between the studies and in the ethnic groups examined, which are likely associated with differences in daily activities and fat distribution, might explain these discrepancies. Although the statistically significant regression coefficients in our study were relatively small, these associations might still have important implications for public policy and health care related to obesity.
Several possible mechanisms might contribute to the association between abdominal adipose tissue thickness and disc degeneration. Accumulation of abdominal fat might increase the mechanical load on the spine by increasing compressive forces and shear in lumbar structures during daily activity. People with high BMIs may also be more likely to experience accidental spinal injuries [8]. In addition, atherosclerosis is closely related to disc degeneration. Aortic atherosclerosis and stenosis of the feeding arteries in the lumbar spine reduce blood flow, resulting in disc degeneration and lower back pain [21]. Many well-known risk factors contribute to atherosclerosis, including hyperlipidemia, hyperglycemia, and hypertension [9]. Accumulation of abdominal fat is closely associated with these risk factors [22]. In addition, over-accumulation of abdominal fat causes chronic low-grade inflammation, which plays a crucial role in the pathogenesis of atherosclerosis [9, 23]. Adipose tissue is a dynamic endocrine organ that secretes several inflammatory mediators called adipocytokines, such as IL-6, IL-18, and TNF-a, which trigger production of C-reactive protein in the liver [9]. The accumulation of excess abdominal fat thus increases inflammation, which promotes endothelial dysfunction and atherosclerosis.
To the best of our knowledge, this is the first large-scale study to assess the relationship between abdominal adipose tissue thickness and lumbar disc degeneration in a Chinese patient population. The use of a 3T MRI system scanning with high resolution also helped to ensure accurate diagnoses. Finally, the modified Pfirrmann grading system used here allowed us to accurately determine the severity of disc degeneration in elderly subjects. However, several limitations of this study should be considered. First, as retrospective studies are associated with an unavoidable bias, prospective studies and multicenter validations should be performed. Second, we did not account for confounding factors aside from age and gender, such as body size, family history and lifestyle factors including diet, smoking, and physical activity levels; these factors should be considered in future studies. Third, overall body composition, including fat and fat-free mass, was not examined. Additional studies should incorporate these measures to more accurately account for the involvement of inflammation and the metabolic syndromes in disc degeneration. In addition, lower back pain was not assessed in this study.
In conclusion, we found that AD and SAD were associated with lumbar disc degeneration in both men and women, and VST was also related to lumbar disc degeneration in men, suggesting that abdominal obesity might be one of underlying mechanisms of lumbar disc degeneration. A longitudinal study would be particularly helpful for further investigating this relationship and its correlation with pain.
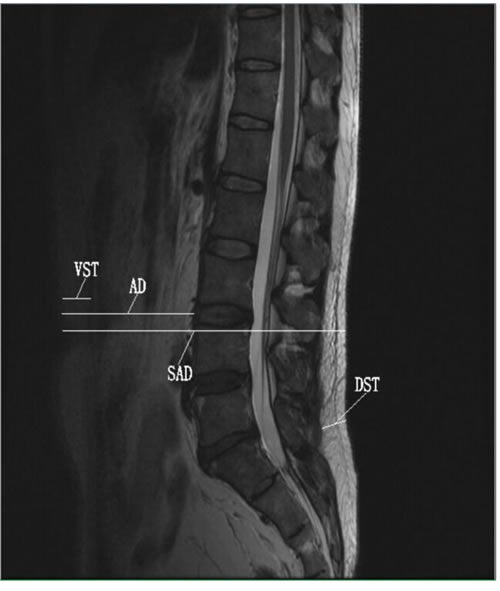
Figure 1: T2-weighted midsagittal plane images of the lumbar spine showing the adiposity diameters measured. Abbreviations: VST, ventral subcutaneous thickness; AD, abdominal diameter; SAD, sagittal diameter; DST, dorsal subcutaneous thickness.
Materials and Methods
Subjects
This retrospective study was conducted in participants selected from a total of 7541 patients who received lumbar spine MRI examinations for different reasons between November 2011 and November 2013 at The Second Affiliated Hospital of Wenzhou Medical University, China. Among these 7541 subjects, those who met the following criteria were excluded: 1) 4021 with unclear abdominal adipose tissue edges under the skin; 2) 628 with lumbar trauma history or spinal deformities; 3) 338 who previously underwent spinal surgery; and 4) 139 with benign or malignant spinal tumors. Ultimately, 2415 participants were included in this study. Demographic information, such as age and sex, were collected from the hospital database. The Institutional Review Board of The Second Affiliated Hospital of Wenzhou Medical University approved this study, and informed consent was obtained from all participants.
Lumbar magnetic resonance imaging
All participants underwent a lumbar spine MRI scan on a single high field strength system (3.0 Tesla Signa HDxt EXCITE, General Electric, Milwaukee, USA) with a multichannel phased array spine surface coil, using a standardized Sagittal spin-echo T2 (TR 2500 ms, TE 107 ms), in a supine position. The field of view was 320×320 mm2, with an acquisition matrix of 256×256. The slice thickness was 4 mm, with a 1 mm inter-slice space, and signals were acquired twice.
Disc degeneration assessment
We evaluated the degree of L1/2 to L5/S1 (L = lumbar, S = sacral) disc degeneration in T2-weighted lumbar spine MRI images using the modified Pfirrmann grading system, an 8-level system in which each grade represents a stepwise progression from normal disc (grade 1) to severe disc degeneration (grade 8) [16]. Degeneration was classified mainly based on the signal intensity of the nucleus pulposus and the inner fibers of anulus, changes in signal intensity between the inner and other posterior anulus fibers, and disc space height. Sum grades (theoretically ranging from 0 to 40, but from 0 to 30 in study subjects) of all five lumbar discs were calculated for each subject according to the individual disc grades. Two examiners were trained by the same experienced radiologist to perform disc degeneration assessments. Each examiner performed all anthropometric measurements independently with the aid of an illustrated anthropometry manual. Discrepancies were identified and reconciled by the radiologist.
Anthropometric and adiposity measures
We measured adipose tissue diameters in four locations in the midsagittal plane from T2-weighted images. Sagittal diameter (SAD, cm) was defined as the horizontal distance between anterior skin and posterior skin at the umbilicus level [24]. Abdominal diameter (AD, cm) was defined as the distance from the abdominal subcutaneous fascia to the anterior border of the vertebral body at the same SAD level [25]. Ventral subcutaneous thickness (VST, cm) was the thickness of the subcutaneous adipose tissue at the same SAD and AD level [26]. Dorsal subcutaneous thickness (DST, cm) was defined as the distance between the anterior edge of the subcutaneous fat and the subcutaneous fascia in the L5 or S1 vertebral body perpendicular to the skin at the presacral level [15] (Figure 1).
Statistical analysis
Statistical analysis was performed using SAS version 8.1 (SAS Institute, Cary, NC); a two-sided P value < 0.05 indicated a significantly significant difference. Data are presented as means ± SD, medians with interquartile ranges, or numbers with proportions for categorical variables. Study subjects were divided in two groups according to gender. Continuous variables and categorical variables were compared between groups using t-tests and χ2 tests, respectively. Spearman correlations were used to explore correlations between adiposity diameters and lumbar disc degeneration sum grades. Severe lumbar disc degeneration was defined by at least one grade ≥ 5 in the same subject. Adiposity parameters were divided into quartiles, with the first quartile representing the lowest 25% of patients and the fourth quartile representing the highest 25% of patients. Crude associations between adiposity parameters and severe lumbar disc degeneration were first assessed using univariate logistic regression, and multivariable logistic regressions were then performed to adjust for age effects in the model.
Acknowledgments
The authors thank Dr. Chunlei Liu, Department of Electrical Engineering and Computer Sciences, and Helen Wills Neuroscience Institute University of California, Berkeley, CA 94720, and Dr Su Lui, Huaxi MR Research Center, Department of Radiology, West China Hospital, SiChuan University, Chengdu Sichuan, China, for their helpful comments.
Conflicts of interest
The authors report no conflicts of interest.
funding
This study was funded by grants from the Wenzhou Science and Technology Planning Projects (2014S0117), and was funded by the Wenzhou Science and Technology Bureau in China (Y20070019), and the Undergraduate Research Program of Wenzhou Medical College (wyx201401018).
References
1. Bastien M, Poirier P, Lemieux I and Despres JP. Overview of epidemiology and contribution of obesity to cardiovascular disease. Progress in cardiovascular diseases. 2014; 56:369-381.
2. Must A and McKeown NM. (2000). The Disease Burden Associated with Overweight and Obesity. In: De Groot LJ, Beck-Peccoz P, Chrousos G, Dungan K, Grossman A, Hershman JM, Koch C, McLachlan R, New M, Rebar R, Singer F, Vinik A and Weickert MO, eds. Endotext. South Dartmouth (MA): MDText.com, Inc.).
3. Samartzis D, Karppinen J, Chan D, Luk KD and Cheung KM. The association of lumbar intervertebral disc degeneration on magnetic resonance imaging with body mass index in overweight and obese adults: a population-based study. Arthritis and rheumatism. 2012; 64:1488-1496.
4. Xu X, Li X and Wu W. Association Between Overweight or Obesity and Lumbar Disk Diseases: A Meta-Analysis. Journal of spinal disorders & techniques. 2015; 28:370-376.
5. Takatalo J, Karppinen J, Taimela S, Niinimaki J, Laitinen J, Sequeiros RB, Samartzis D, Korpelainen R, Nayha S, Remes J and Tervonen O. Association of abdominal obesity with lumbar disc degeneration--a magnetic resonance imaging study. PloS one. 2013; 8:e56244.
6. Samartzis D, Karppinen J, Mok F, Fong DY, Luk KD and Cheung KM. A population-based study of juvenile disc degeneration and its association with overweight and obesity, low back pain, and diminished functional status. The Journal of bone and joint surgery American volume. 2011; 93:662-670.
7. Deyo RA, Mirza SK and Martin BI. Back pain prevalence and visit rates: estimates from U.S. national surveys, 2002. Spine. 2006; 31:2724-2727.
8. Hu HY, Chou YJ, Chou P, Chen LK and Huang N. Association between obesity and injury among Taiwanese adults. International journal of obesity. 2009; 33:878-884.
9. Rafieian-Kopaei M, Setorki M, Doudi M, Baradaran A and Nasri H. Atherosclerosis: process, indicators, risk factors and new hopes. International journal of preventive medicine. 2014; 5:927-946.
10. Liuke M, Solovieva S, Lamminen A, Luoma K, Leino-Arjas P, Luukkonen R and Riihimaki H. Disc degeneration of the lumbar spine in relation to overweight. International journal of obesity. 2005; 29:903-908.
11. Roubenoff R. Applications of bioelectrical impedance analysis for body composition to epidemiologic studies. The American journal of clinical nutrition. 1996; 64:459s-462s.
12. Seidell JC, Bakker CJ and van der Kooy K. Imaging techniques for measuring adipose-tissue distribution--a comparison between computed tomography and 1.5-T magnetic resonance. The American journal of clinical nutrition. 1990; 51:953-957.
13. Hu HH, Nayak KS and Goran MI. Assessment of abdominal adipose tissue and organ fat content by magnetic resonance imaging. Obesity reviews. 2011; 12:e504-515.
14. Yim JY, Kim D, Lim SH, Park MJ, Choi SH, Lee CH, Kim SS and Cho SH. Sagittal abdominal diameter is a strong anthropometric measure of visceral adipose tissue in the Asian general population. Diabetes care. 2010; 33:2665-2670.
15. Kvist H, Chowdhury B, Grangard U, Tylen U and Sjostrom L. Total and visceral adipose-tissue volumes derived from measurements with computed tomography in adult men and women: predictive equations. The American journal of clinical nutrition. 1988; 48:1351-1361.
16. Griffith JF, Wang YX, Antonio GE, Choi KC, Yu A, Ahuja AT and Leung PC. Modified Pfirrmann grading system for lumbar intervertebral disc degeneration. Spine. 2007; 32:E708-712.
17. Peterson CK, Bolton JE and Wood AR. A cross-sectional study correlating lumbar spine degeneration with disability and pain. Spine. 2000; 25:218-223.
18. Dario AB, Ferreira ML, Refshauge KM, Lima TS, Ordonana JR and Ferreira PH. The relationship between obesity, low back pain, and lumbar disc degeneration when genetics and the environment are considered: a systematic review of twin studies. The spine journal. 2015; 15:1106-1117.
19. Hassett G, Hart DJ, Manek NJ, Doyle DV and Spector TD. Risk factors for progression of lumbar spine disc degeneration: the Chingford Study. Arthritis and rheumatism. 2003; 48:3112-3117.
20. Adams MA and Roughley PJ. What is intervertebral disc degeneration, and what causes it? Spine. 2006; 31:2151-2161.
21. Kauppila LI. Atherosclerosis and disc degeneration/low-back pain--a systematic review. European journal of vascular and endovascular surgery. 2009; 37:661-670.
22. Despres JP and Lemieux I. Abdominal obesity and metabolic syndrome. Nature. 2006; 444:881-887.
23. Esser N, Legrand-Poels S, Piette J, Scheen AJ and Paquot N. Inflammation as a link between obesity, metabolic syndrome and type 2 diabetes. Diabetes research and clinical practice. 2014; 105:141-150.
24. Riserus U, Arnlov J, Brismar K, Zethelius B, Berglund L and Vessby B. Sagittal abdominal diameter is a strong anthropometric marker of insulin resistance and hyperproinsulinemia in obese men. Diabetes care. 2004; 27:2041-2046.
25. De Lucia Rolfe E, Sleigh A, Finucane FM, Brage S, Stolk RP, Cooper C, Sharp SJ, Wareham NJ and Ong KK. Ultrasound measurements of visceral and subcutaneous abdominal thickness to predict abdominal adiposity among older men and women. Obesity (Silver Spring, Md). 2010; 18:625-631.
26. Guzzaloni G, Minocci A, Marzullo P and Liuzzi A. Sagittal abdominal diameter is more predictive of cardiovascular risk than abdominal fat compartments in severe obesity. International journal of obesity. 2009; 33:233-238.