
INTRODUCTION
Human G-protein activated inward rectifier potassium channel subunits (GIRKs) are encoded by four genes (KCNJ3; KCNJ5; KCNJ6; KCNJ9). GIRK1-4 proteins form homo- or hetero-tetrameric ion channels, function as G-protein effectors in the plasma membrane and thereby regulate cellular excitability and activity via neurotransmitters and hormones [1]. GIRKs are involved in the regulation of functions as diverse as heartbeat, reward mechanisms, learning and memory functions, insulin secretion, blood platelet aggregation and lipid metabolism [1–6]. Increasing evidence suggests an involvement of genes encoding for GIRKs in tumorigenesis and tumor growth. Benign adenomas of adrenal cortex cells, which lead to aldosteronism and severe hypertension, have been linked to somatic mutations in the KCNJ9 gene encoding GIRK4 [7, 8]. Upregulation of KCNJ3 gene products (i.e. GIRK1 mRNA and protein; synonyms: KGA, Kir3.1) was reported for non-small cell lung cancer [9] and pancreatic adenocarcinomas [10]. Correlation of increased KCNJ3 expression levels and breast cancer progression has been shown by several studies: Stringer et al. [11] reported increased levels of KCNJ3 mRNA in primary invasive breast carcinomas when compared to corresponding normal breast tissue and found a positive correlation between KCNJ3 mRNA expression levels in the tumor and the number of metastatic lymph nodes. Brevet et al. [12] confirmed on protein level that GIRK1 expression is higher in breast tumors than in normal breast tissue. Functional roles of KCNJ3 expression in breast cancer were investigated by Rezania et al. [13], who demonstrated that stable overexpression of KCNJ3 in MCF-7 breast cancer cells results in increased motility, invasiveness and angiogenesis compared to controls. Based on these results, we intended to study and validate KCNJ3 expression in invasive breast carcinoma samples as potential new prognostic biomarker. Consequently, the aim of the current study was a) to compare KCNJ3 expression levels between breast tumors and surrounding normal breast tissue, b) to screen the large patient cohort of The Cancer Genome Atlas (TCGA) for differential expression of KCNJ3 in clinically relevant subsets of breast cancer patients, c) to perform overall and disease free survival analysis to retrieve any possible prognostic value of KCNJ3 for breast cancer patients, d) to validate TCGA data by RNA in situ hybridization on formalin-fixed, paraffin-embedded (FFPE) breast cancer tissue samples of a previously characterized cohort (GEO ID GSE17705, [14]), and e) to get insight into the effects of KCNJ3 upregulation by performing mammosphere formation assays with MCF-7 breast cancer cell lines overexpressing KCNJ3. Our results suggest that KCNJ3 upregulation is an independent prognostic factor for estrogen receptor positive breast cancer.
RESULTS
KCNJ3 expression is upregulated in breast tumors compared to normal breast tissue
First, we investigated whether KCNJ3 mRNA expression is higher in breast tumors when compared to corresponding normal tissue. Analysis of TCGA gene expression data of 105 tumor samples with corresponding normal breast samples showed significantly higher KCNJ3 mRNA levels in the tumors when compared to normal breast tissue (median 14.6 vs. 6.6 normalized counts; p < 0.001; Figure 1A).
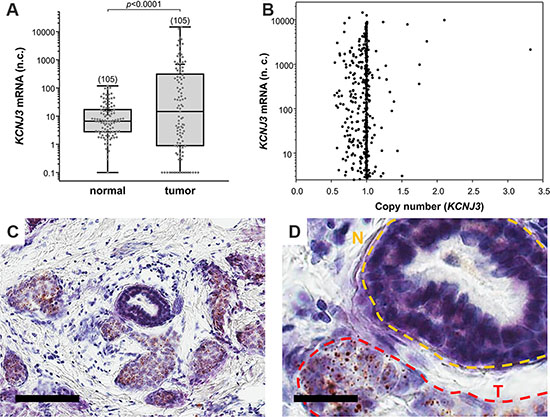
Figure 1: KCNJ3 mRNA levels are higher in tumor than in surrounding normal tissue. (A) KCNJ3 mRNA expression in normal and corresponding tumor tissue of breast cancer patients of the TCGA. Whiskers represent the lowest and the highest value, single data points are shown by grey circles, the black + marks the mean value. Number of samples analysed is given in brackets above each box. A Wilcoxon signed rank test was used for analysis (p < 0.001); n.c.: normalized counts. (B) KCNJ3 gene copy numbers versus KCNJ3 mRNA expression of breast cancer patients of the TCGA (n = 890). A copy number of 1.0 indicates that no gene amplification or deletion on DNA level has happened. Spearman rank correlation analysis revealed no statistical significant increase or decrease in KCNJ3 gene copy number (rS= -0.0207; not significant); n.c.: normalized counts. (C) KCNJ3 RNA in situ hybridization of a patient sample with high KCNJ3 expression. Positive signals (brown spots) are present in tumor cells only. Scale bar: 100 μm. (D) Detail of (C). N (yellow): normal duct; T (red): tumor area. Scale bar: 25 μm.
Upregulation of mRNAs in tumor cells might be caused by different mechanisms, including gene locus amplification on DNA level [15–17]. To explore gene amplification as a possible cause for the observed increase in KCNJ3 mRNA expression levels in breast tumors, we studied the gene copy numbers of 890 TCGA patient samples. Figure 1B shows that only two patients had a gene locus amplification (KCNJ3 copy number > 2) that resulted in increased mRNA expression. Overall, and despite a broad range of KCNJ3 mRNA expression levels, there was no significant increase or decrease in gene copy number (Spearman rank correlation coefficient rS: −0.02; p = 0.536), suggesting that high mRNA levels are generated by other mechanisms than copy number variations.
In order to validate KCNJ3 expression levels in tumor and normal cells, RNA in situ hybridization (ISH) was performed on breast cancer tissue samples to locate KCNJ3 expression in cancerous as well as in surrounding tumor stroma and normal breast epithelial cells. The results proved that KCNJ3 expression is present in tumor cells, but not in non-neoplastic cells including normal mammary ducts (Figure 1C and 1D).
KCNJ3 expression is associated with estrogen receptor positive tumors
Next, we studied KCNJ3 mRNA expression levels of the TCGA data set to detect possible associations with clinically relevant breast cancer subsets. We observed increased KCNJ3 expression in tumors of patients who presented with positive lymph nodes when compared to those without lymph node metastasis at diagnosis (median 6.9 vs. 25.3 normalized counts; p < 0.001; Figure 2A). KCNJ3 mRNA levels did not differ significantly when patients were grouped based on their tumor size, tumor grade, age, menopausal status, histological subtype or Her2 expression status (Figure 2B–2F). Then, patients were categorized according to their PAM50 classification (luminal A, luminal B, Her2-enriched, basal-like, normal-like): patients of both the luminal A and B subtype had significantly higher KCNJ3 expression levels than patients of the basal or Her2-enriched type (p < 0.001; Figure 3A). No relevant information could be retrieved from the normal-like subtype due to the low patient number (n = 7). Since the luminal A and B subtypes include the hormone receptor positive tumors, we analyzed the patients regarding their estrogen and progesterone receptor (ER and PR) status. The two ER positive groups (ER+/PR+ and ER+/PR−) had significantly higher KCNJ3 levels than those that were negative for ER and PR (p < 0.001; Figure 3B). Hence we conclude that high KCNJ3 expression levels are associated with positive ER, but not PR status. Finally, comparison of patients grouped solely based on ER status revealed substantially higher KCNJ3 levels in ER positive patients (median 0.4 vs. 48.9 normalized counts; p < 0.001; Figure 3C).
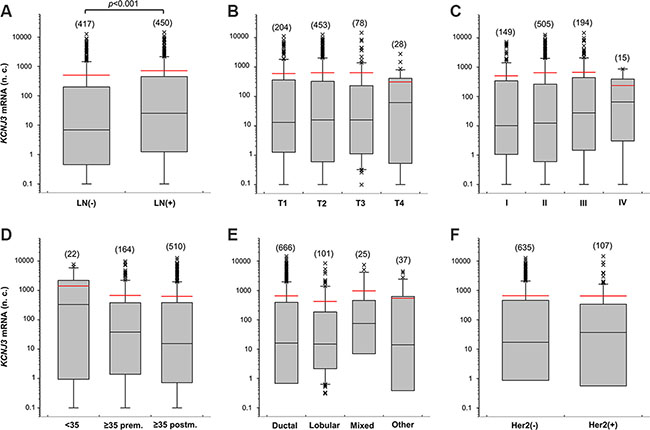
Figure 2: KCNJ3 mRNA levels in different subsets of breast cancer patients of the TCGA. KCNJ3 mRNA expression levels in breast cancer patient samples of the TCGA according (A) to their pN (LN: lymph node) status (n = 867; p < 0.001), (B) to their pT (tumor size) status (n = 763; n.s.), (C) to their tumor grading (n = 863; n.s.), (D) to their age and menopausal (prem: premenopausal; postm: postmenopausal) status (n = 696; n.s.), (E) to their histological subtype (n = 829; n.s.), and (F) to their Her2 expression status (n = 742; n.s.). Boxplots: Whiskers represent the 10th and the 90th percentile, crosses represent outliers, and the red line marks the mean value. Number of samples analysed is given in brackets above each box. Wilcoxon rank sum tests were used to compare two groups and Kruskal Wallis tests with Dunn’s post-hoc tests for pairwise comparison were used to compare more than two groups. n.c.: normalized counts; (−): negative; (+): positive; n.s.: not significant.
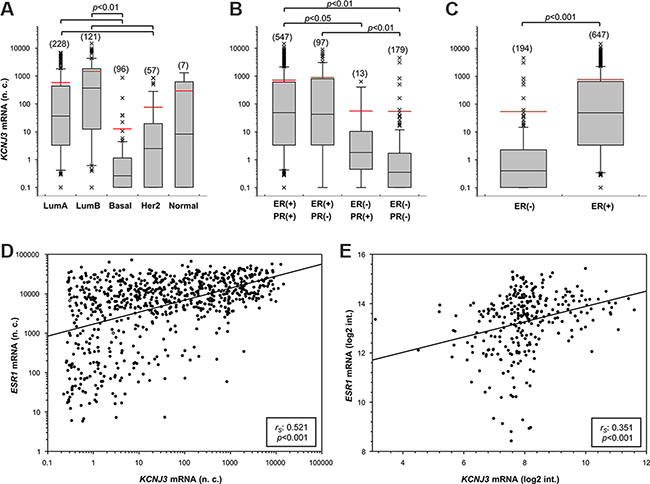
Figure 3: KCNJ3 mRNA levels are upregulated in estrogen receptor positive breast cancer samples. KCNJ3 mRNA expression levels in breast cancer patient samples of the TCGA according (A) to their PAM50 classification (n = 509), (B) to their estrogen and progesterone receptor status (n = 836), and (C) to their estrogen receptor status (n = 841; p < 0.001). Boxplots: Whiskers represent the 10th and the 90th percentile, crosses represent outliers, and the red line marks the mean value. Number of samples analysed is given in brackets above each box. A Kruskal Wallis test with Dunn’s post-hoc tests for pairwise comparison was used for analysis in (A) and (B), and a Wilcoxon rank sum test in (C); p-values are given on top of each plot. (D) Scatter plot of KCNJ3 and ESR1 mRNA expression levels in breast cancer patient samples of the TCGA (n = 905). (E) Scatter plot of KCNJ3 and ESR1 mRNA expression levels in patient samples of the GEO data set GSE17705 (n = 298). Spearman rank correlation coefficients (rS) and p-values are given in the boxes of each plot. n.c.: normalized counts; log2 int.: log2 intensity; LumA: luminal A type; LumB: luminal B type; basal: basal type; Her2: Her2-enriched type; Normal: normal-like type; ER: estrogen receptor; PR: progesterone receptor; (−): negative; (+): positive.
Based on these findings, we investigated whether KCNJ3 expression would correlate with the gene expression levels of the three known estrogen receptors ESR1 (ERα,), ESR2 (ERβ) and GPER (G-protein coupled ER 1; synonym: GPR30). Spearman rank correlation analysis showed that KCNJ3 expression correlates with ESR1 (rS: 0.521; p < 0.001; Figure 3D) but not with the other two estrogen receptors ESR2 (rS: −0.191) and GPER (rS: 0.253). In light of this finding, it was of interest to examine the correlation between KCNJ3 and ESR1 expression in our validation data set (GEO ID GSE17705). A positive correlation between KCNJ3 and ESR1 expression was observed (rS: 0.351; p < 0.001; Figure 3E), but not between KCNJ3 and ESR2 (rS: 0.165) or GPER (rS: 0.09).
Furthermore, we performed hierarchical cluster analysis with KCNJ3, ESR1, ESR2 and GPER (Figure 4). Based on the expression levels of those four genes, patient samples clustered in three major groups designated A, B and C in Figure 4. Group A, which showed low KCNJ3 expression levels, comprised patients of the basal and the Her2-enriched PAM50 type, being generally negative for pathological ER and PR status and displaying low ESR1 expression levels. Groups B and C were mainly composed of patients of the luminal A and B types, being positive for ER and PR status and displaying high ESR1 expression. The major difference between group B and C was the KCNJ3 expression (low in group B and high in group C; Figure 4). Further, it became evident that, again, KCNJ3 expression clustered with ESR1, but not with ESR2 and GPER.
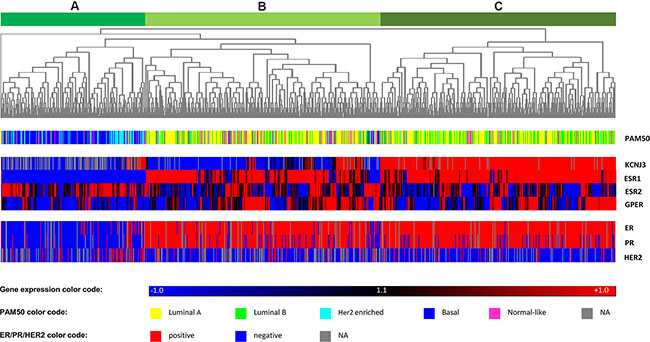
Figure 4: Heatmap of hierarchical cluster analysis. Hierarchical cluster analysis of mRNA levels of KCNJ3 and the estrogen receptors α (ESR1), β (ESR2), and GPR30 (GPER). The gene expression relative to the median expression value across all samples is shown (blue: values below median; red: values above median). PAM50 classification (multicolor panel) and pathological ER, PR and Her2 expression status (blue: negative; red: positive) are given for each patient sample. The dendrogram on top shows that patients were divided into three main branches (A, B and C) based on the expression levels of the four genes analyzed.
KCNJ3 is an independent prognostic factor in ER positive patients
Based on the results demonstrated above, we further focused on ER positive patients (groups B and C in Figure 4). Overall survival analysis of ER positive patients of the TCGA data set revealed that those with high KCNJ3 levels in the tumor (group C) had shorter overall survival times than patients of group B with low KCNJ3 levels (n = 647; p < 0.05; HR = 1.77 (1.04–3.02); Figure 5A). In addition, we used a Cox-proportional hazard approach for univariate and multivariate survival analysis of estrogen receptor positive patients (Table 1). The univariate Cox model showed that age at diagnosis as well as lymph node, metastasis, PAM50 and KCNJ3 status had a significant influence on survival times. Importantly, the multivariate Cox model − with tumor size, lymph node status, metastasis status, histology, Her2 status, menopause status, age at diagnosis, PAM50 classification and KCNJ3 status as co-variates − showed that only the KCNJ3 expression status had a significant impact on survival time (n = 228; p < 0.05; HR = 5.2 (1.3–21.8); Table 1).
Table 1: Cox-proportional hazard models for estrogen receptor positive breast cancer patients
univariate Cox modela |
multivariate Cox modelb |
multivariate Cox modelc |
|||||
|---|---|---|---|---|---|---|---|
HR (95%-CI) |
p-value |
HR(95%-CI) |
p-value |
HR(95%-CI) |
p-value |
||
Size (T) |
T1 vs. T2|T3|T4 |
1.0 (0.6–1.8) |
0.985 |
4.2 (0.5–36.2) |
0.184 |
5.9 (0.7–53.9) |
0.113 |
Lymph node status (N) |
neg. vs. pos. |
1.8 (1.0–3.2) |
0.042 |
0.7 (0.2–2.4) |
0.612 |
0.7 (0.2–2.2) |
0.513 |
Metastasis status (M) |
neg.vs.pos. |
3.5 (1.5–8.3) |
0.004 |
3.9 (0.7–21.4) |
0.112 |
4.3 (0.8–23.2) |
0.092 |
Histology |
ductal vs. lobular |
0.6 (0.1–2.4) |
0.454 |
0.6 (0.1–3.2) |
0.538 |
0.5(0.1–3.3) |
0.539 |
Her2 status |
neg. vs. pos. |
1.1 (0.4–2.8) |
0.845 |
1.2 (0.1–10.3) |
0.894 |
2.2 (0.2–22.5) |
0.517 |
Menopause status |
prem. vs. postm. |
2.5 (0.9–7.0) |
0.092 |
0.9(0.04–18.4) |
0.928 |
0.6(0.02–20.9) |
0.753 |
Age at diagnosis |
≤50 vs. > 50 years |
1.9 (1.0–3.4) |
0.038 |
3.2 (0.9–11.1) |
0.812 |
2.7(0.1–116.0) |
0.589 |
PAM50 status |
Luminal A vs. Luminal B |
2.6 (1.3–5.3) |
0.006 |
3.2 (0.1–32.5) |
0.071 |
1.5(0.4–5.9) |
0.589 |
KCNJ3 expression |
low(≤ 72th %ile) vs. high (> 72th %ile) |
1.8(1.0–3.0) |
0.036 |
5.2(1.3–21.8) |
0.021 |
||
an = 646
bwithout KCNJ3 mRNA expression, n = 228
cwith KCNJ3 mRNA expression, n = 228
Abbreviations: neg.: negative; pos.: positive; prem.: premenopausal; postm.: postmenopausal; HR: hazard ratio; CI: confidence interval
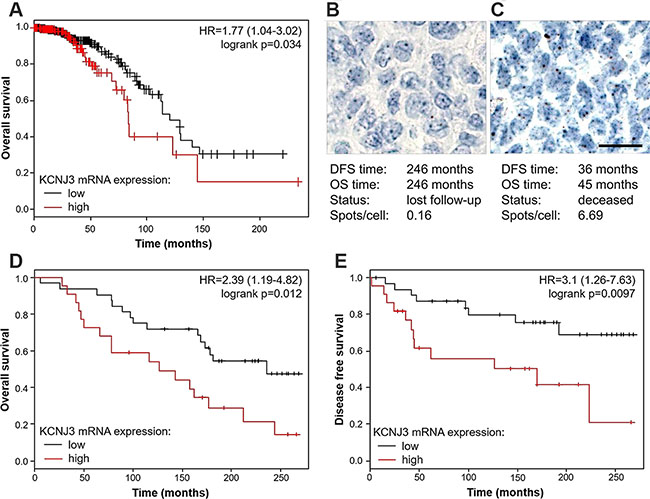
Figure 5: Estrogen receptor positive patients with high KCNJ3 mRNA levels in their tumor have a worse overall and disease free survival probability. (A) Kaplan-Meier plot showing overall survival of ER positive patients of the TCGA data set with low and high KCNJ3 mRNA expression levels as determined by RNAseq (n = 647). (B) Representative RNA in situ hybridization of a patient with low KCNJ3 levels in the tumor (0.16 spots/cell) and long survival times. (C) Representative RNA in situ hybridization of a patient with high KCNJ3 levels in the tumor (6.69 spots/cell) and short survival times. (D) Kaplan-Meier plot showing overall survival of a subset of patients of the GEO data set GSE17705 with low and high KCNJ3 mRNA expression levels as determined by RNA in situ hybridization (n = 54). (E) Same as (D), but showing disease free survival. Hazard ratios and logrank p-values are given in Kaplan-Meier plots. Scale bar in (B) and (C): 20μm. DFS: disease free survival; OS: overall survival.
To validate our findings and to extend our analysis beyond the TCGA data set, we performed KCNJ3 RNA in situ hybridization (ISH) on 66 breast cancer patient samples that were available with clinical data and follow-up times from the estrogen receptor positive cohort GSE17705. Patient characteristics of this cohort compared to the TCGA cohort are shown in Table 2. RNA ISH was the method of choice because we previously showed superiority of ISH over classical immunohistochemistry regarding sensitivity and specificity [18]. Twelve of the samples analyzed did not meet the quality control criteria for ISH (see methods section) and were therefore excluded from further analysis (remaining n = 54). Representative images of patient samples with either low KCNJ3 levels and long survival times or high KCNJ3 levels and short survival times are given in Figure 5B and 5C. Kaplan Meier analyses showed significantly shorter overall survival (p < 0.05; HR = 2.39 (1.19–4.82); Figure 5D) and disease free survival (p < 0.01; HR = 3.1 (1.26–7.63); Figure 5E) probabilities for patients with high KCNJ3 expression.
MCF-7 cells overexpressing KCNJ3 display higher self-renewal capacity
In order to gain additional insight into the cellular mechanisms that would lead to worse patient outcomes due to high levels of KCNJ3 in tumor cells, we performed a mammosphere formation assay with the ER positive breast cancer cell line MCF-7. This was of particular interest, as pathological upregulation of different potassium channels has been shown to affect cancer stem cell properties [19–21], and sphere formation is linked to self-renewal capacity and stemness of cancer cells. MCF-7 cells stably overexpressing KCNJ3 (MCF-7GIRK1a; [13]) formed significantly higher numbers of mammospheres compared to controls (p < 0.01; Figure 6), indicating that KCNJ3 upregulation might be involved in conferring self-renewal capacity to cancer cells and thus contributing to higher tumor aggressiveness.
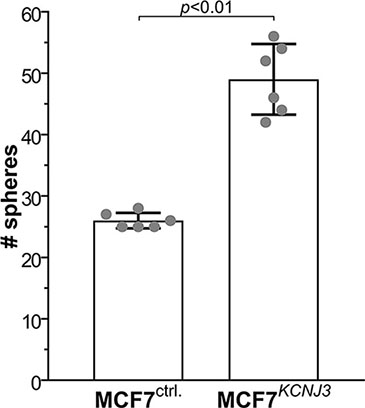
Figure 6: MCF-7 cells overexpressing KCNJ3 form more mammospheres than controls. Mammosphere formation of MCF-7 control cells (overexpressing empty vector; MCF-7ctrl.) and MCF-7 cells overexpressing KCNJ3 (MCF-7KCNJ3). Single data points are shown by grey circles. # spheres: number of mammospheres counted (mean ± standard deviation). A Wilcoxon rank sum test was used for analysis.
DISCUSSION
We have analyzed > 1000 breast cancer patient samples of two independent data sets (TCGA: n = 905, GSE17705: n = 298) regarding their KCNJ3 expression in order to evaluate a potential prognostic role of this ion channel gene for breast cancer.
Generally, ion channels have gained increased attention as players in cancer development and metastasis, since aberrant expression of as well as mutations in several genes encoding ion channels have been found to influence the hallmarks of cancer towards higher malignancy [22–26]. Potassium channels have been most comprehensively studied regarding their oncogenic potential by promoting proliferation and apoptosis [27–32]. Several studies suggested evidence for a role of GIRK1, the G-protein coupled inward rectifier K+ channel encoded by KCNJ3, in breast cancer [10–12]. Our results underscore these seminal findings using a substantially larger number of patient samples: we observed a significant increase of KCNJ3 mRNA expression levels in tumors of lymph node positive patients when compared to lymph node negative ones in our evaluation of 867 patients, and KCNJ3 mRNA levels were significantly higher in breast cancer samples than in corresponding normal breast tissue in a set of 105 patient samples.
The positive correlation between KCNJ3 levels and the ER status of breast cancer samples shown here had not been detected previously by the studies of Brevet et al. and Stringer et al. [11, 12], supposedly because of the sizes of their patient cohorts (n = 56 and n = 31, respectively). In contrast, Ko et al. [33] performed ion channel profiling in breast cancer and mentioned a decrease of KCNJ3 expression in p53 mutant breast tumors, which are more likely to be ER negative [34], and an increase in KCNJ3 mRNA expression in ER positive tumors when compared to ER negative samples. However, no further details or survival data regarding KCNJ3 expression were given or discussed, as this study aimed to develop an ion channel gene signature (termed IC30) as prognostic tool in breast cancer, and KCNJ3 is not comprised in this final gene panel [33]. In line with this, our data clearly demonstrate that KCNJ3 expression is associated with ER positive breast cancer and that KCNJ3 levels correlate with ESR1 mRNA expression levels but not with expression levels of other estrogen receptors. However, KCNJ3 levels were variable within the ER positive patient cohorts. Most importantly, we could show in two independent data sets and by two different methods (gene expression data and RNA in situ hybridization) that ER positive patients with high KCNJ3 expression levels had worse overall and disease free survival probabilities than ER positive patients with low KCNJ3 levels. This is further corroborated by multivariate Cox proportional hazard analysis, showing that KCNJ3 is an independent prognostic marker for ER positive breast cancer, being also independent from the PAM50 subtype of the patient. Therefore, ER positive patients might be stratified into high risk and low risk groups based on the KCNJ3 levels in the tumor.
Here, we used a highly sensitive and specific RNA in situ hybridization technique for the validation of our findings, that showed positive signals in tumor cells but not in peritumoral tissue, and that allowed to clearly discriminate between patients with low and high KCNJ3 expression. It might be argued that immunohistochemistry would be the method of choice when investigating novel tumor markers. However, and several tested anti-GIRK1 antibodies did not meet the high quality standards regarding sensitivity and specificity that are required for optimal results in immunohistochemistry. Based on a comparison of the two methods, we came to the conclusion that RNA ISH is the superior technique for studying KCNJ3 expression in tissue [18].
To date, the mechanisms leading to KCNJ3 upregulation in breast carcinomas are not understood. There is no evidence for estrogen response elements (ERE) in the promoter region of KCNJ3 [35, 36] making a direct activation of KCNJ3 gene transcription via ER unlikely to occur. Our results also argue against amplification of the KCNJ3 gene locus as the underlying mechanism for KCNJ3 upregulation. Further, it is unknown how the GIRK1 protein might interact with the estrogen receptor. GIRK1 is a non-functional channel when expressed as a homomer [37], located intracellularly as it accumulates in the endoplasmatic reticulum upon overexpression [38]. Thus, it remains to be determined whether and how GIRK1 and ER act together in same signaling pathways and further studies are needed to elucidate the mechanism of action of KCNJ3 upregulation in breast cancer.
On a more functional level, our research group provided evidence on downstream effects of KCNJ3 upregulation in breast cancer: Rezania et al. showed that MCF-7 cells display higher wound healing capacity, increased invasion towards chemoattractants and higher motility and velocity than controls upon stable overexpression of KCNJ3 [13]. We could further corroborate these findings by showing that MCF-7 cells stably overexpressing KCNJ3 display significantly higher self-renewal capacity. Taken together, we propose a role of KCNJ3 in conferring tumor aggressiveness via invasion, metastasis and increased self-renewal capacity.
In conclusion, the present study a) confirms in two independent data sets, that KCNJ3 is upregulated in breast carcinomas when compared to normal breast tissue, b) shows that increased KCNJ3 expression is significantly associated with estrogen receptor positive breast cancer subtypes, c) highlights that increased KCNJ3 is an independent prognostic marker conferring worse overall and disease free survival probabilities to estrogen receptor positive breast cancer patients, and d) demonstrates that KCNJ3 upregulation might be involved in conferring higher self-renewal capacity to cancer cells. Future studies are required to elucidate the mechanisms that lead to KCNJ3 upregulation in ER positive breast cancer, to unveil its involvement in invasion and metastasis and to evaluate its potential as drugable target.
MATERIALS AND METHODS
Gene expression data from the cancer genome atlas
The gene expression levels (RNAseq V2 level 3 data) of 950 invasive breast carcinoma samples and of 105 samples from corresponding healthy tissues were downloaded from the The Cancer Genome Atlas (TCGA) data portal (https://tcga-data.nci.nih.gov) and the upper quartile normalized counts from the RSEM pipeline were used. The corresponding clinical data of each patient were downloaded from the University of California Santa Cruz (UCSC) Cancer Genomics Browser (https://genome-cancer.ucsc.edu). Male patients (n = 9) and patients without gene expression data for KCNJ3 (n = 36) were excluded for further analysis (remaining n = 905). Patient characteristics are summarized in Table 2.
Table 2: Patient characteristics of the two data sets studied
TCGA data set (%)(n = 905) |
Validation set (%)(n = 66) |
p-valuea |
|
|---|---|---|---|
Age at diagnosis (years) |
<0.001 |
||
≤ 50 |
26.6 |
10.6 |
|
> 50 |
61.0 |
89.4 |
|
n.a. |
12.4 |
0 |
|
mean ± SD |
58 ± 13 |
63.7 ± 9.8 |
|
Status |
< 0.001 |
||
alive/lost for follow-up |
80.2 |
42.4 |
|
deceased |
10.8 |
57.6 |
|
n.a. |
9.0 |
0 |
|
Follow-up time (months) |
< 0.001 |
||
mean ± SD |
32 ± 35 |
157 ± 76 |
|
Lymph node status |
n.s. |
||
negative |
46.1 |
51.5 |
|
positive |
49.7 |
45.5 |
|
n.a. |
4.2 |
3.0 |
|
Metastasis status |
n.s. |
||
negative |
86.4 |
100 |
|
positive |
1.7 |
0 |
|
n.a. |
11.9 |
0 |
|
T stage |
n.s. |
||
pT1 |
26.0 |
40.9 |
|
pT2 |
56.2 |
48.5 |
|
pT3 |
11.3 |
6.1 |
|
pT4 |
3.6 |
4.5 |
|
n.a. |
2.9 |
0 |
|
Grade |
n.s. |
||
1 |
16.6 |
18.2 |
|
2 |
55.8 |
54.6 |
|
3 |
21.4 |
24.2 |
|
4 |
1.7 |
0 |
|
n.a. |
4.5 |
3.0 |
|
ER status |
< 0.001 |
||
negative |
21.4 |
0 |
|
positive |
71.5 |
100 |
|
n.a. |
7.1 |
0 |
|
PR status |
n.s. |
||
negative |
30.6 |
24.2 |
|
positive |
62.0 |
75.8 |
|
n.a. |
7.4 |
0 |
|
Her2 status |
n.a. |
||
negative |
70.2 |
||
positive |
11.8 |
||
n.a. |
18.0 |
100 |
|
PAM50 classification |
n.a. |
||
luminal A |
25.2 |
||
luminal B |
13.4 |
||
Her-2 enriched |
6.3 |
||
basal-like |
10.6 |
||
normal-like |
0.8 |
||
n.a. |
43.6 |
100 |
aA Mann-Whitney rank sum test was used to compare the groups regarding age at diagnosis and follow-up time; and a chi-square test was used to compare the groups regarding all other characteristics.
Abbreviations: SD: standard deviation; n.s.: not significant; not available/applicable; ER: estrogen receptor; PR: progesterone receptor.
Gene expression data from GEO ID GSE17705
The normalized gene expression levels of the estrogen receptor positive cohort GSE17705 (n = 298) were downloaded from the Gene Expression Omnibus (GEO). The data were generated and processed using the Affymetrix Human Genome U133A Array platform as described [14]. Briefly, tissue samples were processed by two different laboratories (MD Anderson Cancer Center, Texas, USA and Jules Bordet Institute, Brussels, Belgium; inter-laboratory reliability was assessed) and probe-level intensities were generated with Microarray Suite (MAS) version 5.0, normalized and log2 transformed.
FFPE patient samples
Detailed corresponding clinical and follow-up data as well as formalin-fixed, paraffin-embedded (FFPE) tissue samples were available for 66 patients of the ER positive cohort GSE17705. FFPE samples were collected from the Medical University of Graz, Austria and the Medical University of Innsbruck, Austria (see Table 2 for patient characteristics) [14]. Differences between the two data sets are given by a) the estrogen receptor status (all positive in the validation cohort, mixed in the TCGA) and b) the age, follow-up time and status which are more detailed and complete in the validation cohort than in the TCGA data set. The use of the patient samples including the clinical data was approved by the ethics committee of the Medical University of Graz (24-081 ex 11/12).
RNA in-situ hybridization
FFPE tissue sections (thickness 4 μm) were mounted on Superfrost Plus coated slides (Thermo Scientific, Waltham, MA, USA; #10135642) and peritumoral tissue devoid of cancer was trimmed. Slides were treated according to manufacturer’s instructions for the RNAscope® 2.0 High Definition - BROWN kit (ACD, Hayward, CA, USA; #310035). Briefly, the slides were incubated at 60 °C for 1 hour followed by pretreatment (pretreat 1: 10 min, pretreat 2: 15 min, pretreat 3: 30 min). Three sections of each sample were stained with different probes: the KCNJ3 probe (#Hs-KCNJ3-tv1tv2), the negative control probe bacterial dihydrodipicolinate reductase (DapB; #310043), and the positive control probe DNA-directed RNA polymerase II subunit RPB1 (POLR2A; #310451). Probes were incubated for 2 hours at 40°C using the HybEZ oven from ACD and six signal amplification steps, followed by signal detection with DAB were performed according to manufacturer’s protocol. Slides were counterstained with 50% hematoxylin, dehydrated, and cover slipped.
Image analysis
Slides were first assessed by microscopic inspection. Since the staining pattern of RNA in situ hybridization was homogenous across different regions of the same sample, a representative region was selected for each tumor, and z-stacks comprising 10 images were captured at 40× magnification using a Zeiss Observer.Z1 inverted microscope (Zeiss, Jena, Germany). Multiple adjacent single images (3x3 tiles) were acquired and aligned using the MosaiX module of the AxioVision software (Zeiss). Each assembled image covered an area of approx. 0.62 × 0.45 mm (3981x2980 pixels). Image sequences were stacked using the minimal intensity projection type setting of the ImageJ software (http://imagej.nih.gov/ij/). The SpotStudio software from ACD was used for detection of single cells, detection of spots and clusters and calculation of the estimated number of spots per cell. DapB and POLR2A probes served as technical quality controls that needed to fulfill the below given cut-off criteria in order to a) ensure technical specificity of the probes (negative control) and b) to detect samples with highly degraded RNA (positive control). The maximum threshold for negative controls was set at 0.5 spots/cell and the minimum threshold for positive controls at 2.5 spots/cell. Samples not fulfilling these cut-off requirements were excluded from further analysis.
Cell culture
The breast cancer cell line MCF-7 (ATCC; Manassas, VA, USA; #HTB-22™) was grown in minimal essential medium (Gibco, life technology, Grand Island, NY, USA; #31095_029) supplemented with 10% fetal bovine serum (Sigma Aldrich, St. Louis, USA; #P2442), penicillin/streptomycin (100 U/mL and 100 ng/mL; Sigma Aldrich; #P0781), and 1mmol/L sodium pyruvate (Sigma Aldrich; #S8636). MCF-7 cells stably overexpressing KCNJ3 were produced and cultured as described [13]. Cells were kept in a humidified atmosphere at 37°C and 5% CO2. Mycoplasma tests were negative, and short tandem repeat (STR) profiling proofed the cell line to be authentic.
Mammosphere formation assay
The mammosphere formation assay was performed as described previously [39] to test the self-renewal capacity of MCF-7 cells overexpressing KCNJ3. Briefly, MCF-7 cells were harvested and seeded in ultra-low attachment 6-well plates (2000 cells/well; Corning; NY, USA; #3471) with serum-free medium (MEBM; Lonza; Basel, Switzerland; #CC3151) supplemented with 1xB27 (Gibco; #17504044), 20 ng/ml human epidermal growth factor (Peprotech; Hamburg, Germany; #AF-100-15), 10 ng/ml human basic fibroblast growth factor (Peprotech; #AF-100-18C), 20 IU/ml Heparin (Baxter; Vienna, Austria) and 1% antibiotic/antimycotic solution (Sigma-Aldrich; #A5955). Mammospheres were observed and counted after 10 days.
Statistical analysis
Statistical analyses were performed using the SigmaPlot/SigmaStat v12.5 software (Systat Software Inc., San Jose, CA, USA) or GraphPad Prism 7.02 for Windows (GraphPad Software, La Jolla, CA, USA) for comparison of groups, Spearman rank correlation analysis, generation of boxplots, bargraphs and scatter plots. All performed tests were two-sided and rank based. For comparisons of paired data, a Wilcoxon signed rank test, for comparisons of two groups a Wilcoxon rank sum test (Mann-Whitney U test), and for comparison for more than two groups a Kruskal-Wallis test followed by Dunn’s posthoc tests for pairwise comparisons were used. Different patient characteristics between the TCGA cohort and the validation cohort (subset of GEO ID GSE17705) were compared using a chi-square test and a Wilcoxon rank sum test regarding age at diagnosis and follow-up times. Genesis 1.7.6 (Graz University of Technology, Graz, Austria) was used for log2-transformation and mean centering of gene expression values, calculation of Euclidean distance, hierarchical cluster analysis and heatmap visualization. For overall and disease free survival analysis, the statistical software environment R (www.r-project.org) including the package survival and an adopted code for the auto-cut-off option from Györffy et al. [40] was used. For the construction of survival curves, a Kaplan-Meier estimator was used and survival curves of patient groups with high expression versus low expression were compared by a logrank test. A time-independent Cox-proportional hazard approach was applied for univariate and multivariate survival analysis. Results were considered statistically significant when p < 0.05.
Abbreviations
In alphabethical order
DFS : disease free survival, ER : estrogen receptor, FFPE : formalin-fixed, paraffin-embedded, GEO : Gene Expression, Omnibus, GIRK : G-protein activated, inward rectifier potassium channel, HR : hazard ratio, ISH : in situ hybridization, LN : lymph node, log2 int. : log2 intensity, LumA : luminal A, LumB : luminal B, n.c. : normalized counts, OS : overall survival, PR : progesterone receptor, rS : Spearman rank, correlation coefficient, TCGA :The Cancer Genome Atlas.
ACKNOWLEDGMENTS
We thank Fraser Symmans (University of Texas MD Anderson Cancer Center, TX, USA) for help with obtaining follow-up data of patients, and Elke Winter (Institute of Pathology, Medical University of Graz, Austria) for assistance with RNA in situ hybridization.
CONFLICTS OF INTEREST
The authors do not declare a conflicts of interest.
FUNDING
This work was supported by the Austrian Science Fund (project numbers KLIF-182 (TB) and P22974-B19 (WS)) within the Doctoral School Translational Molecular and Cellular Biosciences at the Medical University of Graz, and in part by funds of the Oesterreichische Nationalbank (Anniversary Fund, project number 14869 (PM)) and by a Research Grant of the Austrian Society of Hematology and Medical Oncology (DS).
Authors’ contributions
SK, SWJ, PR, WS and TB conceived and designed the work; SK, HF, FP and TB collected data; SK, AEH, DS, VS and SR performed experiments; SK, AS, HH, DP and WS performed statistical analyses; SK, HH, SWJ, MP, GH, WS and TB analyzed and interpreted data; SK, SWJ, WS and TB drafted the article; all authors revised and approved the final article.
REFERENCES
1. Luscher C, Slesinger PA. Emerging roles for G protein-gated inwardly rectifying potassium (GIRK) channels in health and disease. Nat Rev Neurosci. 2010; 11:301–315.
2. Iwanir S, Reuveny E. Adrenaline-induced hyperpolarization of mouse pancreatic islet cells is mediated by G protein-gated inwardly rectifying potassium (GIRK) channels. Pflugers Arch. 2008; 456:1097–1108.
3. Perry CA, Pravetoni M, Teske JA, Aguado C, Erickson DJ, Medrano JF, Lujan R, Kotz CM, Wickman K. Predisposition to late-onset obesity in GIRK4 knockout mice. Proc Natl Acad Sci USA. 2008; 105:8148–8153.
4. Shankar H, Kahner BN, Prabhakar J, Lakhani P, Kim S, Kunapuli SP. G-protein-gated inwardly rectifying potassium channels regulate ADP-induced cPLA2 activity in platelets through Src family kinases. Blood. 2006; 108:3027–3034.
5. Shankar H, Murugappan S, Kim S, Jin J, Ding Z, Wickman K, Kunapuli SP. Role of G protein-gated inwardly rectifying potassium channels in P2Y12 receptor-mediated platelet functional responses. Blood. 2004; 104:1335–1343.
6. Smith PA, Sellers LA, Humphrey PP. Somatostatin activates two types of inwardly rectifying K+ channels in MIN-6 cells. J Physiol. 2001; 532:127–142.
7. Scholl UI, Lifton RP. New insights into aldosterone-producing adenomas and hereditary aldosteronism: mutations in the K+ channel KCNJ5. Curr Opin Nephrol Hypertens. 2013; 22:141–147.
8. Choi M, Scholl UI, Yue P, Bjorklund P, Zhao B, Nelson-Williams C, Ji W, Cho Y, Patel A, Men CJ, Lolis E, Wisgerhof MV, Geller DS, et al. K+ channel mutations in adrenal aldosterone-producing adenomas and hereditary hypertension. Science. 2011; 331:768–772.
9. Takanami I, Inoue Y, Gika M. G-protein inwardly rectifying potassium channel 1 (GIRK 1) gene expression correlates with tumor progression in non-small cell lung cancer. BMC Cancer. 2004; 4:79.
10. Brevet M, Fucks D, Chatelain D, Regimbeau JM, Delcenserie R, Sevestre H, Ouadid-Ahidouch H. Deregulation of 2 potassium channels in pancreas adenocarcinomas: implication of KV1.3 gene promoter methylation. Pancreas. 2009; 38:649–654.
11. Stringer BK, Cooper AG, Shepard SB. Overexpression of the G-protein inwardly rectifying potassium channel 1 (GIRK1) in primary breast carcinomas correlates with axillary lymph node metastasis. Cancer Res. 2001; 61:582–588.
12. Brevet M, Ahidouch A, Sevestre H, Merviel P, El Hiani Y, Robbe M, Ouadid-Ahidouch H. Expression of K+ channels in normal and cancerous human breast. Histol Histopathol. 2008; 23:965–972.
13. Rezania S, Kammerer S, Li C, Steinecker-Frohnwieser B, Gorischek A, DeVaney TT, Verheyen S, Passegger CA, Tabrizi-Wizsy NG, Hackl H, Platzer D, Zarnani AH, Malle E, et al. Overexpression of KCNJ3 gene splice variants affects vital parameters of the malignant breast cancer cell line MCF-7 in an opposing manner. BMC Cancer. 2016; 16:628–016–2664–8.
14. Symmans WF, Hatzis C, Sotiriou C, Andre F, Peintinger F, Regitnig P, Daxenbichler G, Desmedt C, Domont J, Marth C, Delaloge S, Bauernhofer T, Valero V, et al. Genomic index of sensitivity to endocrine therapy for breast cancer. J Clin Oncol. 2010; 28:4111–4119.
15. Matsui A, Ihara T, Suda H, Mikami H, Semba K. Gene amplification: mechanisms and involvement in cancer. Biomol Concepts. 2013; 4:567–582.
16. Albertson DG. Gene amplification in cancer. Trends Genet. 2006; 22:447–455.
17. Kashiwagi H, Uchida K. Genome-wide profiling of gene amplification and deletion in cancer. Hum Cell. 2000; 13:135–141.
18. Kammerer S, Jahn SW, Winter E, Eidenhammer S, Rezania S, Regitnig P, Pichler M, Schreibmayer W, Bauernhofer T. Critical evaluation of KCNJ3 gene product detection in human breast cancer: mRNA in situ hybridisation is superior to immunohistochemistry. J Clin Pathol. 2016; [Epub ahead of print].
19. Than BL, Goos JA, Sarver AL, O’Sullivan MG, Rod A, Starr TK, Fijneman RJ, Meijer GA, Zhao L, Zhang Y, Largaespada DA, Scott PM, Cormier RT. The role of KCNQ1 in mouse and human gastrointestinal cancers. Oncogene. 2014; 33:3861–3868.
20. Ruggieri P, Mangino G, Fioretti B, Catacuzzeno L, Puca R, Ponti D, Miscusi M, Franciolini F, Ragona G, Calogero A. The inhibition of KCa3.1 channels activity reduces cell motility in glioblastoma derived cancer stem cells. PLoS One. 2012; 7:e47825.
21. Morokuma J, Blackiston D, Adams DS, Seebohm G, Trimmer B, Levin M. Modulation of potassium channel function confers a hyperproliferative invasive phenotype on embryonic stem cells. Proc Natl Acad Sci USA. 2008; 105:16608–16613.
22. Li C, Rezania S, Kammerer S, Sokolowski A, Devaney T, Gorischek A, Jahn S, Hackl H, Groschner K, Windpassinger C, Malle E, Bauernhofer T, Schreibmayer W. Piezo1 forms mechanosensitive ion channels in the human MCF-7 breast cancer cell line. Sci Rep. 2015; 5:8364.
23. Hanahan D, Weinberg RA. Hallmarks of cancer: the next generation. Cell. 2011; 144:646–674.
24. Li M, Xiong ZG. Ion channels as targets for cancer therapy. Int J Physiol Pathophysiol Pharmacol. 2011; 3:156–166.
25. Prevarskaya N, Skryma R, Shuba Y. Ion channels and the hallmarks of cancer. Trends Mol Med. 2010; 16:107–121.
26. Hanahan D, Weinberg RA. The hallmarks of cancer. Cell. 2000; 100:57–70.
27. Yang M, Brackenbury WJ. Membrane potential and cancer progression. Front Physiol. 2013; 4:185.
28. Ouadid-Ahidouch H, Roudbaraki M, Delcourt P, Ahidouch A, Joury N, Prevarskaya N. Functional and molecular identification of intermediate-conductance Ca(2+)-activated K(+) channels in breast cancer cells: association with cell cycle progression. Am J Physiol Cell Physiol. 2004; 287:C125–34.
29. Wang Z. Roles of K+ channels in regulating tumour cell proliferation and apoptosis. Pflugers Arch. 2004; 448:274–286.
30. Ouadid-Ahidouch H, Le Bourhis X, Roudbaraki M, Toillon RA, Delcourt P, Prevarskaya N. Changes in the K+ current-density of MCF-7 cells during progression through the cell cycle: possible involvement of a h-ether.a-gogo K+ channel. Receptors Channels. 2001; 7:345–356.
31. Ouadid-Ahidouch H, Chaussade F, Roudbaraki M, Slomianny C, Dewailly E, Delcourt P, Prevarskaya N. KV1.1 K(+) channels identification in human breast carcinoma cells: involvement in cell proliferation. Biochem Biophys Res Commun. 2000; 278:272–277.
32. Pardo LA, del Camino D, Sanchez A, Alves F, Bruggemann A, Beckh S, Stuhmer W. Oncogenic potential of EAG K(+) channels. EMBO J. 1999; 18:5540–5547.
33. Ko JH, Ko EA, Gu W, Lim I, Bang H, Zhou T. Expression profiling of ion channel genes predicts clinical outcome in breast cancer. Mol Cancer. 2013; 12:106–4598–12–106.
34. Borresen-Dale AL. TP53 and breast cancer. Hum Mutat. 2003; 21:292–300.
35. Lin CY, Strom A, Vega VB, Kong SL, Yeo AL, Thomsen JS, Chan WC, Doray B, Bangarusamy DK, Ramasamy A, Vergara LA, Tang S, Chong A, et al. Discovery of estrogen receptor alpha target genes and response elements in breast tumor cells. Genome Biol. 2004; 5:R66.
36. Schoots O, Voskoglou T, Van Tol HHM. Genomic Organization and Promoter Analysis of the Human G-Protein-Coupled K+Channel Kir3.1 (KCNJ3/HGIRK1). Genomics. 1997; 39:279–288.
37. Kofuji P, Davidson N, Lester HA. Evidence that neuronal G-protein-gated inwardly rectifying K+ channels are activated by G beta gamma subunits and function as heteromultimers. Proc Natl Acad Sci USA. 1995; 92:6542–6546.
38. Wagner V, Stadelmeyer E, Riederer M, Regitnig P, Gorischek A, Devaney T, Schmidt K, Tritthart HA, Hirschberg K, Bauernhofer T, Schreibmayer W. Cloning and characterisation of GIRK1 variants resulting from alternative RNA editing of the KCNJ3 gene transcript in a human breast cancer cell line. J Cell Biochem. 2010; 110:598–608.
39. Schwarzenbacher D, Stiegelbauer V, Deutsch A, Ress AL, Aigelsreiter A, Schauer S, Wagner K, Langsenlehner T, Resel M, Gerger A, Ling H, Ivan C, Calin GA, et al. Low spinophilin expression enhances aggressive biological behavior of breast cancer. Oncotarget. 2015; 6:11191–11202. doi: 10.18632/oncotarget.3586.
40. Gyorffy B, Lanczky A, Eklund AC, Denkert C, Budczies J, Li Q, Szallasi Z. An online survival analysis tool to rapidly assess the effect of 22,277 genes on breast cancer prognosis using microarray data of 1,809 patients. Breast Cancer Res Treat. 2010; 123:725–731.