
INTRODUCTION
Vitamin D (VD) deficiency is common among children due to the combined effects of additional growth needs, inadequate intake and limited sunlight exposure, which has become an grave public health issue in developed and developing countries [1]. Nowadays VD deficiency is severe among children in China, with a reported prevalence of 30%–70% in the north [2] and 10%–40% in the south of China [3, 4]. One of the classic roles of VD is to maintain the homeostasis of calcium and phosphorus by absorption in the intestines and mobilization from the skeleton [5, 6]. Since the 1920s, VD was identified and its deficiency was linked to rickets [7] and more and more studies showed that VD deficiency was associated with low BMD [8–11]. With the extensive researches and global emphasis on the importance of supplement, nearly 30 years ago, the appearance of serious nutritional rickets was considered to vanish [12], however, low BMD remained prevalent [8, 10, 13]. On the basis of the international society for Clinical Densitometry States, low BMD can be one of the indicators to diagnose osteoporosis and low bone mass [14]. Therefore it is essential to maintain sustained circulating VD and bone mass from childhood to avoid these ricks.
25(OH)D is the storage form of VD, and serum 25(OH)D concentrations is an indicator of VD status. There is a lack of consensus on definition regarding VD deficiency in young children. It is supported by the Institute of Medicine (IOM) and the Endocrine Society’s practice guidelines that VD deficiency considering bone health is defined as the serum free 25(OH)D concentrations < 50 nmol/L, while the VD insufficiency is defined as the 25(OH)D concentrations of 52–72 nmol/L [15, 16]. A study by Vieth et al. suggested that the maximal inhibition of parathyroid hormone (PTH) by circulating 25(OH)D occurred at the concentrations of 25(OH)D > 80 nmol/L [17]. Some studies including our previous studies supported that when the concentrations > 75 nmol/L, the PTH levels plateaued [18]. But in late 2010, the IOM reported another statement that the concentrations of 25(OH)D > 50 nmol/L was sufficient for bone health. Whether the definition of deficiency should be extent to 75 nmol/L or greater is less clear [7].
Although the serum free 25(OH)D concentrations can partly reflect the status of VD, in the clinic examination, BMD is a vital functional outcome of VD deficiency in children [4, 19]. Quantitative ultrasound measure techniques are used wildly as an effective and convenient tool to measure BMD, particularly in the primary hospitals of China. According to the previous study, the measurement of speed of sound (SOS; m/s) is the common indicator of BMD [20].
At present, the relation between serum 25(OH)D concentrations and BMD in children remains confusion [21]. This study was designed to describe the status of 25(OH)D serum concentrations and determine the relation between serum 25(OH)D concentrations and BMD in 0–7 year old children, and to provide certain reference for the definition of VD deficiency of Chinese children.
RESULTS
A total of 4,846 serum samples were tested for 25(OH)D, with linked information related to the bone mineral density available for 4,622 (95.4%). We excluded 90 children who had liver, kidney or cardiovascular diseases, or who had 25(OH)D concentrations outside the assay detection limits. At last, a total of 4,532 (2380 boys and 2152 girls) children aged from 1 months to 7 years were included in the analysis. The mean (SD) age of children was 35.8 (20.9) months. 5.2% of the children were preterm infants (gestational age < 37 weeks), while the mean (SD) birth weight was 3.4 (0.5) kg. The percentile distributions of 25(OH)D concentrations and selected characteristics are presented in Table 1. The median concentrations was 62.9 nmol/L and 28.9% of the children had a low 25(OH)D (< 50 nmol/L). The serum free 25(OH)D concentrations was associated with gender, age, gestational season, milk intake during pregnancy and for children, VD or calcium supplementation during pregnancy and for children, and time of outdoor activity during pregnancy and for children (P < 0.05). With the increasing quartile of 25(OH)D, the BMD increased (P < 0.001). The lowest quartile of 25(OH)D had a highest prevalence (25.9%) of low BMD (P < 0.001). Compared with children with 25(OH)D > 50 nmol/L, children with low 25(OH)D (< 50 nmol/L) had a higher prevalence of low BMD (P < 0.001). BMD was also associated with age, gestational age and season, delivery mode, and time of outdoor activity during pregnancy and for children (P < 0.05). In addition, gestational season in autumn or winter, spontaneous delivery, milk intake for children < 250 ml/day, no VD or calcium supplementation during pregnancy and for children, and time of outdoor activity during pregnancy and for children < 2 h all increased the stake of low BMD (P < 0.05).
Table 1: Effects of risk factors on 25(OH)D and BMD
Variables |
N (%) |
25(OH)D |
BMD |
Low BMD |
|||
|---|---|---|---|---|---|---|---|
Mean ± SD |
P |
Mean ± SD |
P |
N (%) |
P |
||
25(OH)D quartiles (nmol/L) |
|||||||
≤ 47.7 |
1134 (25.0) |
34.5 ± 9.8 |
< 0.001 |
3336.3 ± 230.7 |
< 0.001 |
294 (25.9) |
< 0.001 |
47.8 - 62.9 |
1136 (25.1) |
55.1 ± 4.4 |
3404.9 ± 230.7 |
212 (18.7) |
|||
63.0 - 78.0 |
1138 (25.1) |
70.2 ± 4.3 |
3383.7 ± 238.3 |
204 (17.9) |
|||
≥ 78.1 |
1124 (24.8) |
95.5 ± 16.6 |
3399.8 ± 225.5 |
141 (12.5) |
|||
25(OH)D concentrations |
|||||||
< 50 nmol/L |
1310 (28.9) |
36.4 ± 10.3 |
< 0.001 |
3345.8 ± 231.7 |
< 0.001 |
335 (25.6) |
< 0.001 |
50–75 nmol/L |
1864 (41.1) |
62.2 ± 7.1 |
3397.7 ± 233.8 |
325 (17.4) |
|||
≥ 75 nmol/L |
1358 (30.0) |
92.2 ± 16.7 |
3392.5 ± 229.1 |
191 (14.1) |
|||
Gender |
|||||||
Male |
2380 (52.5) |
65.2 ± 24.6 |
< 0.001 |
3386.8 ± 236.2 |
0.087 |
444 (18.7) |
0.825 |
Female |
2152 (47.5) |
62.2 ± 24.1 |
3374.9 ± 229.0 |
407 (18.9) |
|||
Age |
|||||||
0–6 months |
413 (9.1) |
59.7 ± 23.9 |
< 0.001 |
2991.0 ± 149.6 |
< 0.001 |
65 (15.7) |
0.379 |
7–12 months |
436 (9.6) |
65.2 ± 25.1 |
3149.5 ± 124.2 |
73 (16.7) |
|||
13–24 months |
804 (17.7) |
66.9 ± 24.1 |
3298.3 ± 170.4 |
143 (17.8) |
|||
25–36 months |
696 (15.4) |
66.6 ± 24.2 |
3400.7 ± 182.0 |
134 (19.3) |
|||
37–48 months |
738 (16.3) |
65.1 ± 24.2 |
3499.8 ± 145.8 |
146 (19.8) |
|||
49–60 months |
749 (16.5) |
61.2 ± 24.5 |
3534.9 ± 133.9 |
149 (19.9) |
|||
≥ 61 months |
696 (15.4) |
60.1 ± 23.9 |
3542.6 ± 151.9 |
141 (20.3) |
|||
Gestational age |
|||||||
Term infant |
4143 (94.8) |
63.7 ± 24.5 |
0.351 |
3379.9 ± 232.4 |
0.011 |
768 (18.5) |
0.053 |
Preterm infant |
228 (5.2) |
62.2 ± 25.5 |
3334.6 ± 261.4 |
54 (23.7) |
|||
Gestational season |
|||||||
Spring |
1346 (29.7) |
60.6 ± 24.8 |
< 0.001 |
3447.3 ± 222.1 |
< 0.001 |
243 (18.1) |
< 0.001 |
Summer |
1810 (39.9) |
63.6 ± 26.8 |
3334.9 ± 229.8 |
276 (15.2) |
|||
Autumn |
580 (12.8) |
69.5 ± 21.8 |
3370.8 ± 239.5 |
139 (24.0) |
|||
Winter |
796 (17.6) |
65.2 ± 18.3 |
3381.9 ± 226.6 |
193 (24.2) |
|||
Delivery mode |
|||||||
Spontaneous delivery |
1913 (43.2) |
63.6 ± 25.3 |
0.502 |
3369.9 ± 238.7 |
0.003 |
391 (20.4) |
0.006 |
Cesarean delivery |
2516 (56.8) |
64.1 ± 23.8 |
3390.7 ± 227.2 |
432 (17.2) |
|||
Birth weight |
|||||||
< 2500 g |
187 (4.2) |
65.2 ± 24.3 |
0.609 |
3364.7 ± 235.7 |
0.346 |
32 (17.1) |
0.787 |
2500–4000 g |
3903 (87.3) |
63.7 ± 24.6 |
3379.6 ± 232.9 |
733 (18.8) |
|||
≥ 4000 g |
379 (8.5) |
63.0 ± 22.4 |
3393.7 ± 231.5 |
74 (19.5) |
|||
Feeding patterns |
|||||||
Breast feeding |
2339 (52.0) |
63.7 ± 24.8 |
0.179 |
3386.3 ± 233.5 |
0.073 |
441 (18.9) |
0.128 |
Mixed feeding |
1308 (29.1) |
63.3 ± 22.7 |
3368.6 ± 233.0 |
259 (19.8) |
|||
Artificial feeding |
849 (18.9) |
65.2 ± 25.6 |
3385.5 ± 231.0 |
139 (16.4) |
|||
Milk intake during pregnancy |
|||||||
≥ 250 ml/day |
1378 (34.0) |
65.0 ± 26.6 |
0.047 |
3366.1 ± 234.4 |
0.300 |
247 (17.9) |
0.359 |
< 250 ml/day |
2679 (66.0) |
63.3 ± 23.4 |
3374.3 ± 239.9 |
512 (19.1) |
|||
VD or calcium supplementation during pregnancy |
|||||||
Yes |
1633 (39.9) |
64.8 ± 25.1 |
0.027 |
3380.7 ± 241.5 |
0.233 |
224 (13.7) |
< 0.001 |
No |
2464 (60.1) |
63.0 ± 23.6 |
3371.5 ± 238.3 |
538 (21.8) |
|||
Time of outdoor activity during pregnancy |
|||||||
< 1 h |
696 (17.7) |
61.5 ± 24.6 |
< 0.001 |
3322.4 ± 247.1 |
< 0.001 |
174 (25.0) |
< 0.001 |
1–2 h |
1999 (51.0) |
63.0 ± 23.9 |
3364.9 ± 234.4 |
387 (19.4) |
|||
> 2 h |
1227 (31.3) |
66.3 ± 24.0 |
3388.5 ± 232.8 |
179 (14.6) |
|||
Milk intake for children |
|||||||
≥ 250 ml/day |
2100 (53.8) |
64.9 ± 23.9 |
0.018 |
3374.3 ± 222.6 |
0.200 |
336 (16.0) |
< 0.001 |
< 250 ml/day |
1804 (46.2) |
63.1 ± 23.7 |
3384.1 ± 249.2 |
385 (21.3) |
|||
VD or calcium supplementation for children |
|||||||
Yes |
1971 (50.4) |
64.3 ± 24.4 |
0.025 |
3373.2 ± 249.9 |
0.684 |
291 (14.8) |
< 0.001 |
No |
1942 (49.6) |
62.6 ± 23.9 |
3376.3 ± 228.2 |
457 (23.5) |
|||
Time of outdoor activity for children |
|||||||
< 1 h |
435 (9.7) |
59.6 ± 20.9 |
< 0.001 |
3231.7 ± 272.1 |
< 0.001 |
116 (26.7) |
< 0.001 |
1–2 h |
2014 (44.8) |
62.8 ± 24.2 |
3364.2 ± 236.7 |
435 (21.6) |
|||
> 2 h |
2042 (45.5) |
65.6 ± 25.0 |
3429.3 ± 202.6 |
290 (14.2) |
|||
As shown in Figure 1, a linear relation between the 25(OH)D concentrations and BMD was discovered (r = 0.144 , P < 0.001). After adjusting the confounders of gender, age, body mass index, gestational age and season, delivery mode, birth weight, feeding patterns, milk intake during pregnancy and for children, maternal and children’s VD or calcium supplementation, and time of outdoor activity during pregnancy and for children, the 25(OH)D concentrations was positively related with BMD (β = 172.0, 95%CI = 142.8–201.2, P < 0.001). Compared with the children of 25(OH)D ≥ 75 nmol/L, low 25(OH)D (< 50 nmol/L) had a high stake of low BMD (OR = 1.648, 95%CI = 1.347–2.017, P < 0.001), and 25(OH)D < 75 nmol/L also had a significantly high stake for low BMD (OR = 1.424, 95%CI = 1.145–1.769, P = 0.001) (Table 2).
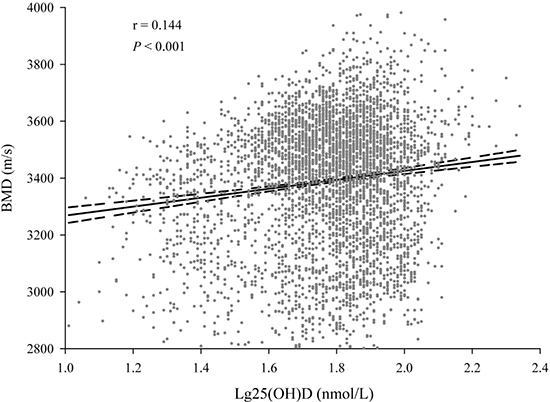
Figure 1: The relation between serum 25(OH)D concentrations and BMD. (A) linear relation between 25(OH)D concentrations and BMD was observed. The correlation coefficient was 0.144 (P < 0.001).
Table 2: Adjusted association between 25(OH)D and BMD
Variables |
BMD a |
Low BMD a |
||
|---|---|---|---|---|
β (95% CI) |
P |
OR (95% CI) |
P |
|
Lg 25(OH)D |
172.0 (142.8, 201.2) |
< 0.001 |
0.197 (0.117, 0.331) |
< 0.001 |
25(OH)D levels |
||||
25(OH)D (≥ 75 nmol/L) |
0.0 (ref) |
1.000 (ref) |
||
Low 25(OH)D (< 50 nmol/L) |
−52.3 (−64.0, −40.6) |
< 0.001 |
1.648 (1.347, 2.017) |
< 0.001 |
Low 25(OH)D (< 75 nmol/L) |
−40.2 (−51.8, −28.7) |
< 0.001 |
1.424 (1.145, 1.769) |
0.001 |
a Adjusted: gender, age, body mass index, gestational age and season, delivery mode, birth weight, feeding patterns, milk intake during pregnancy and for children, VD or calcium supplementation during pregnancy and for children, and time of outdoor activity during pregnancy and for children.
Then we conducted a stratified analysis on the association between 25(OH)D concentrations and the stake of low BMD (Table 3). When the concentrations was < 50 nmol/L, the stake of low BMD decreased along with the increase of 25(OH)D concentrations (OR = 0.982, 95%CI = 0.965–0.998, P = 0.031); While when the concentrations was < 75 nmol/L, the stake remain decreased (OR = 0.984, 95%CI = 0.977–0.991, P < 0.001). However, when 25(OH)D concentrations was ≥ 75 nmol/L, the association was not observed (P > 0.05). Consistently, there was a nonlinear relation between the serum 25(OH)D and low BMD. When the 25(OH)D concentration reached 75 nmol/L, the prevalence of low BMD plateaued (Figure 2). The prevalence of low BMD was 14.1% among children with 25(OH)D concentrations ≥ 75 nmol/L, which was significantly lower than 17.4% in children with the concentrations between 50–75 nmol/L and 25.6% in children with the concentrations < 50 nmol/L (P < 0.05) (Figure 3).
Table 3: Stratified analyses on association between 25(OH)D concentrations and low BMD
25(OH)D concentrations |
OR (95% CI) a |
P a |
|---|---|---|
< 50 nmol/L |
0.982 (0.965, 0.998) |
0.031 |
< 75 nmol/L |
0.984 (0.977, 0.991) |
< 0.001 |
≥ 75 nmol/L |
0.986 (0.971, 1.000) |
0.052 |
a Adjusted: gender, age, body mass index, gestational age and season, delivery mode, birth weight, feeding patterns, milk intake during pregnancy and for children, VD or calcium supplementation during pregnancy and for children, and time of outdoor activity during pregnancy and for children.
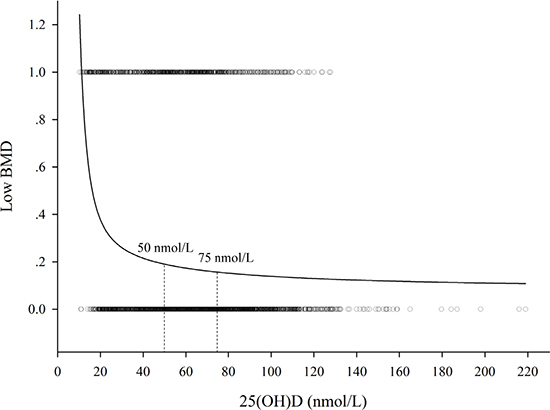
Figure 2: The relation between serum 25(OH)D concentrations and low BMD. (A) nonlinear relation between the serum 25(OH)D and low BMD was observed. When the 25(OH)D concentrations reached 75 nmol/L, the prevalence of low BMD plateaued.
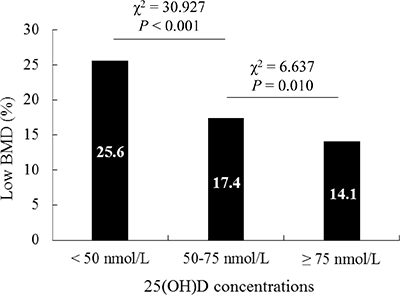
Figure 3: The effect of different classification of 25(OH)D and the prevalence of low BMD. The prevalence of low BMD in children with 25(OH)D concentrations ≥ 75 nmol/L was significantly lower than that of the serum concentrations between 50–75 nmol/L and < 50 nmol/L (P < 0.05).
DISCUSSION
There had been lack of large epidemiological studies of VD situation in Chinese young children. Our study made up these shortcomings. As one of the biggest provinces of China, the state of VD deficiency of young children in Jiangsu Province allowed of no optimism. The study indicated that nearly 30% of 0–7 year old children had serum 25(OH)D concentrations under 50 nmol/L, while if we improved the definition standard to 75 nmol/L, almost 70% of whom had VD deficiency. The situation was more severe than that of Shanghai and Sichuan Province of China [4, 22]. The median 25(OH)D concentrations in this study was 62.9 nmol/L, which was much lower than that of US population based on the National Health and Nutrition Examination 2000–2004 survey (for 1–5 year old children, the mean serum 25(OH)D concentrations was 76.5 nmol/L) [23].
As is known to us, sunlight exposure plays an important role in serum VD concentrations. Considering the limited sunlight exposure nowadays, dietary intake of VD is necessary. It is suggested by the Endocrine Society’s practice guidelines that children under 1 year old should take 400–1000 IU/d and then 600–1000 IU/d until 18 years old [16]. According to the newest suggestion of the Pediatric Branch of Chinese Medical Association, Chinese children are recommended to take 400–800 IU/d of VD after birth to 2 years old. And for premature infants, the supplements are 800–1000 IU/d after birth to 3 months then 400–800 IU/d until 2 years old. However, due to the misunderstanding of VD, many parents dared about the intoxication of extended taken of VD and did not follow the advice of doctors strictly. Early in the 1920s, surveys of VD toxicity appeared. In fact, these children who died had received nearly 20,000,000 units of VD, which were pharmacological doses and not within the physiological range [24]. Nowadays, it was confirmed by many researchers including Vieth et al. that supplement of 10,000 IU/d to 5 months and longer was safe and without adverse events [25]. While another research involving divers without sunlight exposure for 6 months showed that even 600 IU/d VD could not maintain the circulating serum 25(OH)D concentrations [24]. Unfortunately, it was not clearly that what dosages of VD were physiologic and what were pharmacologic. Because of the misunderstandings, fear of causing VD intoxication in children has continued up to now. That is why the medical scientists are reluctant to improve vitamin D requirements and the standard of VD deficiency.
For the serum 25(OH)D measurement, the liquid chromatography-tandem mass spectrometry (LC-MS/MS) method is generally considered to be the gold standard. However, the enzyme immunoassay was used in our study. Although the immunoassay may result in a little negative biases and misclassification of participants for vitamin D sufficiency when compared with the LC-MS/MS assay [26], it is more readily available and require small volume sampling, ideal for testing [27]. For assessment of BMD, the dual energy X-ray absorptiometry is the best way. However, it has only been used in major hospitals for its expensive and limited usage. Whereas quantitative ultrasound is of low cost, convenient and lack of radiation, which is used wildly to reflect the BMD of young children especially in clinical routine health exams [3, 4]. The study involving the relation between quantitative ultrasound BMD and serum 25(OH)D were relatively rare, especially in China. A study of small sample size of 203 children in Shanghai, China supported that BMD increased with the increase of the 25(OH)D concentrations, and suggested a threshold for the 25(OH)D concentrations of 20 ng/ml existed for low BMD [4]. Another study of 6,838 children in Sichuan province of China reported that VD concentrations might be correlated with BMD within a certain range (serum 25(OH)D concentrations between 50–75 nmol/L) [22]. The limitations of the above studies were lack of comprehensive design with large scale and multi-center or without adjusting for confounding factors. In this study, we conducted a multi-center case-control study, and taken into account the potential confounding factors. It was confirmed in our study along with the fact that low BMD of children was possibly to decrease when the concentrations was over 50 nmol/L. We provided a certain reference for the definition of VD deficiency that 25(OH)D concentrations under 75 nmol/L might be more appropriate than the concentrations under 50 nmol/L in 0–7 year old children. According to the report by Heaney et al., the calcium absorption of intestines was reduced in those who exhibit serum 25(OH)D concentrations of 50 nmol/L compared to the subjects with 25(OH)D concentrations more than 80 nmol/L [28]. However, more evidence is needed to support the definition of VD deficiency in young Chinese children, extending to 75 or even 80 nmol/L. Of course, our study had several shortcomings that should be noted. This study just focused on 13 Child Health Care centers of Jiangsu Province, which did not include other provinces of China. Further studies incorporating diverse populations and long term effect of VD deficiency are warranted to validate and extend the findings.
MATERIALS AND METHODS
The study was approved by the institutional review board of the Jiangsu Women and Children Health Hospital, the First Affiliated Hospital with Nanjing Medical University. The methods were carried out according to the approved guidelines and conformed to the Declaration of Helsinki. All the participants or the guardians signed informed consent.
Participants and study design
A nested case-control study was conducted on the basis of a study population of more than 50,000 children (0–7 year old) who were attending health check-up between April 2014 and March 2015 in 13 Children’s Health Care Centers of Jiangsu Province (between 30 and 36 degrees north latitude), China. The children with metabolic bone disease or abnormal PTH level were excluded. Data from banked serum and routinely collected structured questionnaire were used. Serum samples were collected and archived according to the time of collection in boxes containing 100 samples, and stored at –80°C. The cases of low BMD were defined as children with speed of sound under the 20th percentile, while the controls of standard BMD were defined as being greater than or equal to the 20th percentile according to the common standard separated by gender and age [4]. The cases were randomly selected from the screening population by using a computerized random number function, with the specific box of the cases identified. Controls were then sourced by using the remaining samples in each box. The full box was analyzed by the trained laboratory technicians without knowing the all subjects’ case or control status. As a result, 4,846 samples consented to participate in the study. After written informed consent was obtained, a face to face investigation was conducted by the prepared doctors with the structured questionnaire to collect related details including gender, age, weight, height, gestational age and season, delivery mode, birth weight, feeding patterns, milk intake during pregnancy and for children, VD or calcium supplementation during pregnancy and for children, time of outdoor activity during pregnancy and for children, and so on.
Bone ultrasound and serum 25(OH)D measurement
The BMD were determined by using the quantitative ultrasound BMD scanner (Sunlight Omnisense TM 7000, Israel). The trained doctors measured SOS at the left mid-tibia of children and repeated once again. Serum samples were thawed once, and serum 25(OH)D concentrations was determined by using an in vitro diagnostic enzyme immunoassay kit OCTEIA 25-Hydroxy Vitamin D (Immunodiagnostic Systems, Boldon, United Kingdom) according to the instructions. The variations between intra- and inter-assay coefficients were less than 9.0%, and the reported analytic sensitivity of the immunoassay was 6.8–380 nmol/L. Commonly used cutoffs to define 25(OH)D status were assigned at 50 and 75 nmol/L [4, 15, 16]. More than 10% results were selected to repeat for quality control at random.
Statistical analysis
The 25(OH)D concentrations and BMD by the selected characteristics were described as mean ± SD, and differences were calculated by the Student’s t-test or One-Way ANOVA. Differences of the low BMD prevalence by 25(OH)D concentrations and selected characteristics were calculated by χ2 test. As the distribution of serum 25(OH)D concentrations was obviously skewed toward the left, we converted it to the Log10 [Lg25(OH)D] for the next analysis. The associations of 25(OH)D concentrations with BMD and stakes of low BMD were estimated by using multiple linear regression and logistic regression analyses, respectively, in which the key potential confounders were taken into account. The relation between 25(OH)D and BMD, and between 25(OH)D and stakes of low BMD were explored by a smoothing plot. The relation between 25(OH)D and BMD was analyzed by using Pearson’s test. All the statistical analyses were performed with R software (version 2.13.0), and P ≤ 0.05 in a two-sided test was interpreted as statistically significant.
ACKNOWLEDGMENTS
The investigator team would like to acknowledge and thank all doctors, parents and children of the participating institutions (Jiangsu Women and Children Health Hospital, the First Affiliated Hospital with Nanjing Medical University, the Second Affiliated Hospital of Nanjing Medical University, Jiangning Maternity and Child Health Care Institute, Drum Tower Maternity and Child Health Care Institute, Suzhou Municipal Hospital, Wuxi Maternity and Child Health Care Hospital, Huai’an Maternity and Child Health Care Hospital, Yancheng Maternity and Child Health Care Institute, Dafeng Maternity and Child Health Care Hospital, Nantong Maternity and Child Health Care Hospital, Xuzhou Children’s Hospital, Xinghua Maternity and Child Health Care Hospital, Kunshan Maternity and Child Health Care Institute).
CONFLICTS OF INTEREST
The authors declare no conflicts of interest.
GRANT SUPPORT
This work was funded in part by grants from the National Center for Women and Children’s Health, China CDC (2012FY002) and the construction fund for key subjects of women and children of Jiangsu Province (FXK201203).
Authors’ contributions
RQ and YF H designed the study. YR F, YZ, ZY Q and ZY collected the data. RQ, YF H, YR F and JW conducted the statistical analysis and interpretation. YR F, YF H, and RQ wrote the report. JW and RQ revised the report. All the authors reviewed the report and approved the final version.
REFERENCES
1. van Schoor NM, Lips P. Worldwide vitamin D status. Best Pract Res Clin Endocrinol Metab. 2011; 25:671–680.
2. Strand MA, Perry J, Zhao J, Fischer PR, Yang J, Li S. Severe vitamin D-deficiency and the health of North China children. Matern Child Health J. 2009; 13:144–150.
3. Zhu Z, Zhan J, Shao J, Chen W, Chen L, Li W, Ji C, Zhao Z. High prevalence of vitamin D deficiency among children aged 1 month to 16 years in Hangzhou, China. BMC Public Health. 2012; 12:126.
4. Yu X, Zhang J, Yan C, Shen X. Relationships between serum 25-hydroxyvitamin D and quantitative ultrasound bone mineral density in 0–6 year old children. Bone. 2013; 53:306–310.
5. Mimouni FB, Mandel D, Lubetzky R, Senterre T. Calcium, phosphorus, magnesium and vitamin D requirements of the preterm infant. World Rev Nutr Diet. 2014; 110:140–151.
6. Wongdee K, Charoenphandhu N. Vitamin D-enhanced duodenal calcium transport. Vitam Horm. 2015; 98:407–440.
7. Scott MG, Gronowski AM, Reid IR, Holick MF, Thadhani R, Phinney K. Vitamin D: the more we know, the less we know. Clin Chem. 2015; 61:462–465.
8. Rosen CJ, Gallagher JC. The 2011 IOM report on vitamin D and calcium requirements for north america: clinical implications for providers treating patients with low bone mineral density. J Clin Densitom. 2011; 14:79–84.
9. Rabelink NM, Westgeest HM, Bravenboer N, Jacobs MA, Lips P. Bone pain and extremely low bone mineral density due to severe vitamin D deficiency in celiac disease. Arch Osteoporos. 2011; 6:209–213.
10. Tastan Y, Kann PH, Tinneberg HR, Hadji P, Muller-Ladner U, Lange U. Low bone mineral density and vitamin d deficiency correlated with genetics and other bone markers in female Turkish immigrants in Germany. Clin Rheumatol. 2016; 35:2789–2795.
11. Kruavit A, Chailurkit LO, Thakkinstian A, Sriphrapradang C, Rajatanavin R. Prevalence of vitamin D insufficiency and low bone mineral density in elderly Thai nursing home residents. BMC Geriatr. 2012; 12:49.
12. Raiten DJ, Picciano MF. Vitamin D and health in the 21st century: bone and beyond. Executive summary. Am J Clin Nutr. 2004; 80:1673S-1677S.
13. Ubesie AC, Heubi JE, Kocoshis SA, Henderson CJ, Mezoff AG, Rao MB, Cole CR. Vitamin D deficiency and low bone mineral density in pediatric and young adult intestinal failure. J Pediatr Gastroenterol Nutr. 2013; 57:372–376.
14. Wright NC, Looker AC, Saag KG, Curtis JR, Delzell ES, Randall S, Dawson-Hughes B. The recent prevalence of osteoporosis and low bone mass in the United States based on bone mineral density at the femoral neck or lumbar spine. J Bone Miner Res. 2014; 29:2520–2526.
15. Ross AC. The 2011 report on dietary reference intakes for calcium and vitamin D. Public Health Nutr. 2011; 14:938–939.
16. Holick MF, Binkley NC, Bischoff-Ferrari HA, Gordon CM, Hanley DA, Heaney RP, Murad MH, Weaver CM, Endocrine S. Evaluation, treatment, and prevention of vitamin D deficiency: an Endocrine Society clinical practice guideline. J Clin Endocrinol Metab. 2011; 96:1911–1930.
17. Vieth R, Ladak Y, Walfish PG. Age-related changes in the 25-hydroxyvitamin D versus parathyroid hormone relationship suggest a different reason why older adults require more vitamin D. J Clin Endocrinol Metab. 2003; 88:185–191.
18. Liang GY, Qin R, Li J, Liang GX, Guan YJ, Gao ZH. Optimal level of 25-(OH)D in children in Nanjing (32 degrees N Lat) during winter. Pediatr Int. 2011; 53:541–545.
19. Huang T, Liu H, Zhao W, Li J, Wang Y. Gene-dietary fat interaction, bone mineral density and bone speed of sound in children: a twin study in China. Mol Nutr Food Res. 2015; 59:544–551.
20. Olszynski WP, Adachi JD, Hanley DA, Davison KS, Brown JP. Comparison of Speed of Sound Measures Assessed by Multisite Quantitative Ultrasound to Bone Mineral Density Measures Assessed by Dual-Energy X-Ray Absorptiometry in a Large Canadian Cohort: the Canadian Multicentre Osteoporosis Study (CaMos). J Clin Densitom. 2016; 19:234–241.
21. Videhult FK, Ohlund I, Hernell O, West CE. Body mass but not vitamin D status is associated with bone mineral content and density in young school children in northern Sweden. Food Nutr Res. 2016; 60:30045.
22. Xiong F, Yang F, Yang SF, Wu KM. Relationship between serum 25-hydroxyvitamin D and bone mineral density in children under 7 years old. Zhongguo Dang Dai Er Ke Za Zhi. 2014; 16:883–886.
23. Looker AC, Pfeiffer CM, Lacher DA, Schleicher RL, Picciano MF, Yetley EA. Serum 25-hydroxyvitamin D status of the US population: 1988–1994 compared with 2000–2004. Am J Clin Nutr. 2008; 88:1519–1527.
24. Wagner CL, Taylor SN, Hollis BW. Does vitamin D make the world go ‘round’? Breastfeed Med. 2008; 3:239–250.
25. Vieth R. Vitamin D toxicity, policy, and science. J Bone Miner Res. 2007; 22:V64–68.
26. He CS, Gleeson M, Fraser WD. Measurement of circulating 25-hydroxy vitamin d using three commercial enzyme-linked immunosorbent assay kits with comparison to liquid chromatography: tandem mass spectrometry method. ISRN Nutr. 2013; 2013:723139.
27. Gallo S, Comeau K, Agellon S, Vanstone C, Sharma A, Jones G, L’Abbe M, Khamessan A, Weiler H, Rodd C. Methodological issues in assessing plasma 25-hydroxyvitamin D concentration in newborn infants. Bone. 2014; 61:186–190.
28. Heaney RP, Dowell MS, Hale CA, Bendich A. Calcium absorption varies within the reference range for serum 25-hydroxyvitamin D. J Am Coll Nutr. 2003; 22:142–146.