
INTRODUCTION
Melanoma is a highly malignant tumor that is associated with the deaths of 50,000 people worldwide each year [1]. Currently, the incidence of melanoma is increasing worldwide [2]. However, the molecular mechanisms driving melanoma carcinogenesis and progression have not been fully elucidated.
Many tumors develop as a result of inflammation, and many biological characteristics of tumors exhibit a close relationship with the biological processes of inflammation [3]. NF-κB is an important nuclear transcription factor involved in tumor inflammation and development [4]. NF-κB can stimulate the expression of various cytokines and chemokines involved in epithelial cell growth and activity [5]. We hypothesize that NF-κB may be involved in the malignant transformation of epithelial cells.
Extracellular Hmgb1 is a member of the damage-associated molecular patterns and exerts an important role in the startup and promotion of inflammation as a danger signal [6]. Hmgb1 is involved in tumorigenesis and development as a late mediator of inflammation [7]. Our previous studies demonstrated that Hmgb1 is highly expressed in melanoma tissues, and is a predictive factor for the poor prognosis of melanoma patients [8]. Both Hmgb1 and LPS, an immune system activation factor, can activate NF-κB and subsequently promote tumor development [9]. A previous study demonstrated that TNF-α can suppress the expression of the anti-aging gene Klotho through activation of NF-κB [10]. In addition, the Klotho gene is progressively lost in melanoma under an unknown mechanism [11]. We therefore hypothesized that inflammation-activated NF-κB may activate Hmgb1, which subsequently suppresses Klotho gene expression.
This study investigated the effects of Hmgb1 and LPS on Klotho gene expression in melanoma cells and their relationship with NF-κB signaling and the biological significance of inflammation-Klotho in the malignant phenotype of melanoma.
RESULTS
Knockdown of Hmgb1 increased tumor cell apoptosis and decreased invasion in melanoma cells
In this study, 4 melanoma cell lines were used to screen Klotho and Hmgb1 protein expression. Western blot showed that low Klotho protein expression and high Hmgb1 protein expression were detected in WM35 and WM451 cells, whereas high Klotho protein expression and low Hmgb1 protein expression were detected in SK-28 and A375 cells (Figure 1A). A375 and SK-28 cell lines with high Klotho protein expression were selected for further study. A pGFP-shHmgb1 vector was used to silence Hmgb1 gene expression in A375 (Figure 1B) and SK-28 (Figure 1C) cells. 24 hrs after transfection, Western blot showed significant decrease in Hmgb1 protein. The Transwell assay in A375 (Figure 1D, 1E) and SK-28 (Figure 1D, 1F) cells showed that shHmgb1 transfection significantly reduced invasion, whereas LPS treatment significantly increased cell invasion compared to NC and BC cells (p<0.001). Invasion in cells treated with shHmgb1 transfection and LPS was significantly higher than that in the NC and BC cells (p<0.001). However, no significant differences in the invasion of cells were observed between treatments with shHmgb1 + LPS and LPS alone (p>0.05) (Figure 1D, 1E, 1F). Flow cytometry showed that shHmgb1 transfection significantly increased the percentage of sub G0/G1 in A375 (Figure 2A-2F) and SK-28 cells (Figure 2G-2L) (p<0.05). Also, LPS reversed the effect of shHmgb1 on cell cycle in two cell lines (P<0.05). shHmgb1 transfection significantly increased the percentage of cell apoptosis in A375 (Figure 3A-3F) and SK-28 cells (Figure 3G-3L) (p<0.001). Also, LPS reversed the effect of shHmgb1 on cell apoptosis in two cell lines (P<0.001).
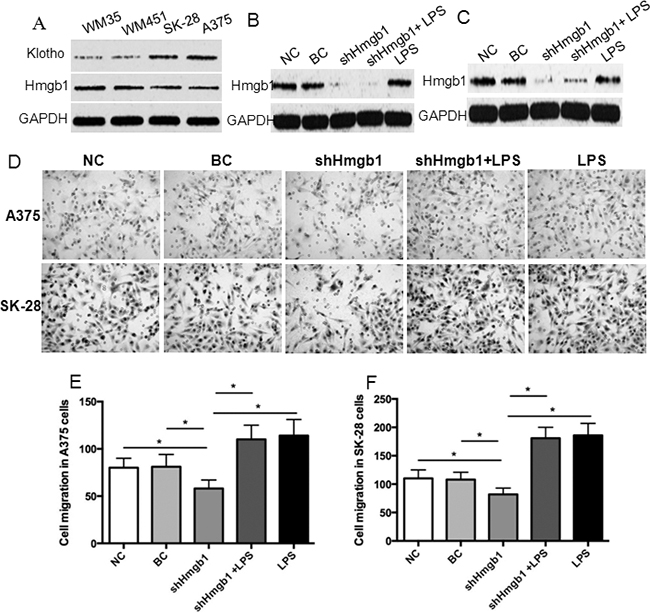
Figure 1: Knockdown of Hmgb1 expression decreases invasion in melanoma cells. A. Western blot of Klotho and Hmgb1 protein expression in WM35, WM451, SK-28, A375 cells. Cells were transfected with or without pGFP-shHmgb1 and treated with or without LPS. NC: negative control. Cells were treated with transfection reagents. BC: blank control. Cells were transfected with blank vector. shHmgb1: cells were transfected with pGFP-shHmgb1 vector to express Hmgb1 shRNA. shHmgb1+LPS: cells were transfected with pGFP-shHmgb1 vector to express Hmgb1 shRNA and treated with LPS (10 ng/ml). LPS: cells were only treated with LPS (10 ng/ml). B. Evidence of the efficacy of Hmgb1 knockdown in A375 cells. C. Evidence of the efficacy of Hmgb1 knockdown in SK-28 cells. D. Representative photographs of cell invasion in A375and SK-28 cells. LPS: LPS alone. E. The number of cell invasion in A375 cells. F. The number of cell invasion in SK-28 cells. *P<0.001 between two groups. N=4.
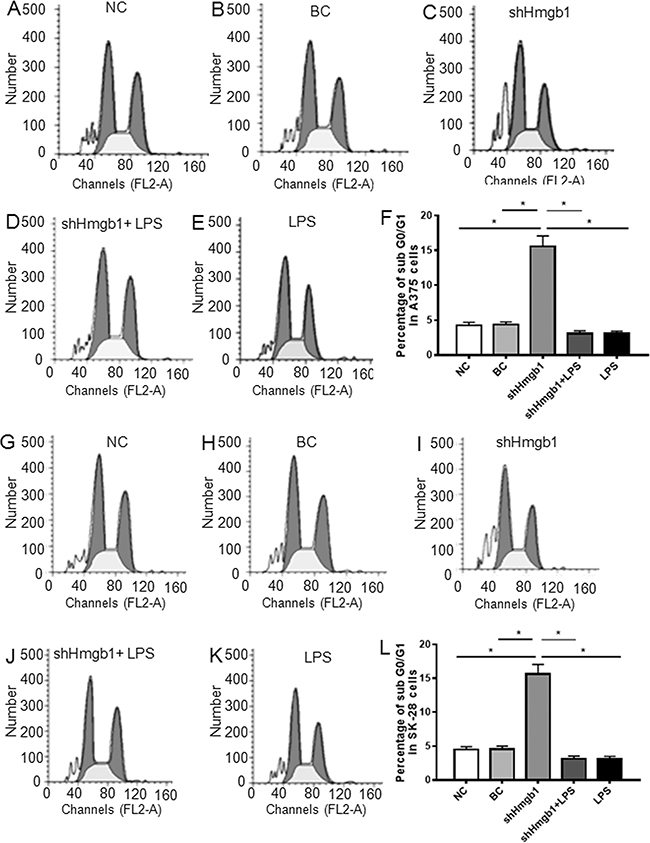
Figure 2: Knockdown of Hmgb1 expression increases sub G0/G1 cells in melanoma cells. Cells were treated as described in Figure 1. NC: negative control. BC: blank control. shHmgb1: Expressing Hmgb1 shRNA. shHmgb1+LPS: pGFP-shHmgb1 + LPS. LPS: LPS alone. A-E. Representative flow cytometry assay of cell cycle in A375 cells. F. The percentage of sub G0/G1 cells in treated A375 cells. G-K. Representative flow cytometry assay of cell cycles in SK-28 cells. L. The percentage of sub G0/G1 cells in treated SK-28 cells. *P<0.05 between two groups. N=4.
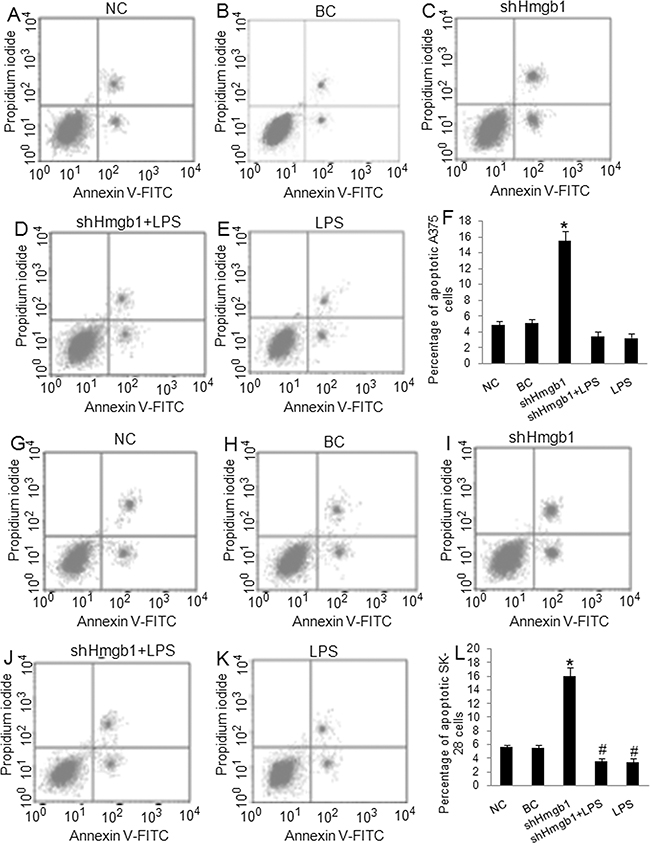
Figure 3: Knockdown of Hmgb1 expression increases apoptosis in melanoma cells. Cells were treated as described in Figure 1. NC: negative control. BC: blank control. shHmgb1: Expressing Hmgb1 shRNA. shHmgb1+LPS: pGFP-shHmgb1 + LPS. LPS: LPS alone. A-E. Representative flow cytometry assay of apoptotic cells in A375 cells. The right up and down quadrant indicates the apoptotic cells. F. The percentage of apoptotic cells in treated A375 cells. G-K. Representative flow cytometry assay of apoptotic cells in SK-28 cells. The right up and down quadrant indicates the apoptotic cells. L. The percentage of apoptotic cells in treated SK-28 cells. *P<0.001 vs. other groups. #P<0.05 vs. NC and BC group. N=4.
The effects of exogenous Hmgb1 in cell invasion, cell cycle, and apoptosis in A375 and SK-28 cells
The A375 and SK-28 melanoma cells were treated with exogenous Hmgb1 at 0.01 μg/ml, 0.05 μg/ml, 0.1 μg/ml, and 0.5 μg/ml of Hmgb1 protein with or without 100 μM of NF-κB inhibitor CAPE for 24 and 48 hrs. 0.1 μg/ml and 0.5 μg/ml of Hmgb1 was similarly effective (data not shown). 0.1 μg/ml of Hmgb1 was selected for further experiments. Invasion test showed that exogenous Hmgb1 (0.1 μg/ml) treatment for 48 hrs significantly increased cell invasion in A375 (Figure 4A, 4B) and SK-28 cells (Figure 4A, 4C) (p<0.05). CAPE not only inhibited cell invasion, but also reversed the effects of Hmgb1 on cell invasion in both cell lines (p<0.001). Flow cytometry showed that Hmgb1 treatment for 48 hrs significantly decreased the percentage of sub G0/G1 A375 (Figure 5A-5E) and SK-28 cells (Figure 5F-5J) (p<0.05). CAPE not only increased the percentage of sub G0/G1 (p<0.001) cells, but also reversed the effects of Hmgb1 on the cell cycle in both cell lines (Figure 5E, 5J) (p<0.001). Exogenous Hmgb1 treatment significantly decreased the percentage of cell apoptosis in A375 (Figure 6A-6E) and SK-28 cells (Figure 6F-6J) (p<0.05). CAPE not only increased cell apoptosis (p<0.001), but also reversed the apoptotic effect of Hmgb1 in both cell lines (Figure 6E, 6J) (p<0.001).
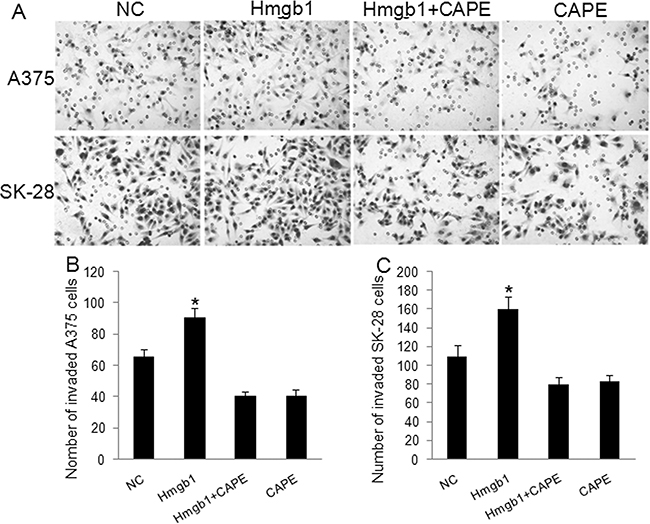
Figure 4: Exogenous Hmgb1 increased invasion in melanoma cells. A375 and SK-28 cells were treated with Hmgb1 (0.1 μg/ml) with or without 100 μM of NF-κB inhibitor Caffeic Acid Phenethyl Ester (CAPE) for 48 hrs. NC: negative control. Cells were treated with PBS. Hmgb1: cells were treated with Hmgb1 protein (dissolved in PBS). Hmgb1+CAPE: cells were treated with Hmgb1 protein and CAPE. CAPE: cells were only treated with CAPE (dissolved in PBS). A. Representative photographs of cell invasion in A375 and SK-28 cells. B. The number of cell invasion in A375 cells. C. The number of cell invasion in SK-28 cells. *P<0.05 vs. NC group, *P<0.001 vs. other groups. N=4.
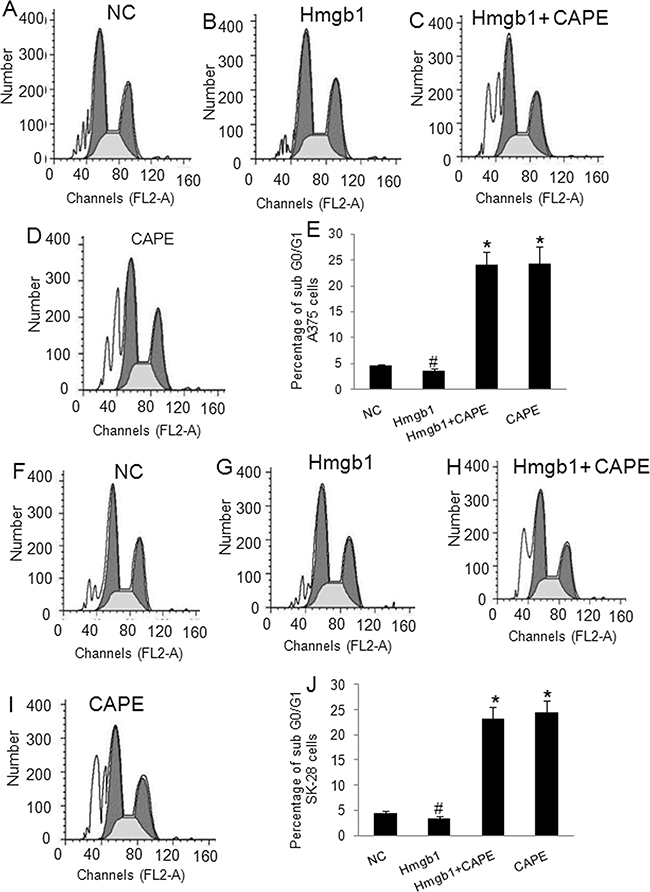
Figure 5: Exogenous Hmgb1 decreased sub G0/G1 cells in melanoma cells. A375 and SK-28 cells were treated as described in Figure 4. NC: negative control. Hmgb1: Hmgb1 protein treatment. Hmgb1+CAPE: Hmgb1 protein and CAPE. CAPE: CAPE only. A-D. Representative flow cytometry assay of cell cycle in A375 cells. E. The percentage of sub G0/G1 cells in treated A375 cells. F-I. Representative flow cytometry assay of cell cycles in SK-28 cells. J. The percentage of sub G0/G1 cells in treated SK-28 cells. *P<0.001 vs. other groups. #p<0.05 vs. NC group. N=4.
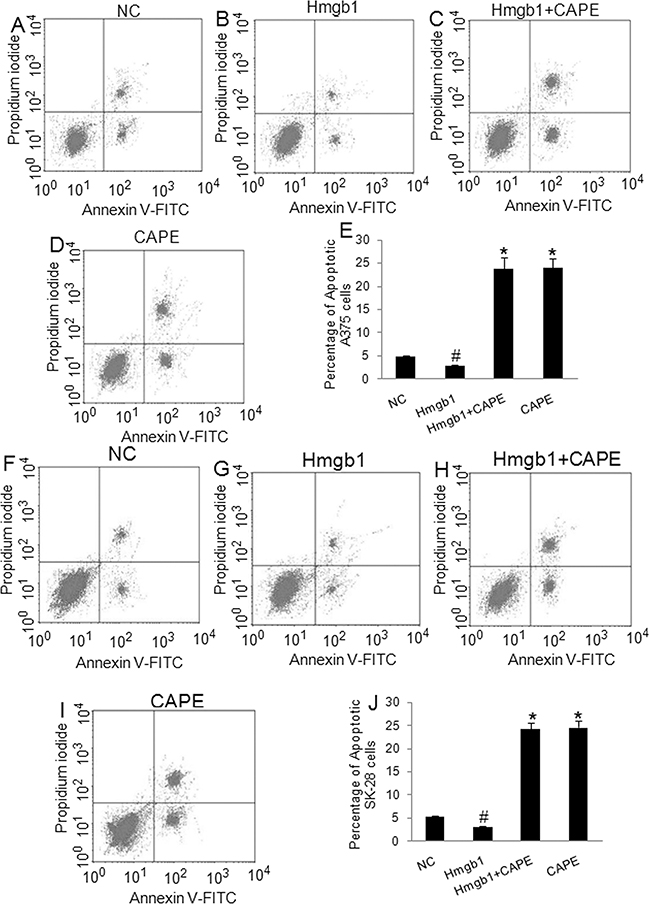
Figure 6: Exogenous Hmgb1 decreased apoptosis in melanoma cells. A375 and SK-28 cells were treated as described in Figure 4. NC: negative control. Hmgb1: Hmgb1 protein treatment. Hmgb1+CAPE: Hmgb1 protein and CAPE. CAPE: CAPE only. A-D. Representative flow cytometry of apoptotic A375 cells. The right up and down quadrant indicates the apoptotic cells. E. The percentage of apoptotic A375 cells. F-I. Representative flow cytometry of apoptotic SK-28 cells. The right up and down quadrant indicates the apoptotic cells. J. The percentage of apoptotic SK-28 cells. *P<0.001 vs. other groups. #p<0.05 vs. NC group. N=4.
Hmgb1 / LPS can activate NF-κB signaling pathway and subsequently inhibit Klotho gene expression and its downstream signaling
The levels of p-NF-κB in shHmgb1 transfected A375 (Figure 7A) and SK-28 (Figure 7B) cells were significantly reduced compared to cells in the BC and NC control cells (p<0.001), suggesting that silencing of Hmgb1 gene expression reduced NF-κB phosphorylation. Although the p-NF-κB levels in LPS treated and shHmgb1 + LPS treated A375 and SK-28 cells were significantly increased (p<0.001) compared to cells in the control (BC and NC) cells, no significance in p-NF-κB levels was observed between cells treated with shHmgb1 + LPS and LPS alone (p>0.05), suggesting that both the Hmgb1 and LPS can activate NF-κB (Figure 7A, 7B). We further found that Klotho protein expression in shHmgb1 treated A375 and SK-28 cells was significantly higher than that in control cells (p<0.001) (Figure 7A, 7B), suggesting that silencing of Hmgb1 gene expression increased Klotho protein expression. In cells treated with LPS alone, no changes in Hmgb1 protein levels was observed, but the level of Klotho protein was significantly reduced compared to control cells (p<0.001). In A375 and SK-28 cells treated with shHmgb1 + LPS, Hmgb1 and Klotho protein expression was significantly reduced compared to control cells (p<0.001).
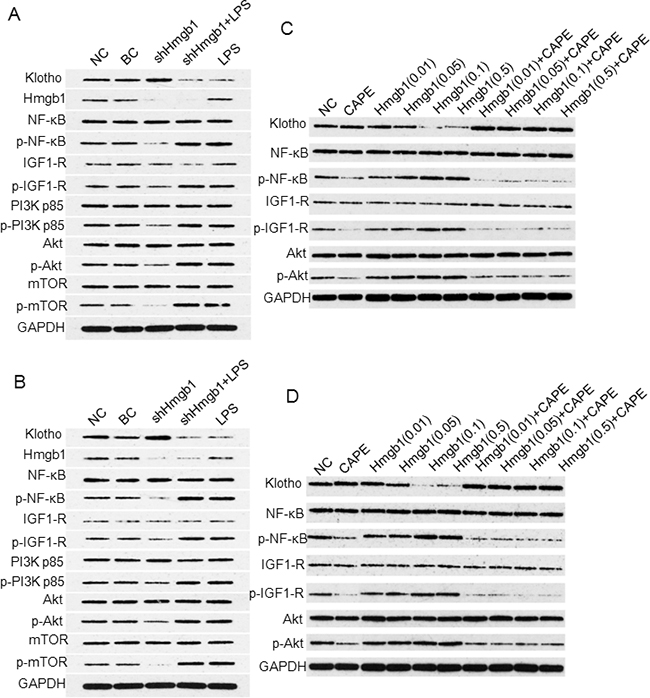
Figure 7: Western blot analysis of Klotho expression and NF-κB signaling. Western blots for A375 A. and SK-28 B. cells treated with shHmgb1 and LPS. C. Western blots for A375 and D. for SK-28 cells treated with 0.01 μg/ml, 0.05 μg/ml, 0.1 μg/ml, and 0.5μg/ml of Hmgb1 with or without 100 μM of NF-κB inhibitor (CAPE) for 24 hrs.
We further examined the expression of IGF-1R /PI3K / AKT / mTOR protein. In shHmgb1 treated A375 (Figure 7A) and SK-28 (Figure 7B) cells, the protein levels of p-IGF1-R, p-PI3K p85, p-Akt, and p-mTOR were significantly lower than that in control cells (p<0.001). In A375 (Figure 7A) and SK-28 (Figure 7B) cells treated with LPS, the levels of p-IGF1-R, p-PI3K p85, p-Akt, and p-mTOR were significantly higher than that in control cells (p <0.001). In cells treated with shHmgb1 + LPS or LPS alone, no significant differences in p-IGF1-R, p-PI3K p85, p-Akt, and p-mTOR levels were observed compared to control cells (p>0.05) (Figure 7A, 7B). Both the Hmgb1 and LPS can inhibit Klotho protein expression, which correlated with the activity of NF-κB signaling pathway.
In exogenous Hmgb1 treated cells, significant increas in p-NF-κB level, but decrease in Klotho protein expression, was observed in A375 (Figure 7C) and SK-28 (Figure 7D) melanoma cells. After treatment with p-NF-κB inhibitor CAPE, p-NF-κB level was significantly lowered, while the expression of Klotho protein was significantly increased (Figure 7C, 7D). When Klotho was highly expressed, p-IGF-1R / p-AKT levels were significantly reduced. When Klotho was lowly expressed, p-IGF-1R / p-AKT was significantly increased (Figure 7C, 7D). These findings suggest that Hmgb1 can activate NF-κB signaling pathway to decrease Klotho gene expression and the activity of downstream signaling.
Knockdown of Klotho decreased melanoma tumor cell apoptosis and increased cell invasiveness
Transfection of Klotho shRNA expression vectors for 72 hrs established over 80% transfection efficacy in A375 (Figure 8A) and SK-28 (Figure 8B) cells. Western blot showed that transfection of shKlotho-1021 was most effect in inhibiting Klotho protein expression in A375 (Figure 8C) and SK-28 (Figure 8D) cells, and shKlotho-1021 was chosen for further tests. shKlotho transfection significantly decreased the percentage of sub G0/G1 in A375 (Figure 8E-8H) and SK-28 cells (Figure 8I-8L) (p<0.001). Flow cytometry showed that shKlotho transfection significantly decreased the percentage of cell apoptosis in A375 (Figure 9A-9D) and SK-28 cells (Figure 9E-9H) (p<0.001). Similarly, transfection of shKlotho vector significantly increased cell invasion in A375 (Figure 10A, 10B) and SK-28 cells (Figure 10A, 10C) (p<0.001). We further analyzed the signaling transduction in A375 (Figure 10D) and SK-28 (Figure 10E) cells. shKlotho transfection significantly inhibited Klotho protein expression. Also, shKlotho transfection significantly increased p-IGF1-R and p-Akt protein levels in A375 and SK-28 cells (p<0.001), but had no effect on the levels of IGF1-R and Akt protein in two cell lines (Figure 10D, 10E).
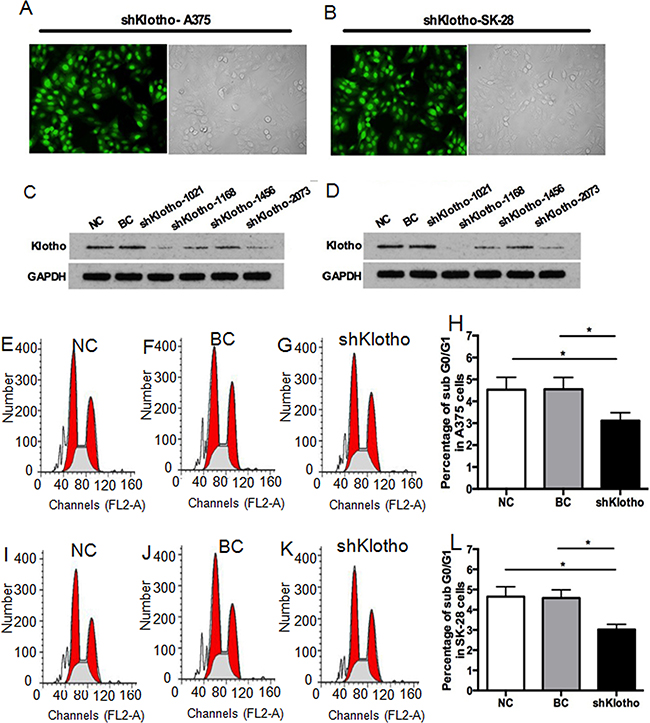
Figure 8: Knockdown of klotho gene expression decreased sub G0/G1 cells in treated melanoma cells. A. Representative transfection efficacy of Klotho shRNA (shKlotho) in A375 cells. B. Representative transfection efficacy of shKlotho shRNA in SK-28 cells. C. Representative Western blot of Klotho and GAPDH protein expression with different Klotho shRNAs in A375 cells. D. Representative Western blot of Klotho and GAPDH protein expression in SK-28 cells. E-G. Representative flow cytometry assay of cell cycles in A375 cells. H. Percentage of sub G0/G1 A375 cells with different treatments. I-K. Representative flow cytometry assay of cell cycles in SK-28 cells. L. Percentage of sub G0/G1 cells in SK-28 cells. NC: negative control. Cells were treated with transfection reagents. BC: blank control. Cells were transfected with blank vector. shKlotho: cells were transfected with pGFP-shKlotho-1021 vector to express klotho shRNA. *P<0.001 between two groups. N=4.
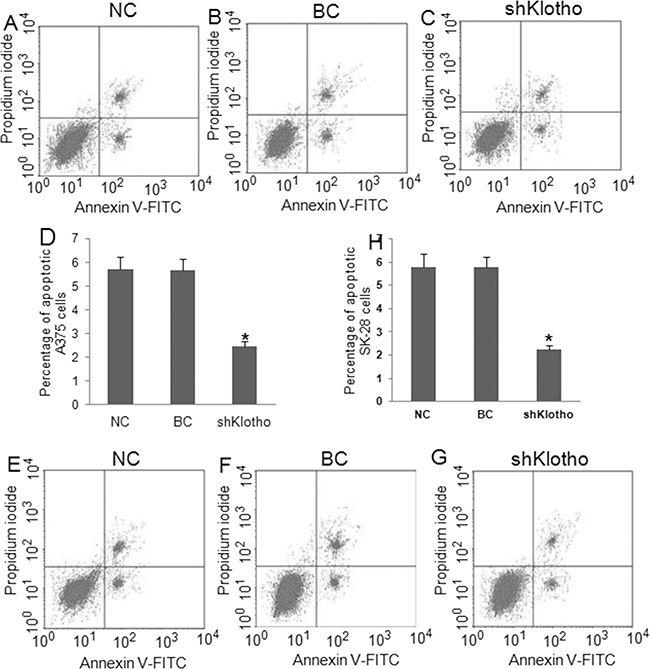
Figure 9: Knockdown of Klotho gene expression decreased apoptosis in melanoma cells. Cells were treated as described in Figure 8. NC: negative control. BC: blank control. shklotho: klotho shRNA expression. A-C. Representative flow cytometry assay of apoptotic A375 cells with different treatments. The right up and down quadrant indicates the apoptotic cells. D. Percentage of apoptotic A375 cells. E-G. Representative flow cytometry assay of apoptotic SK-28 cells. The right up and down quadrant indicates the apoptotic cells. H. Percentage of apoptotic SK-28 cells. *P<0.001 vs. other groups. N=4.
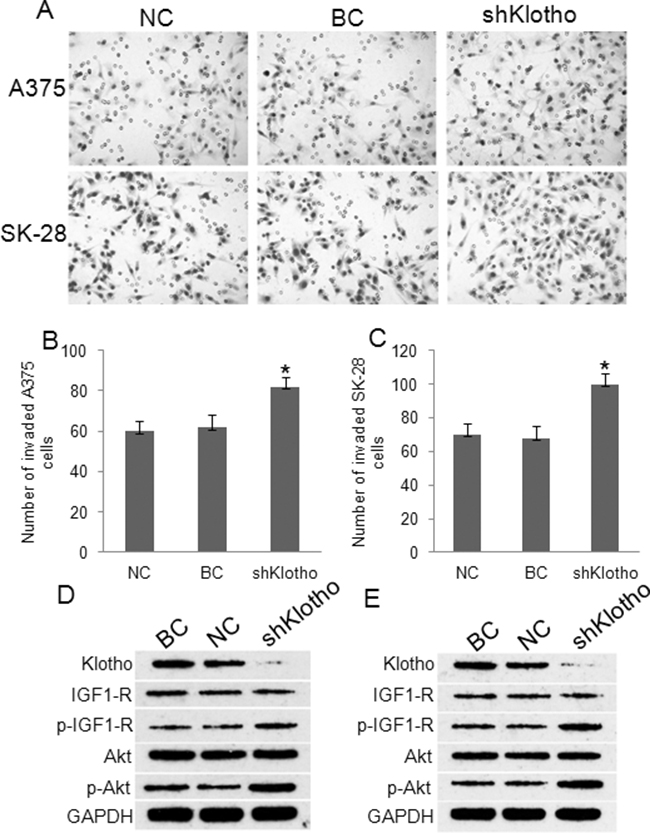
Figure 10: Knockdown of Klotho gene expression increased invasion and IGF-1R and Akt phosphorylation. Cells were treated as described in Figure 8. NC: negative control. BC: blank control. shklotho: klotho shRNA expression. A. Representative photographs of cell invasion in A375 and SK-28 cells. B. The number of cell invasion in A375 cells. C. The number of cell invasion in SK-28 cells. *P<0.001 vs. other two groups. N=4. D. Representative Western blots of protein expression in A375 cells. E. Representative Western blots of protein expression in SK-28 cells. Expression of Klotho shRNA obviously inhibited Klotho protein expression, but increased IGF-1R and Akt phosphorylation in A375 and SK-28 melanoma cells.
Klotho knockdown stimulated xenograft tumor growth in mice
We further validated the effect of Klotho gene knockdown on the growth of xenograft A375 tumors in mice. The shKlotho or scrambled control-shRNA (NC) transfected A375 cells were injected subcutaneously in nude mice. After 42 days, the mice were sacrificed. The average volume of the tumors in the shKlotho group was significantly higher than that in the control (NC) group (1.264±0.642 vs. 0.408±0.207cm3, Figure 11A, p<0.05). The average tumor weight in the shKlotho group was 1.121±0.572g, which was significantly higher than that in the control group (0.335±0.159 g) (Figure 11B, p<0.05). Kaplan-Meier analysis showed that the survival rate of mice in shKlotho group was lower than that in NC group (Figure 11C, p<0.05). These results suggest that down-regulation of Klotho gene expression significantly enhanced xenograft melanoma tumor growth.
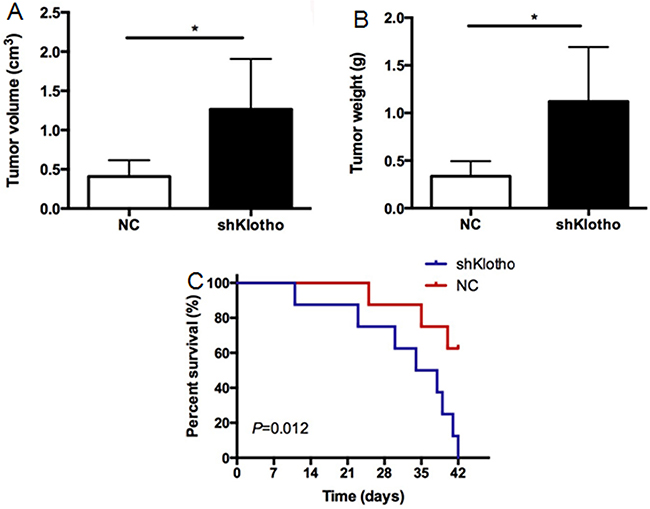
Figure 11: The effects of Klotho in xenograft melanoma tumor growth. Xenograft A375 tumors were established as described in Methods. A. The final tumor volume of xenograft A375 tumors in mice. Mice were sacrificed at 42 days after inoculation. B. The weights of xenograft A375 tumors. C. The survival of mice carrying A375 tumors. N=8. *P<0.001 between two groups.
NF-κB activation and low Klotho protein expression correlated with poor prognosis of melanoma patients
Immunohistochemistry showed that p-NF-κB protein staining was mainly located in the nucleus, while Klotho protein staining was mainly located in the cytoplasm and cell membrane (Figure 12A). Positive p-NF-κB protein staining was observed in 68% of melanoma tissues, which was significantly higher than that in the black nevus carcinoma and peritumoral tissues (23%). Positive Klotho protein staining was observed in 45% of melanoma tissues, which was significantly lower than that in black nevus carcinoma and peritumoral tissues (85%). p-NF-κB (Table 1) and Klotho (Table 2) protein expression in melanoma tissues significantly correlated with the clinical stage (P<0.05). The result of the spearman rank correlation analysis revealed that the expression of Klotho protein negatively correlated with p-NF-κB protein (Figure 12B, r = 0.819, P < 0.001). Kaplan-Meier analysis showed that the prognosis of patients with high p-NF-κB protein levels (++, +++) was significantly poor than patients with low p-NF-κB levels (-, +) (Figure 12C). In contrast, low Klotho protein levels (-, +) correlated with a poor prognosis (Figure 12D). Multivariate analysis based on Cox models was also carried out to further explore the prognostic significance of p-NF-κB (Table 3) and Klotho (Table 4) protein. The results revealed that p-NF-κB and Klotho protein levels were independent predictors of poor overall survival, indicating that high p-NF-κB or low Klotho protein levels were significantly associated with poor overall survival in melanoma patients (p<0.05).
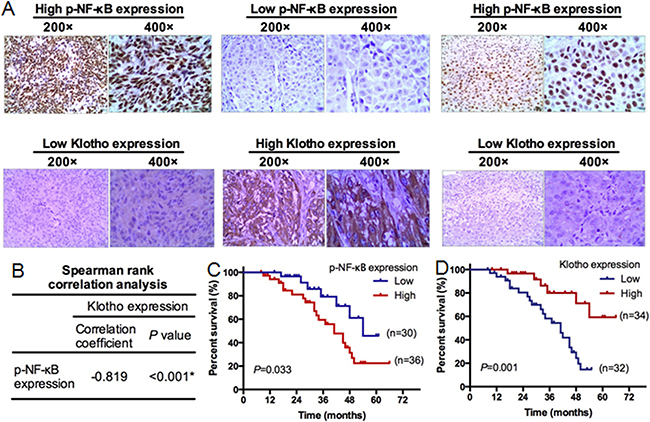
Figure 12: Klotho expression in human melanoma tissues and its clinical significance. Sixty-six melanoma tumor tissues were subjected to immunohistochemical staining of p-NF-κB and Klotho protein. A. Representative immunohistochemical staining of p-NF-κB and Klotho expression. Left panels: high p-NF-κB expression, low Klotho expression (200x, 400x) in melanoma tissues. Middle panels: low p-NF-κB expression, high Klotho expression (200x, 400x) in melanoma tissues. Right panels: high p-NF-κB expression and low Klotho expression (200x, 400x) in melanoma tissues with ulceration. B. The spearman rank correlation analysis between the expression of Klotho and p-NF-κB. C. Kaplan-Meier analysis of survival in patients with high or low p-NF-κB levels. N=66. D. Kaplan-Meier analysis of survival in patients with high or low Klotho expression. N=66.
Table 1: Correlation between the expression of p-NF-κB and clinicopathological parameters in melanoma patients
Characteristics |
p-NF-κB expression |
P value |
||||
|---|---|---|---|---|---|---|
− |
+ |
++ |
+++ |
|||
Age |
||||||
<50 |
8 (19.5%) |
12 (29.3%) |
10 (24.4%) |
11 (26.8%) |
0.609 |
|
≥50 |
2 (8.0%) |
8 (32.0%) |
6 (24.0%) |
9 (36.0%) |
||
Gender |
||||||
Male |
3 (10.0%) |
6 (20.0%) |
11 (36.7%) |
10 (33.3%) |
0.087 |
|
Female |
7 (19.4%) |
14 (38.9%) |
5 (13.9%) |
10 (27.8%) |
||
Ulcer history |
||||||
Yes |
8 (20.0%) |
11 (27.5%) |
9 (22.5%) |
12 (30.0%) |
0.579 |
|
No |
2 (7.7%) |
9 (34.6%) |
7 (26.9%) |
8 (30.8%) |
||
Position |
||||||
Limbs |
8 (17.8%) |
11 (24.4%) |
12 (26.7%) |
14 (31.1%) |
0.454 |
|
Truncus |
2 (9.5%) |
9 (42.9%) |
4 (19.0%) |
6 (28.6%) |
||
Clinical stage |
||||||
I-II |
7 (21.9%) |
9 (28.1%) |
11 (34.4%) |
5 (15.6%) |
0.029* |
|
III-IV |
3 (8.8%) |
11 (32.4%) |
5 (14.7%) |
15 (44.1%) |
||
Clark level |
||||||
I-IV |
7 (21.2%) |
10 (30.3%) |
8 (24.2%) |
8 (24.2%) |
0.494 |
|
V |
3 (9.1%) |
10 (30.3%) |
8 (24.2%) |
12 (36.4%) |
||
Breslow thickness |
||||||
<4mm |
6 (18.2%) |
13 (39.4%) |
5 (15.2%) |
9 (27.3%) |
0.199 |
|
≥4mm |
4 (12.1%) |
7 (21.2%) |
11 (33.3%) |
11 (33.3%) |
||
*P<0.05
Table 2: Correlation between the expression of Klotho and clinicopathological parameters in melanoma patients
Characteristics |
Klotho expression |
P value |
||||
|---|---|---|---|---|---|---|
− |
+ |
++ |
+++ |
|||
Age |
||||||
<50 |
7 (17.1%) |
11 (26.8%) |
11 (26.8%) |
12 (29.3%) |
0.317 |
|
≥50 |
5 (20.0%) |
11 (44.0%) |
6 (24.0%) |
3 (12.0%) |
||
Gender |
||||||
Male |
8 (26.7%) |
9 (30.0%) |
10 (33.3%) |
3 (10.0%) |
0.057 |
|
Female |
4 (11.1%) |
13 (36.1%) |
7 (19.4%) |
12 (33.3%) |
||
Ulcer history |
||||||
Yes |
4 (10.0%) |
15 (37.5%) |
11 (27.5%) |
10 (25.0%) |
0.202 |
|
No |
8 (30.8%) |
7 (26.9%) |
6 (23.1%) |
5 (19.2%) |
||
Position |
||||||
Limbs |
7 (15.6%) |
17 (37.8%) |
9 (20.0%) |
12 (26.7%) |
0.245 |
|
Truncus |
5 (23.8%) |
5 (23.8%) |
8 (38.1%) |
3 (14.3%) |
||
Clinical stage |
||||||
I-II |
5 (15.6%) |
11 (34.4%) |
4 (12.5%) |
12 (37.5%) |
0.015* |
|
III-IV |
7 (20.6%) |
11 (32.4%) |
13 (38.2%) |
3 (8.8%) |
||
Clark level |
||||||
I-IV |
5 (15.2%) |
8 (24.2%) |
12 (36.4%) |
8 (24.2%) |
0.178 |
|
V |
7 (21.2%) |
14 (42.4%) |
5 (15.2%) |
7 (21.2%) |
||
Breslow thickness |
||||||
<4mm |
4 (12.1%) |
11 (33.3%) |
8 (24.2%) |
10 (30.3%) |
0.383 |
|
≥4mm |
8 (24.2%) |
11 (33.3%) |
9 (27.3%) |
5 (15.2%) |
||
*P<0.05
Table 3: Multivariate analyses for overall survival by Cox regression model
P value |
Exp(B) |
RR 95% CI |
||
|---|---|---|---|---|
Lower |
Upper |
|||
Age |
0.102 |
2.192 |
0.856 |
5.615 |
Gender |
0.55 |
0.763 |
0.315 |
1.851 |
Ulcer history |
0.368 |
0.643 |
0.247 |
1.68 |
Position |
0.908 |
0.946 |
0.368 |
2.429 |
Clinical stage |
0.001* |
5.484 |
2.033 |
14.792 |
Clark level |
0.011* |
3.001 |
1.285 |
7.012 |
Breslow thickness |
0.222 |
0.576 |
0.237 |
1.398 |
p-NF-κB |
0.037* |
2.887 |
1.066 |
7.82 |
*P<0.05
Table 4: Multivariate analyses for overall survival by Cox regression model
P value |
Exp(B) |
RR 95% CI |
||
|---|---|---|---|---|
Lower |
Upper |
|||
Age |
0.372 |
1.567 |
0.584 |
4.206 |
Gender |
0.844 |
0.918 |
0.392 |
2.151 |
Ulcer history |
0.551 |
0.74 |
0.274 |
1.994 |
Position |
0.856 |
1.095 |
0.413 |
2.9 |
Clinical stage |
0.001* |
5.326 |
1.986 |
14.281 |
Clark level |
0.027* |
2.706 |
1.121 |
6.533 |
Breslow thickness |
0.351 |
0.661 |
0.277 |
1.578 |
Klotho |
0.022* |
0.283 |
0.096 |
0.836 |
*P<0.05
DISCUSSION
Inflammation and inflammatory cytokines have been associated with tumor occurrence and development. This study showed that silencing Hmgb1 expression significantly increased the percentage of G0/G1 cells and apoptosis in melanoma cells, and reduced tumor cell invasion. In contrast, administration of exogenous Hmgb1 decreased apoptosis and the percentage of G0/G1 cells, and increased cell invasion and NF-κB phosphorylation in the melanoma cells. These findings suggest that Hmgb1 is involved in the development of melanoma. We also found that LPS can stimulate the invasion of melanoma cells, reduce apoptosis, and activate NF-κB. LPS and Hmgb1 activated NF-κB and enhanced tumor cell proliferation. Our study suggests a pathway of inflammation-activated NF-κB-Hmgb1-Klotho in the cell survival, proliferation, and tumor growth of melanoma.
NF-κB is an important nuclear transcription factor associated with tumor inflammation [12]. After activation, NF-κB promotes the production of cytokines, chemokines, growth factors, and apoptotic proteins [13]. This study found that phospho-NF-κB levels were significantly higher in melanoma tissues than in black nevus and peritumoral tissues. Melanoma patients with high phospho-NF-κB levels had poor prognosis. Experiments with two melanoma cell lines showed that both Hmgb1 protein and LPS treatment increased the malignant phenotypes of melanoma cells via activation of NF-κB. Moreover, LPS can totally overcome the phenotypes and the decrease in Hmgb1 protein expression caused by Hmgb1 silencing. In contrast, treatment with NF-κB inhibitor CAPE can reverse the phenotypes caused by exogenous Hmgb1. These findings suggest that inflammation-activated NF-κB can stimulate Hmgb1 expression and its biological activities.
Previous reports implicate an association between inflammation and Klotho gene expression. For example, the inflammatory mediator TNF-α could significantly inhibit Klotho gene expression in renal epithelial cells [10] and fat cells [14]. This study found that Klotho protein expression was significantly lower in melanoma tissues than that in peritumoral tissues and black nevus tissues. The low Klotho protein expression correlated with high percentage of positive p-NF-κB staining in melanoma tissues. Low Klotho protein expression significantly correlated with poor prognosis of patients with melanoma. We also found that when NF-κB signaling was inhibited, Klotho protein expression was significantly increased. In contrast, when NF-κB signaling was activated, Klotho protein expression was significantly decreased. In short, we found that Klotho gene expression in melanoma cells is inhibited by inflammatory factors NF-κB.
Our previously studies found that Klotho protein inhibited the activation of IRS-1 / PI3K / Akt / mTOR and ERK / p70s6k and downstream signaling pathways in gastric cancer and liver cancer cells, mainly through the inhibition of IGF-1R phosphorylation [15, 16]. This study found that after silencing Klotho gene, p-IGF-1R / p-AKT levels and cell invasion were significantly increased, whereas tumor cell apoptosis was significantly decreased. At the same time, the p-IGF-1R / p-PI3K / p-Akt / p-mTOR’s levels were also increased or decreased with the activation or inhibitor of NF-κB. These findings indicate that Klotho may be an intermediate factor of NF-κB and insulin signaling pathways, and is involved in the malignant phenotypes of melanoma. We further validated that down-regulation of Klotho protein expression stimulated growth of xenograft A375 tumors in mice.
In conclusion, our study first proposed that inflammation inhibits Klotho gene expression in melanoma cells through activation of the inflammatory mediators Hmgb1 and NF-κB signal pathway.
MATERIALS AND METHODS
Samples
74 melanoma tissues were collected from the Second Xiangya Hospital and Third Xiangya Hospital, Central South University between 2002 and 2010 at the Department of Pathology. After passing the exclusion criteria including insufficient patient information and tumor material, 66 samples were finally collected for this study. 20 black nevi and peritumoral tissues were collected as control at the same stage. Melanoma was diagnosed by HE staining, HMB45 and S-100 protein immunohistochemical staining by three pathologists (double blind method). None of the 66 melanoma patients received chemotherapy and radiotherapy before surgery. Among the 66 melanoma patients, 30 were male and 36 were female with ages ranging from 28 to 65 years old. All specimens were fixed in 10% neutral formalin and embedded in paraffin. Tissues were sectioned at a thickness of 4 μm and stored at room temperature. The follow-up was performed by mail and telephone. The study was compliant with ethical standards.
Immunohistochemistry
Sections were deparaffinized with xylene followed by hydration in gradient ethanol and 3% hydrogen peroxide solution to eliminate endogenous peroxidase. After washing with 1xPBS buffer (pH7.4), antigen retrieval was performed by heating the sections in citric acid buffer (pH6.0) in a microwave oven at 750W for 12 min, cooling for 3 minutes, and heating at 750W for 12 minutes again, followed by cooling naturally to room temperature. After blocking at room temperature for 30 min, sections were incubated with mouse anti-human p-NF-κB and Klotho antibodies overnight at 4°C. After washing with 1xPBS buffer, sections were incubated with HRP-conjugated goat anti-mouse secondary antibody (Beijing Zhongshan company, China) at 37°C for 60 min. After incubation with substrate (S-A solution in SP kit, Beijing Zhongshan Company) for 30 min at room temperature, color development was performed with DAB solution and counterstained with hematoxylin, followed by dehydration in gradient ethanol. Positive tissue sections were used as positive controls. Primary antibody was replaced with PBS as a negative control. Brown staining in the cytoplasm, membrane, and nucleus was justified as positive. 10 high-power fields were observed for each slice. The results are divided into: <5% (-), 6% to 30% (+), 3l % to 60% (++),> 60% (+++) according to the percentage of positive cells and the degree of staining intensity of cells. A case was defined as high expression when more than 31% (++ to +++) of cells were positively stained, while a case was defined as low expression when less than 30%, and the (- to +) of cells were positive.
Cell culture
Human melanoma cell lines WM35, WM451, SK-28, and A375 were purchased from the Cell Bank of Shanghai Institute. Cells were cultured in RPMI 1640 (GIBCO) containing 10% fetal bovine serum at 37 °C, 5% CO2.
Apoptosis and cell cycle analysis
To detect apoptosis, cells were digested with 0.25% EDTA-free trypsin and collected by centrifugation at 2,000 rpm for 5 min. After washing with 1 × PBS, 1 ~ 5 × 10⁵ cells were suspended in 500 μL of binding buffer. 5 μL of annexin V-FITC was then added, followed by the addition of 5 μL of propidium iodide, and incubation at room temperature for 10 min in the dark room. Apoptotic cells were sorted by flow cytometry.
To perform cell cycle analysis, cells were collected as described above and fixed in pre-cooled 75% ethanol overnight at 4°C. After washing with 1×PBS (1000rpm, 5min), cells were resuspended in a solution of 800 μl of 1×PBS containing 1% BSA. After adding 100 μl of PI dye (3.8 × 10⁻² M sodium citrate, pH 7.0) and 100 μl of RNase A (10 mg / ml), cells were incubated at 37°C for 30 min in the dark. Cell cycles were analyzed by flow cytometry.
Western blot analysis
Cells were lysated and total protein was extracted. Western blot was performed as previously described [17]. Anti-Klotho, anti-p-IGF-IR, anti-IGF-IR, anti-p-AKT1, and anti-GAPDH antibodies were purchased from Santa Cruz biotechnology (Santa Cruz, CA, USA). Anti-AKT antibody, anti-p-PI3K, and anti-p-mTOR antibodies were purchased from Cell Signaling Technology (Danvers, MA, US).
Cell invasion assay
After digestion with 0.25% EDTA-free trypsin, cells were washed once with 1×PBS and suspended in RPMI 1640 medium containing 1% BSA at 5 × 10⁴/ml. 1 ml FBS-containing medium was added to 6-well plates and 2 ml cell suspension was added into the Transwell chamber. Cells were cultured at designated time points and membrane was removed from the lower chamber. Matrigel was wiped with a cotton swab and cells were fixed with 95% alcohol for 10 min followed by hematoxylin staining for 10 minutes. Cells were counted under inverted microscope.
Cell transfection experiments
5 × 10⁴ cells in 2 mL FBS-containing medium were seeded in each well of 6-well plates 24 hrs before transfection. Cells at 70% confluency were transfected with Hmgb1-shRNA and Klotho-shRNA expression vector (2 μg/ml) using Lipofectamine ™ 2000 reagent by following the user manual. The Hmgb1-shRNA expression vector was constructed by directionally cloning of a mini gene containing a hairpin of shRNA sequence (5’-GCAAGTATTCGGTGCTATATA-3’) of Hmgb1 gene with a 9-mer loop and 3’ terminal uridine tract into the pGPU6/GFP/Neo vector at Bam HI and Bbs I sites. The produced vector was called pGFP-shHmgb1. Klotho-shRNA1 (5’-GCCAATTGGAATCTCCCAACC-3’), Klotho-shRNA2 (5’-GCCAGGACAAGATGTTGTTGC-3’), Klotho-shRNA3 (5’-GAGCCGTATACAAGGAATATG-3’), and Klotho-shRNA4 (5’-CCGAGAGCATGAAGAATAACC-3’) expression vector was constructed as described above and called pGFP-shKlotho1, pGFP-shKlotho2, pGFP-shKlotho3, and pGFP-shKlotho4. NF-κB activator (LPS, 1μg / ml), NF-κB inhibitor (Caffeic Acid Phenethyl Ester, called CAPE, 200 μM), and HMGB1 (0.01 μg / ml, 0.05 μg / ml, 0.1 μg / ml, and 0.5 μg / ml) were added.
Nude mouse xenograft studies
Sixteen male BALB/c-nu/nu (aged 4-6 weeks) mice were purchased from the animal laboratory of the Third Xiangya Hospital, Central South University. To explore the role of Klotho in melanoma cells, xenograft tumors were grown in nude mice. The shKlotho or scrambled control-shRNA transfected A375 cells (2×10⁶) were injected subcutaneously in the ventral trunk of mice. Nude mice were sacrificed at 42 days after tumor implantation. Tumor volume, weight, and the survival rates of mice were measured. The experimental procedures were approved by the Ethics Committee of the Faculty of Experimental Animals, Central South University.
Statistic analysis
Statistical analysis was performed using SPSS13.0 statistical software. The count data were analyzed using χ2 test, while the measurement data were analyzed using independent sample t-test. The comparison of count data for multiple samples was performed using rows × columns χ2 test. Spearman rank correlation analysis was used to detect the relationship between p-NF-κB and Klotho protein expression. Survival was analyzed by Kaplan-Meier method and the Log-rank test. Multivariate survival analysis was performed using the Cox multivariate analysis model. *P<0.05 was considered statistically significant.
ACKNOWLEDGMENTS
This study was supported byNational Natural Science Foundation of China (81572689, 81372140, 81301688, 81272192), Ph.D. Programs Foundation of Ministry of Education of China (20130162110050, 20130162120093), Natural Science Foundation of Hunan Province (13JJ4028), and Project of the Department of Science and Technology of Hunan Province (2013FJ6003).
CONFLICTS OF INTEREST
All authors declared no conflict of interest.
REFERENCES
1. Dahlke E, Murray CA, Kitchen J, Chan AW. Systematic review of melanoma incidence and prognosis in solid organ transplant recipients. Transplant. Res. 2014; 3: 10.
2. Russo A, Ficili B, Candido S, Pezzino FM, Guarneri C, Biondi A, Travali S, McCubrey JA, Spandidos DA, Libra M. Emerging targeted therapies for melanoma treatment (review). Int J Oncol. 2014; 45: 516-524.
3. Elinav E, Nowarski R, Thaiss CA, Hu B, Jin C, Flavell RA. Inflammation-induced cancer: crosstalk between tumours, immune cells and microorganisms. Nat Rev Cancer. 2013; 13: 759-771.
4. Barham W, Chen L, Tikhomirov O, Onishko H, Gleaves L, Stricker TP, Blackwell TS, Yull FE. Aberrant activation of NF-κB signaling in mammary epithelium leads to abnormal growth and ductal carcinoma in situ. BMC Cancer. 2015; 15: 647.
5. Weng H, Deng Y, Xie Y, Liu H, Gong F. Expression and significance of HMGB1, TLR4 and NF-κB p65 in human epidermal tumors. BMC Cancer. 2013; 13: 311.
6. Scaffidi P, Misteli T, Bianchi ME. Release of chromatin protein HMGB1 by necrotic cells triggers inflammation. Nature. 2002; 418: 191-195.
7. Tabata C, Shibata E, Tabata R, Kanemura S, Mikami K, Nogi Y, Masachika E, Nishizaki T, Nakano T. Serum HMGB1 as a prognostic marker for malignant pleural mesothelioma. BMC Cancer. 2013; 13: 205.
8. Li Q, Li J, Wen T, Zeng W, Peng C, Yan S, Tan J, Yang K, Liu S, Guo A, Zhang C, Su J, Jiang M, et al. Overexpression of HMGB1 in melanoma predicts patient survival and suppression of HMGB1induces cell cycle arrest and senescence in associationwith p21 (Waf1/Cip1) up-regulation via a p53-independent, Sp1-dependent pathway. Oncotarget. 2014; 5: 6387-403. doi: 10.18632/oncotarget.2201.
9. Sims GP, Rowe DC, Rietdijk ST, Herbst R, Coyle AJ. HMGB1 and RAGE in inflammation and cancer. Annu Rev Immunol. 2010; 28: 367-388.
10. Izquierdo MC, Perez-Gomez MV, Sanchez-Niño MD, Sanz AB, Ruiz-Andres O, Poveda J, Moreno JA, Egido J, Ortiz A. Klotho, phosphate and inflammation/ageing in chronic kidney disease. Nephrol Dial Transplant. 2012; 27: iv6-10.
11. Camilli TC, Xu M, O’Connell MP, Chien B, Frank BP, Subaran S, Indig FE, Morin PJ, Hewitt SM, Weeraratna AT. Loss of Klotho during melanoma progression leads to increased filamin cleavage, increased Wnt5A expression, and enhanced melanoma cell motility. Pigment Cell Melanoma Res. 2011; 24: 175-186.
12. Liu B, Sun L, Liu Q, Gong C, Yao Y, Lv X, Lin L, Yao H, Su F, Li D, Zeng M, Song E. A cytoplasmic NF-κB interacting long noncoding RNA blocks IκB phosphorylation and suppresses breast cancer metastasis. Cancer Cell. 2015; 27: 370-381.
13. Yang YI, Ahn JH, Lee KT, Shih IeM, Choi JH. RSF1 is a positive regulator of NF-κB-induced gene expression required for ovarian cancer chemoresistance. Cancer Res. 2014; 74: 2258-2269.
14. Díaz-Delfín J, Hondares E, Iglesias R, Giralt M, Caelles C, Villarroya F. TNF-α represses β-Klotho expression and impairs FGF21 action in adipose cells: involvement of JNK1 in the FGF21 pathway. Endocrinology. 2012; 153: 4238-4245.
15. Xie B, Zhou J, Shu G, Liu DC, Zhou J, Chen J, Yuan L. Restoration of Klotho gene expression induces apoptosis and autophagy in gastric cancer cells: tumor suppressive role of Klotho in gastric cancer. Cancer Cell Int. 2013; 13: 18.
16. Shu G, Xie B, Ren F, Liu DC, Zhou J, Li Q, Chen J, Yuan L, Zhou J. Restoration of Klotho expression induces apoptosis and autophagy in hepatocellular carcinoma cells. Cell Oncol (Dordr). 2013; 36: 121-129.
17. Zhou J, Liu R, Luo C, Zhou X, Xia K, Chen X, Zhou M, Zou Q, Cao P, Cao K. MiR-20a inhibits cutaneous squamous cell carcinoma metastasis and proliferation by directly targeting LIMK1. Cancer Biol Ther. 2014; 15: 1340-1349.