
INTRODUCTION
Identification of reliable and specific cancer biomarkers, which would help to diagnose, classify and predict disease outcome is still a challenging task. This is particularly true for malignant melanoma (MM), because only a small quantity of tissue is available at the time of diagnosis. Routinely, melanoma are classified using histological parameters such as tumor thickness and ulceration, serum levels of lactate dehydrogenase (LDH) or staining intensity for S100B protein [1].
During melanoma growth and progression in the adult, developmental genes important for melanocyte differentiation are re-activated. Identification of more of these genes in an adequate in vivo experiment might uncover novel melanoma markers. During zebrafish fin regeneration after amputation, melanocyte precursor cells give rise to pigment-producing cells in the new blastema tissue, thereby mimicking the process of melanocyte differentiation in a short time frame [2]. Using microrarrays we compared normal fin tissue to regenerating blastema after amputation and investigated upregulated genes in the Oncomine cancer database [3] to identify those increased in melanoma. Interestingly, we found that 40% of the blastema-upregulated genes are also overexpressed in melanoma. These include known melanoma-promoting proteins such as fibronectin and tenascin C [4, 5], but also novel promising candidates such as BAMBI, a negative regulator of TGF-beta signaling [6]. The role of MARCKS in cell motility during melanoma progression is poorly understood [7]. FK506-binding proteins bind to immunosuppressive drugs such as Tacrolimus (FK506), which is used to treat patients after organ transplantation. Members of this family have been shown to be promising new targets in anticancer therapy [8]. FK506 family member FKBP51 promotes melanoma metastasis in vivo [9] but nothing is known about the role of FKBP7, 10 and 11 in melanoma growth. Data provided in this paper also show that high expression of FKBP7 is associated with poor survival.
We further studied overexpression at the protein level of these candidates in melanoma lesions. No or very low expression was observed in control skin. Additional co-expression studies with defined gene signatures using Oncomine suggest an association of BAMBI and FKBP10 with the angiogenic process in melanoma and with regeneration after HRAS induced cell transformation, respectively. Taken together, our results suggest that some of the genes induced in physiological regeneration hold the potential to play roles in melanoma malignancy and warrant further functional in vitro and in vivo studies.
RESULTS
Microarray and oncomine expression data
To find genes strongly induced in regenerating blastema we applied a stringent 4-fold-change cut off to significantly regulated genes in our microarray experiments (Figure 1). 54 genes detected by 71 probes fulfilled this criterion (Table 1). Since melanocyte differentiation takes place during blastema development and genes participating in this process are deregulated in MM initiation and progression (reviewed in [2]), we determined expression levels of our regeneration genes in public available datasets of melanoma transcriptome studies using Oncomine. 40 percent of the regeneration genes were overexpressed in melanoma, either compared to normal skin (12/54, Figure 2A) or compared to other cancers (10/54; Table 1).
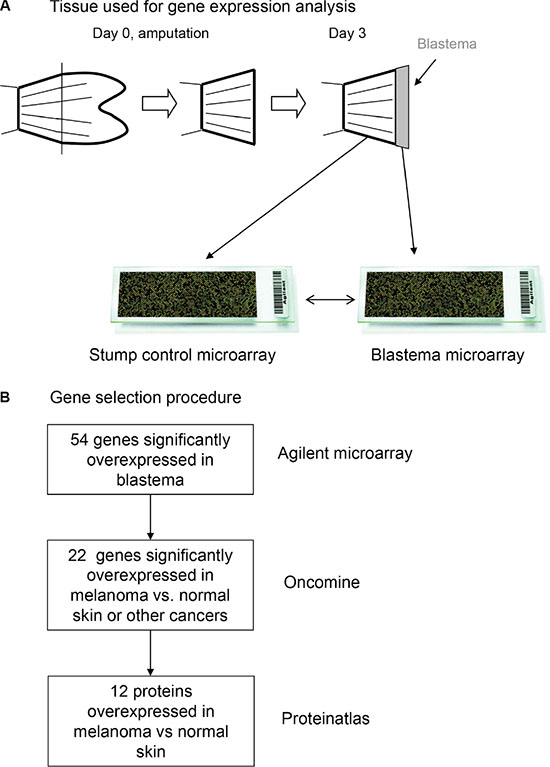
Figure 1: (A) Regenerating zebrafish tissue used for gene expression analysis. (B) Gene selection pipeline leading to the identification of novel melanoma overexpressed genes.
Table 1: Fifty-four genes (detected by 71 probes) were significantly overexpressed at least 4-fold in regenerating blastema compared to normal fins
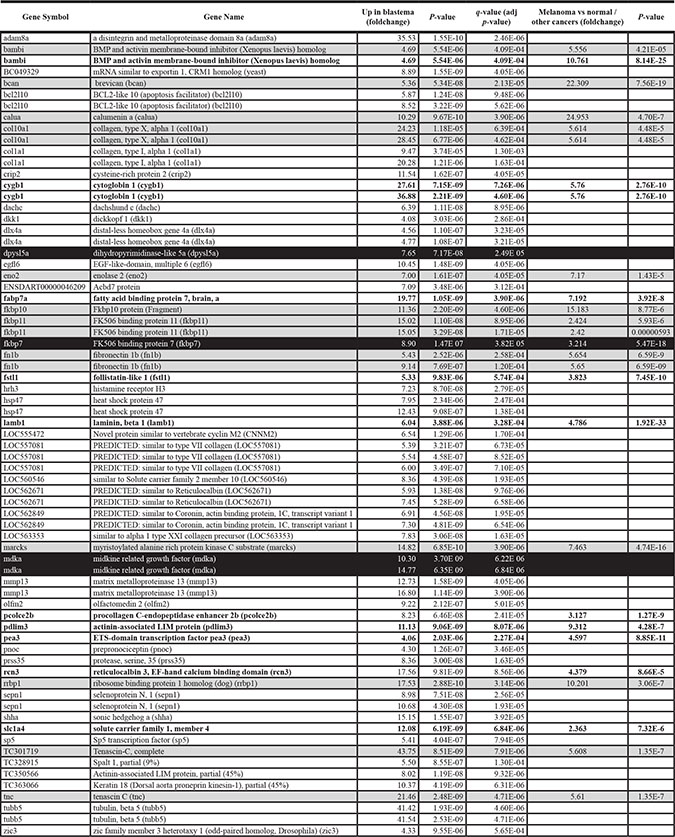
Genes are in alphabetical order.
 over expressed in melanoma vs normal.
Bold over expressed in melanoma vs other cancers.
 Gene is associated with poor survival see (Figure 6).
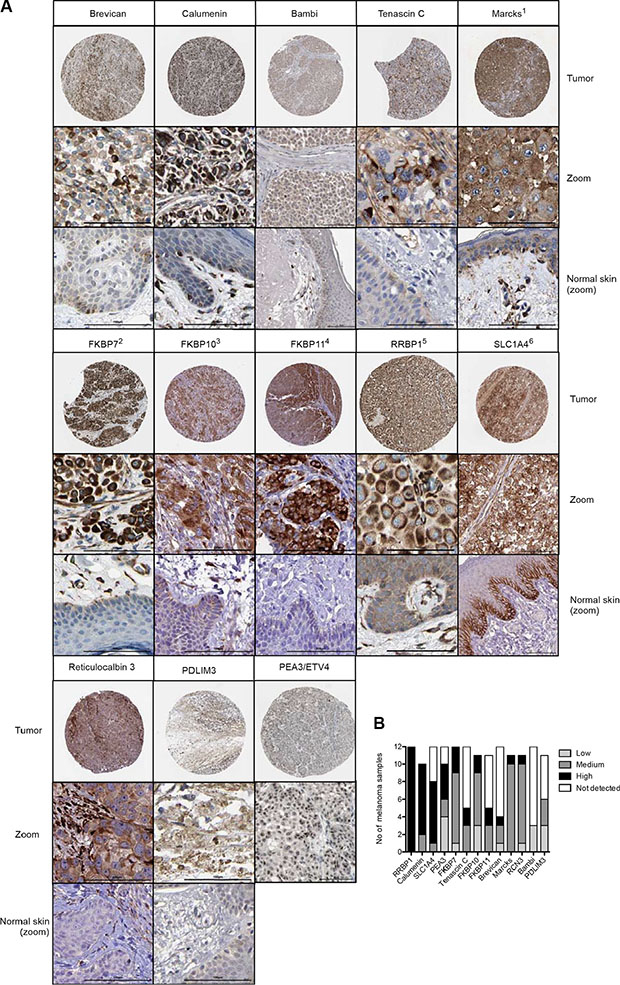
Figure 2: (A) Gene products for melanoma overexpressed genes were screened for staining in patient melanoma using the Protein Atlas database. The circle for each protein shows the overview of the stained tumor tissue, the square directly below a magnification of a representative region of the tumor (zoom, bar = 100 μm), and the square below a magnified section of normal skin (bars = 100 μm). 1: myristoylated alanine-rich protein kinase C substrate, 2: FK506 binding protein 7, 3: FK506 binding protein 10, 65 kDa, 4: FK506 binding protein 11, 19 kDa, 5: ribosome binding protein 1, 6: solute carrier family 1 (glutamate/neutral amino acid transporter), member 4. (B) Summary of staining intensities for indicated proteins were inferred from Protein Atlas data.
Protein expression in melanoma and normal skin
Protein location, staining intensity and quantity of tumor cells stained (in percent) was inferred from the Protein Atlas database. Protein localization was found to be cytoplasmic or membranous for all, except for BCAN where in addition nuclear staining was observed and for PEA3/ETV4 were exclusive nuclear staining was found (Figure 2A). Staining intensities for proteins were summarized in Figure 2B.
Oncomine heatmaps: BAMBI and FKBP10
BAMBI expression (5.556-fold up in melanoma vs normal skin and 10.7-fold vs other cancers) has not been previously associated with melanoma. We compared BAMBI expression in a panel of 19 different tumor cell types, and found overexpression most prominent in melanoma cell lines (n = 41; Figure 3A). Moreover, when associating a given gene expression pattern with a predefined expression signature of a biological theme such as angiogenesis, five genes with known implication in this process were also upregulated more than 1.5-fold (P < 0.001) and co-expressed with BAMBI. These genes were NRP2, ANGPTL1, RHOB, IL8 and KDR (Figure 3A). BAMBI is also expressed in capillaries in developing mouse embryos, as revealed by in situ hybridization (Figure 3B). These data suggest an implication of BAMBI expression in melanoma angiogenesis. When compared to other types of skin cancer such as basal cell carcinoma or squamous cell carcinoma, BAMBI showed selective overexpression in melanoma and strong co-expression (0.815) with the established melanoma gene EDNRB, but also with HEY1 (0.759), a gene important for vascular development (Figure 4).
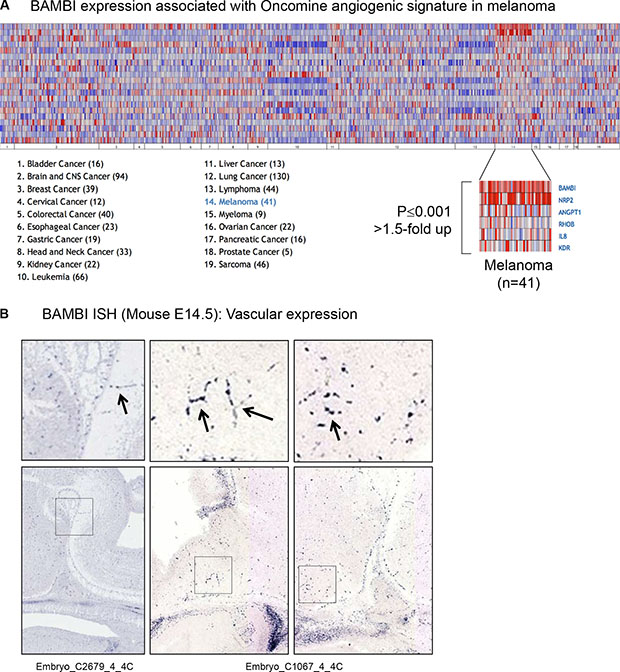
Figure 3: Five genes of the Oncomine angiogenesis gene signature were co-regulated with Bambi transcripts in melanoma compared to other cancers (> 1.5-fold-change, p < 0.001). NRP2, ANGPT1, RHOB, IL8 and KDR. (B) In situ hybridization of BAMBI mRNA in 14.5 days old mouse embryos shows expression in capillaries of the brain (arrows, magnifications of the square in the lower images).
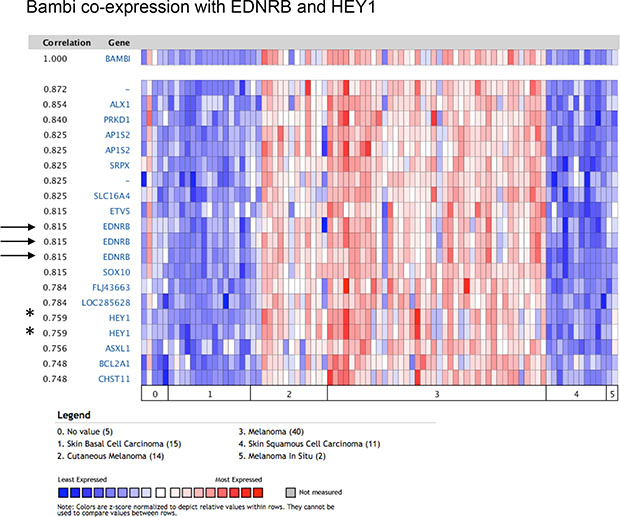
Figure 4: BAMBI expression in melanoma strongly correlates with EDNRB, encoding for endothelin receptor type B (arrows), an established gene implicated in melanocyte induction and melanoma progression. Note also strong correlation with HEY1 (asterisk), a gene important for embryonic angiogenesis.
Other regeneration genes overexpressed in melanoma encode for FKBP proteins (FK506-binding proteins). FKBP7, FKBP11 and FKBP10, upregulated 3.21, 2.42 and 15.18-fold, respectively, have not yet been described in skin cancer. We focused on FKBP10 because of its strong expression in melanoma (up 15.18-fold, Table 1). In a co-expression analysis across epithelial cell lines transfected with different oncogenes, FKBP10 was exclusively associated with HRAS transfection (Figure 5). Mice with aberrant HRAS activity develop melanoma [10]. Interestingly, when an additional selection criterion was added (Oncomine regeneration gene signature), expression of a number of important genes belonging to chemokine families (CXCL5, CXCL2, CXCL3), proteases (MMP10, MMP1, MMP14) as well as angiogenic genes (VEGF, ANGPTL4) was very strongly correlated with FKBP10 expression (0.822). These data suggest that expression of FKBP10 protein might play a role in tissue regeneration, angiogenesis and, as other regeneration genes, in melanoma progression.
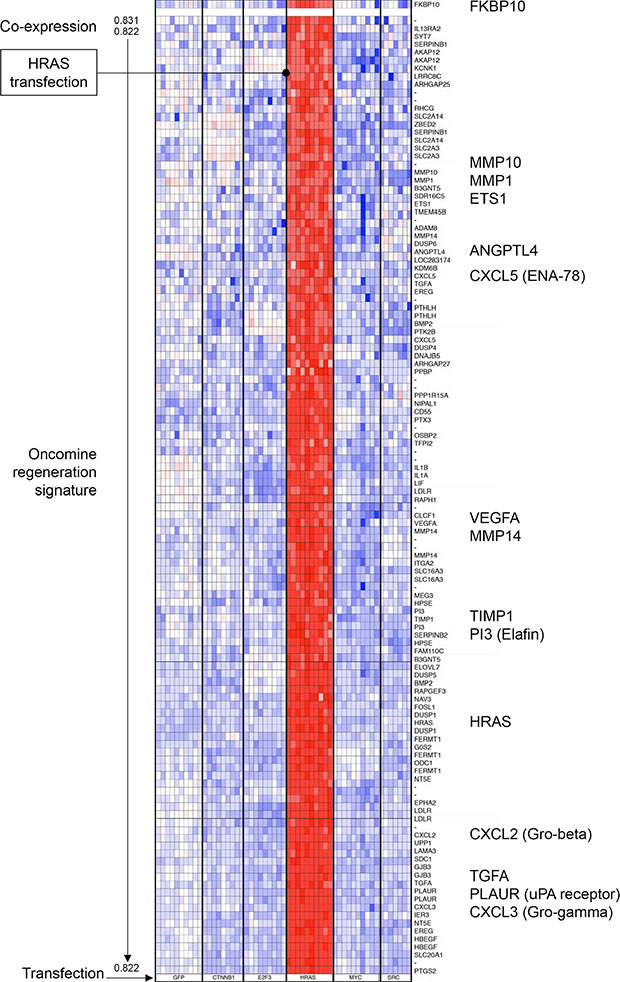
Figure 5: Cluster analysis of the Oncomine regeneration gene signature co-expressed with FKBP10 gene in transfected human epithelial cells. Transfected genes are indicated at the bottom. FKBP10 is selectively induced in HRAS-transfected cells and important known regeneration and angiogenic genes such as MMPs, VEGF and CXCL chemokines are significantly co-expressed with FKBP10.
High expression of FKBP7, DPYSL5 and MDK is associated with poor patient survival
We performed TCGA patient survival analysis integrating all 54 regeneration genes expression. We compared the survival of patients with the highest expression for each gene (75th percentile) with the remaining patients (normal expression). For three genes DPYSL5, FKBP7 and MDK we observed significant differences in survival between the two groups (Figure 6). We observed a similar difference in survival for MCM4 gene, previously reported as a prognostic marker in melanoma [11]. These data suggest that high expression of DPYSL5, FKBP7 and MDK can be novel potential prognostic marker for melanoma.
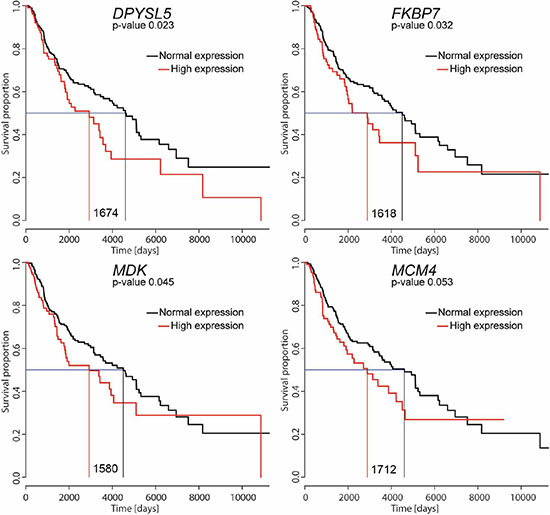
Figure 6: Survival curves of patients with skin cutaneous melanoma. For each gene, the red curve represents mortality in patients with a high expression of given gene (expression values above the 75th percentile). The black line represents survival in the remaining patients with lower gene expression levels (0–75th percentile). P-values and the median survival for each group are indicated as well as difference in survival (number of days). Note that the P-value for the described MM survival gene MCM4 is very close to significance in the TCGA dataset used for this study.
DISCUSSION
In this paper, we used an in silico approach to identify novel genes implicated in cancer. Other computational approaches have recently been developed to model associations of gene networks, metabolic pathways and response to treatment [12]. To evaluate the biological significance of our regeneration data, we compared expression of the most regulated genes to a pathological context. We focused on melanoma, because of strong relationships between melanocyte differentiation during blastema formation and deregulation of melanocyte differentiation program during melanoma progression [2]. Importantly, two genes encoding for known melanoma-promoting proteins were present in our list, such as the extracellular matrix proteins tenascin C (up 5.608-fold) [4] and fibronectin (up 5.654-fold) [13], suggesting that yet unexplored genes participating in blastema regeneration may also have a role in melanoma formation.
The role of BAMBI in melanoma progression has yet to be established. Its expression is inversely correlated with the metastatic potential of melanoma [14]. Oncomine data show that it is expressed by most melanoma cell lines (Figures 3A, 4), but also by capillaries and endothelial cells [15] where it negatively regulates angiogenesis [16]. It might therefore be that BAMBI controls excessive tumor angiogenesis thereby allowing a more efficacious vascularization, similarly to previously described pro- and anti-angiogenic regulators in tumors [17]. Interestingly, Bambi is co-expressed with a well-known melanoma-associated gene, EDNRB, important for angiogenesis [2] (Figure 4) suggesting that BAMBI is a part of a network of genes regulating vascular growth in melanoma. This idea is further supported by co-expression BAMBI with HEY1, a downstream effector of Notch signaling important for developmental angiogenesis [18] (Figure 4). Interestingly, Bambi expression in melanoma is regulated by connective tissue growth factor (CTGF) since siRNA-mediated knock-down of CTGF reduces Bambi expression in melanoma cell lines [19]. Evidence for BAMBI implication in melanoma comes mainly from transcript overexpression since protein levels are low (Figure 2B). This may be explained by a rapid degradation of BAMBI protein by lysosomal and autolysosomal mechanisms [15]. BAMBI has been found to be part of a gene signature overexpressed in multiple myeloma and pluripotent stem cells [20]. Melanoma stem cells are thought to drive metastasis and tumor progression [21]. It is tempting to speculate that BAMBI participates in melanoma progression via influencing stem cell differentiation or participating in leukocyte mimicry of circulating melanoma cells.
FK506-binding proteins are increasingly discussed as a novel anti-cancer targets [8]. FKBP10 play an important role in human tissue homeostasis because mutations in this gene cause a severe form of osteogenesis imperfecta [22]. Our data suggest that FKBP10 could be a potential target in melanoma treatment, since HRAS specifically induces FKBP10 expression (Figure 5). HRAS overexpression causes melanoma in mice [10] and melanocyte-specific expression of oncogenic HRAS has been shown to induce melanoma in zebrafish [23]. HRAS also has an established role in angiogenesis [24].
Other genes whose protein products have evidence of function in cancer include RCN3, RRBP1, PDLIM3 and SLC1A4. Nothing is known about reticulocalbin (RCN3), the protein with highest melanoma expression in the Protein Atlas, but recently, RCN1, a paralog of RCN3, has been found to be a promising tumor marker for renal cell carcinoma [25]. RRBP1 is overexpressed in lung cancer and promotes tumor cell survival [26]. Functions of PDLMI3 in melanoma development can only be speculated; in the adult, the protein is expressed in muscle and plays a role in disorders such as myotonic dystrophy type 1 (DM1) [27] and SLC1A4 has been shown to be induced by the transcription factor MITF in the melanoma cell line SK-MEL-28 [28]. Nuclear expression of PEA3/ETV4 in melanoma may be directly linked to activation of a pro-metastatic program through activation of FAK (Focal adhesion kinase) genes [29].
We identified three genes overexpressed in regenerating blastema that are predictors of poor survival in melanoma patients. As a positive control, we included MCM4, which has been shown to be a poor melanoma survival gene in an independent study [11]. Midkine, a heparin-binding multifunctional growth-promoting protein is overexpressed in various solid tumours and high expression has been shown to be associated with poor survival in breast and lung cancer [30, 31]. The role of midkine in melanoma pathogenesis has not yet been investigated. It is expressed in keratinocytes, not melanoma cells, but recombinant midkine stimulates cell proliferation [32]. It might therefore act as a paracrine growth factor for malignant melanoma cells.
Interestingly, DPSYL5 (also known as CRMP5), a gene which controls brain development, has been shown to promote glioblastoma cell growth and is a potent prognostic factor for this disease, with high expression predicting dismal prognosis [33]. Since melanocytes and glial cells are derived from neural crest precursor cells and share responsiveness to differentiation factors [34], it is possible that the poor prognosis associated with DPSYL5 in melanoma is due to the common developmental origin with glial cells.
FKBP7 is upregulated in melanoma compared to other cancers (Table 1). In the paper by Crijns et al., FKBP7 is described as one of 86 genes associated with low survival in ovarian cancer patients [35]. This is of interest, since proteins of the FKBP family can be targeted by chemical compounds such as rapamycin and its derivatives and constitute therefore promising potential targets for anti-cancer treatment.
Taken together, our data show that genes expressed in a highly controllable system, the zebrafish fin regeneration, recapitulate expression patterns observed in severe human pathologies such as melanoma. Several of the genes and proteins presented here are overexpressed in melanoma and warrant further validation as potential novel melanoma markers or therapeutic targets.
MATERIALS AND METHODS
Zebrafish fin amputation and regeneration
Wild-type zebrafish (Danio rerio) were purchased from the ZIRC fish center (University of Oregon, USA), and kept in an aquatic holding facility in INSERM zebrafish facilities under standard conditions. Fish housing and handling was performed as described [36]. In brief, fish were stored in tanks for at least 3 weeks before experimentation. The photoperiod was 10-h dark/14-h light cycle and water temperature was maintained at 28 ± 1°C throughout holding and during experiments. Ethical approval for all animal studies was obtained from the institutional animal care and use committee of the INSERM in accordance with the national advisory committee for laboratory animal research guidelines licensed by French authority. For zebrafish fin regeneration assay, adult fish of at least 10 weeks were anesthetized by addition of 0.6 mM tricaine (ethyl-m-aminobenzoate) to water. Caudal fins were amputated at a level proximal to first bifurcation of the bony rays using a scalpel (Figure 1A). After three days, blastema and control fin tissues were harvested and processed for microarrays [37].
Blastema microarray analysis and statistics
Gene expression of regenerating blastema vs. control fins was analysed by Agilent Zebrafish Oligo Microarray V2 4 × 44K (ref. G2519F) using standard protocols [37]. Overall gene selection procedure is illustrated in Figure 1B. Total RNA was extracted from stump control and regenerated fins using the NucleoSpin® RNA II kit (Macherey-Nagel, Germany), according to the manufacturer’s instructions. Purity of RNA samples was evaluated and RNA integrity was controlled on a Bioanalyzer 2100 (Agilent Technologies, USA). Target preparation and hybridization were done according to the manufacturer’s instructions. Internal standards were derived from the Two-Color RNA Spike-in Kit (Agilent Technologies, USA). The labeled targets were purified using the RNeasy® Mini Kit (Qiagen) and 825 ng of Cy3- and Cy5-labeled cRNA targets were mixed and incubated on the microarray slides in a rotating oven, at 65°C for 17 hours. Biological samples from three blastema and four normal fin controls (Cy3) were hybridized against a common reference control (Cy5). After washing, slides were scanned using a microarray scanner (Agilent Technologies, USA) at 5-μm resolution and at high and low photomultiplier voltages to optimize the dynamic range of image quantification. The data were extracted from these images using the Agilent Feature Extraction v.9.5.3 software. Data were analyzed with limma R/Bioconductor package [38]. Arrays were background corrected using minimum method and a “within-array” loess normalization was performed [39]. Finally, array data were normalized using quantile normalization. We applied the linear modeling approach implemented by lmFit and the empirical Bayes statistics implemented by eBayes to find genes deregulated in blastema as compared to normal fin. Results were considered statistically significant at q-values ≤ 0.05 and fold-change ≥ 4. Microarray data sets have been deposited at NCBI’s Gene Expression Omnibus (GEO series accession number GSE58567).
Protein expression in melanoma and normal skin
The Protein Atlas database (www.proteinatlas.org) [40] was used to retrieve immunhistochemical expression data of melanoma and normal skin.
Below is a table of the patients/antibodies used together with accompanying histological data.
For skin control histology, sections stained by the following antibodies (Protein Atlas abbreviations) were selected: Brevican: HPA007865; Calumenin: HPA006018; Tenascin C: HPA004823; Marcks: CAB022062; FKBP7: HPA008707; FKBP10: HPA051171; FKBP11: HPA041709; S100B: HPA015768; SLC1A4: CAB002757; Reticulocalbin 3: HPA043134; PDZ And LIM Domain Protein 3: HPA004749; RRBP1: HPA009026. Bambi: HPA10866. No useful normal skin data were found for PEA3/ETV4.
Oncomine gene expression analysis
To focus on genes, which were consistently upregulated in regenerating blastema, we applied a cut-off value of 4. We then used Oncomine™ version 3 and 4.2 (Compendia Bioscience, Ann Arbor, MI, USA [3]) for analysis and visualization of expression data. These data were obtained from the Riker_Melanoma study (n = 4 controls; 14 melanoma patients) or the Talantov_Melanoma study (n = 7 controls; 45 melanoma patients). The following parameters were included in the search (primary filters): Gene name; Analysis Type: Cancer vs. Normal Analysis and Cancer Type: Melanoma. Expression data of regeneration genes in melanoma compared to othercancers were obtained from the Barrettina_CellLine study (57 melanoma samples vs. 17 other types of cancer), Wagner_CellLine study (18 melanoma samples vs. 3 other cancers), Scherf_CellLine (10 melanoma samples vs. 10 other cancers) and Shankavaram_CellLine 2 study (10 melanoma samples vs. 10 other cancers). The Riker_melanoma study was also used to find genes co-expressed with BAMBI.
For concept gene signature studies, we used the following search criteria: Gene: BAMBI; Concept: angiogenesis – GO Biological process; Cancer type: melanoma; Concept type: Overexpression. The Garnett_Cellline study was retained for Cluster analysis. For the second concept study we used: Gene name: FKBP10; Concept: tissue regeneration – GO Biological process; Analysis type: Co-expression analysis. The Bild_Celline study was retained and group by perturbation was selected (Human Mammary Epithelial Cells Primary Culture). Details on the statistical methods underlying Oncomine have been detailed elsewhere [41].
In silico in situ hybridization
For in situ hybridization of Bambi expression, we used the GenePaint database [42], which provides access to high quality in situ hybridization images of sections of E14.5 mouse embryos. Capillary expression of BAMBI was demonstrated in the brain.
Survival analysis of TCGA patients integrating gene expression
Clinical data and RNAseq gene expression for 472 skin cutaneous melanoma samples from the Cancer Genome Atlas (TCGA) were downloaded using FireBrowse (http://gdac.broadinstitute.org/) and normalized with voom from the limma package. Survival of patients with gene expression above the 75th percentile (classified as high expression) was compared to the remaining patients (normal expression) using the package survival in R (http://www.R-project.org/).
Protein |
Antibody ID* |
Patient |
Diagnosis |
Patient id |
|---|---|---|---|---|
FKBP7 |
HPA008707 |
M, age 41 |
MM**, Metastatic site (M-87206) |
2112 |
FKBP10 |
HPA051171 |
F, age 91 |
MM, NOS (M-87203) |
3887 |
FKBP11 |
HPA041709 |
F, age 52 |
MM, NOS (M-87203) |
4018 |
TNC |
HPA004823 |
M, age 53 |
MM, NOS (M-87203) |
2534 |
MARCKS |
CAB022062 |
F, age 81 |
MM, NOS (M-87203) |
3210 |
BAMBI |
HPA10866 |
M, age 41 |
MM, Metastatic site (M-87206) |
2112 |
BCAN |
HPA007865 |
F, age 30 |
MM, Metastatic site (M-87206), Pancreas (T-59000) |
2598 |
PDLIM3 |
HPA004749 |
M, age 59 |
MM, Metastatic site (M-87206), Lymph node (T-08000) |
1414 |
RCN3 |
HPA043134 |
M, age 84 |
MM, NOS (M-87203) |
4028 |
SLC1A4 |
HPA034964 |
F, age 64 |
MM, NOS (M-87203) |
4026 |
CALUA |
HPA006018 |
F, age 56 |
MM, Metastatic site (M-87206), Skin (T-01000) |
1220 |
RRBP1 |
HPA009026 |
F, age 81 |
MM, NOS (M-87203) |
3210 |
PEA3/ETV4 |
HPA005768 |
F, age 46 |
MM, NOS (M-87203) |
3223 |
ACKNOWLEDGMENTS
This work was supported by grants from INCA, La Ligue Contre le Cancer and the Region Aquitaine. The survival results shown in this paper are in part based upon data generated by the TCGA Research Network: http://cancergenome.nih.gov/. KBH was supported by a grant from the French National Cancer Institute (INCa_TRANSLA_2013_209).
CONFLICTS OF INTEREST
The authors declare no conflicts of interest.
Authors’ contributions
GS performed zebrafish experiments, MK and KBH analyzed microarray data, KBH performed survival analysis, MH performed Oncomine, Protein Atlas and GenePaint in silico analysis and wrote the paper.
REFERENCES
1. Gogas H, Eggermont AM, Hauschild A, Hersey P, Mohr P, Schadendorf D, Spatz A, Dummer R. Biomarkers in melanoma. Ann Oncol. 2009; 20:vi8–13. doi: 10.1093/annonc/mdp251.
2. White RM, Zon LI. Melanocytes in development, regeneration, and cancer. Cell Stem Cell. 2008; 3:242–52. doi: 10.1016/j.stem.2008.08.005.
3. Rhodes DR, Yu J, Shanker K, Deshpande N, Varambally R, Ghosh D, Barrette T, Pandey A, Chinnaiyan AM. ONCOMINE: a cancer microarray database and integrated data-mining platform. Neoplasia. 2004; 6:1–6. doi:
4. Fukunaga-Kalabis M, Martinez G, Nguyen TK, Kim D, Santiago-Walker A, Roesch A, Herlyn M. Tenascin-C promotes melanoma progression by maintaining the ABCB5-positive side population. Oncogene. 2010; 29:6115–24. doi: 10.1038/onc.2010.350.
5. Kaariainen E, Nummela P, Soikkeli J, Yin M, Lukk M, Jahkola T, Virolainen S, Ora A, Ukkonen E, Saksela O, Holtta E. Switch to an invasive growth phase in melanoma is associated with tenascin-C, fibronectin, and procollagen-I forming specific channel structures for invasion. J Pathol. 2006; 210:181–91. doi: 10.1002/path.2045.
6. Onichtchouk D, Chen YG, Dosch R, Gawantka V, Delius H, Massague J, Niehrs C. Silencing of TGF-beta signalling by the pseudoreceptor BAMBI. Nature. 1999; 401:480–5. doi: 10.1038/46794.
7. Estrada-Bernal A, Gatlin JC, Sunpaweravong S, Pfenninger KH. Dynamic adhesions and MARCKS in melanoma cells. J Cell Sci. 2009; 122:2300–10. doi: 10.1242/jcs.047860.
8. Romano S, Di Pace A, Sorrentino A, Bisogni R, Sivero L, Romano MF. FK506 binding proteins as targets in anticancer therapy. Anticancer Agents Med Chem. 2010; 10:651–6. doi:
9. Romano S, Staibano S, Greco A, Brunetti A, Nappo G, Ilardi G, Martinelli R, Sorrentino A, Di Pace A, Mascolo M, Bisogni R, Scalvenzi M, Alfano B, et al. FK506 binding protein 51 positively regulates melanoma stemness and metastatic potential. Cell Death Dis. 2013; 4:e578. doi: 10.1038/cddis.2013.109.
10. Chin L, Tam A, Pomerantz J, Wong M, Holash J, Bardeesy N, Shen Q, O’Hagan R, Pantginis J, Zhou H, Horner JW, 2nd, Cordon-Cardo C, et al. Essential role for oncogenic Ras in tumour maintenance. Nature. 1999; 400:468–72. doi: 10.1038/22788.
11. Winnepenninckx V, Lazar V, Michiels S, Dessen P, Stas M, Alonso SR, Avril MF, Ortiz Romero PL, Robert T, Balacescu O, Eggermont AM, Lenoir G, Sarasin A, et al. Gene expression profiling of primary cutaneous melanoma and clinical outcome. J Natl Cancer Inst. 2006; 98:472–82. doi: 10.1093/jnci/djj103.
12. Pappalardo F, Russo G, Candido S, Pennisi M, Cavalieri S, Motta S, McCubrey JA, Nicoletti F, Libra M. Computational Modeling of PI3K/AKT and MAPK Signaling Pathways in Melanoma Cancer. PLoS One. 2016; 11:e0152104. doi: 10.1371/journal.pone.0152104.
13. Ruoslahti E. The Walter Herbert Lecture. Control of cell motility and tumour invasion by extracellular matrix interactions. Br J Cancer. 1992; 66:239–42. doi:
14. Degen WG, Weterman MA, van Groningen JJ, Cornelissen IM, Lemmers JP, Agterbos MA, Geurts van Kessel A, Swart GW, Bloemers HP. Expression of nma, a novel gene, inversely correlates with the metastatic potential of human melanoma cell lines and xenografts. Int J Cancer. 1996; 65:460–5. doi: 10.1002/(SICI)1097-0215(19960208)65:4<460::AID-IJC12>3.0.CO;2-E.
15. Xavier S, Gilbert V, Rastaldi MP, Krick S, Kollins D, Reddy A, Bottinger E, Cohen CD, Schlondorff D. BAMBI is expressed in endothelial cells and is regulated by lysosomal/autolysosomal degradation. PLoS One. 2010; 5:e12995. doi: 10.1371/journal.pone.0012995.
16. Guillot N, Kollins D, Gilbert V, Xavier S, Chen J, Gentle M, Reddy A, Bottinger E, Jiang R, Rastaldi MP, Corbelli A, Schlondorff D. BAMBI regulates angiogenesis and endothelial homeostasis through modulation of alternative TGFbeta signaling. PLoS One. 2012; 7:e39406. doi: 10.1371/journal.pone.0039406.
17. Dumartin L, Quemener C, Laklai H, Herbert J, Bicknell R, Bousquet C, Pyronnet S, Castronovo V, Schilling MK, Bikfalvi A, Hagedorn M. Netrin-1 mediates early events in pancreatic adenocarcinoma progression, acting on tumor and endothelial cells. Gastroenterology. 2010; 138:1595–606, 606 e1–8. doi: S0016-5085(10)00025-9 [pii] 10.1053/j.gastro.2009.12.061.
18. Fischer A, Schumacher N, Maier M, Sendtner M, Gessler M. The Notch target genes Hey1 and Hey2 are required for embryonic vascular development. Genes Dev. 2004; 18:901–11. doi: 10.1101/gad.291004.
19. Braig S, Wallner S, Junglas B, Fuchshofer R, Bosserhoff AK. CTGF is overexpressed in malignant melanoma and promotes cell invasion and migration. Br J Cancer. 2011; 105:231–8. doi: 10.1038/bjc.2011.226.
20. Kassambara A, Hose D, Moreaux J, Reme T, Torrent J, Rossi JF, Goldschmidt H, Klein B. Identification of pluripotent and adult stem cell genes unrelated to cell cycle and associated with poor prognosis in multiple myeloma. PLoS One. 2012; 7:e42161. doi: 10.1371/journal.pone.0042161.
21. Lee N, Barthel SR, Schatton T. Melanoma stem cells and metastasis: mimicking hematopoietic cell trafficking? Lab Invest. 2014; 94:13–30. doi: 10.1038/labinvest.2013.116.
22. Kelley BP, Malfait F, Bonafe L, Baldridge D, Homan E, Symoens S, Willaert A, Elcioglu N, Van Maldergem L, Verellen-Dumoulin C, Gillerot Y, Napierala D, Krakow D, et al. Mutations in FKBP10 cause recessive osteogenesis imperfecta and Bruck syndrome. J Bone Miner Res. 2011; 26:666–72. doi: 10.1002/jbmr.250.
23. Santoriello C, Gennaro E, Anelli V, Distel M, Kelly A, Koster RW, Hurlstone A, Mione M. Kita driven expression of oncogenic HRAS leads to early onset and highly penetrant melanoma in zebrafish. PLoS One. 2010; 5:e15170. doi: 10.1371/journal.pone.0015170.
24. Serban D, Leng J, Cheresh D. H-ras regulates angiogenesis and vascular permeability by activation of distinct downstream effectors. Circ Res. 2008; 102:1350–8. doi: 10.1161/CIRCRESAHA.107.169664.
25. Giribaldi G, Barbero G, Mandili G, Daniele L, Khadjavi A, Notarpietro A, Ulliers D, Prato M, Minero VG, Battaglia A, Allasia M, Bosio A, Sapino A, et al. Proteomic identification of Reticulocalbin 1 as potential tumor marker in renal cell carcinoma. J Proteomics. 2013; 91:385–92. doi: 10.1016/j.jprot.2013.07.018.
26. Telikicherla D, Marimuthu A, Kashyap MK, Ramachandra YL, Mohan S, Roa JC, Maharudraiah J, Pandey A. Overexpression of ribosome binding protein 1 (RRBP1) in breast cancer. Clin Proteomics. 2012; 9:7. doi: 10.1186/1559-0275-9-7.
27. Ohsawa N, Koebis M, Suo S, Nishino I, Ishiura S. Alternative splicing of PDLIM3/ALP, for alpha-actinin-associated LIM protein 3, is aberrant in persons with myotonic dystrophy. Biochem Biophys Res Commun. 2011; 409:64–9. doi: 10.1016/j.bbrc.2011.04.106.
28. Hoek KS, Schlegel NC, Eichhoff OM, Widmer DS, Praetorius C, Einarsson SO, Valgeirsdottir S, Bergsteinsdottir K, Schepsky A, Dummer R, Steingrimsson E. Novel MITF targets identified using a two-step DNA microarray strategy. Pigment Cell Melanoma Res. 2008; 21:665–76. doi: 10.1111/j.1755-148X.2008.00505.x.
29. Li S, Huang X, Zhang D, Huang Q, Pei G, Wang L, Jiang W, Hu Q, Tan R, Hua ZC. Requirement of PEA3 for transcriptional activation of FAK gene in tumor metastasis. PLoS One. 2013; 8:e79336. doi: 10.1371/journal.pone.0079336.
30. Yuan K, Chen Z, Li W, Gao CE, Li G, Guo G, Yang Y, Ai Y, Wu L, Zhang M. MDK Protein Overexpression Correlates with the Malignant Status and Prognosis of Non-small Cell Lung Cancer. Arch Med Res. 2015; 46:635–41. doi: 10.1016/j.arcmed.2015.11.006.
31. Li F, Tian P, Zhang J, Kou C. The clinical and prognostic significance of midkine in breast cancer patients. Tumour Biol. 2015; 36:9789–94. doi: 10.1007/s13277-015-3710-x.
32. Inazumi T, Tajima S, Nishikawa T, Kadomatsu K, Muramatsu H, Muramatsu T. Expression of the retinoid-inducible polypeptide, midkine, in human epidermal keratinocytes. Arch Dermatol Res. 1997; 289:471–5.
33. Moutal A, Honnorat J, Massoma P, Desormeaux P, Bertrand C, Malleval C, Watrin C, Chounlamountri N, Mayeur ME, Besancon R, Naudet N, Magadoux L, Khanna R, et al. CRMP5 Controls Glioblastoma Cell Proliferation and Survival through Notch-Dependent Signaling. Cancer Res. 2015; 75:3519–28. doi: 10.1158/0008-5472.CAN-14-0631.
34. Dupin E, Real C, Glavieux-Pardanaud C, Vaigot P, Le Douarin NM. Reversal of developmental restrictions in neural crest lineages: transition from Schwann cells to glial-melanocytic precursors in vitro. Proc Natl Acad Sci USA. 2003; 100:5229–33. doi: 10.1073/pnas.0831229100.
35. Crijns AP, Fehrmann RS, de Jong S, Gerbens F, Meersma GJ, Klip HG, Hollema H, Hofstra RM, te Meerman GJ, de Vries EG, van der Zee AG. Survival-related profile, pathways, and transcription factors in ovarian cancer. PLoS Med. 2009; 6:e24. doi: 10.1371/journal.pmed.1000024.
36. Eyries M, Siegfried G, Ciumas M, Montagne K, Agrapart M, Lebrin F, Soubrier F. Hypoxia-induced apelin expression regulates endothelial cell proliferation and regenerative angiogenesis. Circ Res. 2008; 103:432–40. doi: 10.1161/CIRCRESAHA.108.179333.
37. Khatib AM, Lahlil R, Hagedorn M, Delomenie C, Christophe O, Denis C, Siegfried G. Biological outcome and mapping of total factor cascades in response to HIF induction during regenerative angiogenesis. Oncotarget. 2016; 7:12102–20. doi: 10.18632/oncotarget.7728.
38. Ritchie ME, Phipson B, Wu D, Hu Y, Law CW, Shi W, Smyth GK. limma powers differential expression analyses for RNA-sequencing and microarray studies. Nucleic Acids Res. 2015; 43:e47. doi: 10.1093/nar/gkv007.
39. Smyth GK, Speed T. Normalization of cDNA microarray data. Methods. 2003; 31:265–73.
40. Uhlen M, Fagerberg L, Hallstrom BM, Lindskog C, Oksvold P, Mardinoglu A, Sivertsson A, Kampf C, Sjostedt E, Asplund A, Olsson I, Edlund K, Lundberg E, et al. Proteomics. Tissue-based map of the human proteome. Science. 2015; 347:1260419. doi: 10.1126/science.1260419.
41. Rhodes DR, Kalyana-Sundaram S, Mahavisno V, Varambally R, Yu J, Briggs BB, Barrette TR, Anstet MJ, Kincead-Beal C, Kulkarni P, Varambally S, Ghosh D, Chinnaiyan AM. Oncomine 3.0: genes, pathways, and networks in a collection of 18,000 cancer gene expression profiles. Neoplasia. 2007; 9:166–80.
42. Visel A, Thaller C, Eichele G. GenePaint.org: an atlas of gene expression patterns in the mouse embryo. Nucleic Acids Res. 2004; 32:D552–6.