
Introduction
T-cell driven cell-mediated immunity, has been the focus of studies investigating host immunity against M.tb infection [1]-[3] and TB disease. However, an increasing number of studies are indicating that the role of B-cells in the protective immunity against M.tb infection has been underestimated. B-cells are the key players during humoral immunity and produce antibodies in response to invading pathogens. Studies found that humoral immunity may enhance protection against M.tb infection [4]-[6]. Furthermore, B-cells have additional functions that may be essential for host protection during infection and disease. Activated B-cells change T-cell behaviour during autoimmune disease and other pathogenic infections by means of cytokine production and antigen-presentation. Effector B-cells can either produce Interferon (IFN)-γ and Interleukin (IL)-12 (Be-1 cells) or IL-2, IL-13 and IL-4 (Be-2 cells) depending on whether the cells are primed by Th1 or Th2 cells, respectively [7], [8]. These cytokine-producing effector B-cells are able to amplify T-cell responses in a cytokine-dependent manner [9], [10].
B-cells also display regulatory phenotypes, which secrete IL-10, IL-35, and express FAS ligand (FasL). Functional studies in EAE indicate that B-cell deficiencies, and a lack of IL10 and IL35 lead to a poor prognosis[11]. B-cells limited EAE pathogenesis by means of IL-35 secretion, which decreased the accumulation of pathogenic cells in the target organ. FasL-expressing B-cells have a similar effect during autoimmune disease. These B-cells induce apoptosis of CD4+ T-cells, have the potential to reduce the inflammatory responses during autoimmune disease and are induced by IL-5 [12]. High levels of FasL expression was observed in B-cells activated via the Toll-Like Receptor (TLR) 9 agonist CpG [13]. We hypothesised that B-cells play a similar role during tuberculosis disease. Transcriptional approaches are useful for the discovery of biomarkers for the diagnosis and measurement of treatment response [14]-[17]. We evaluated patterns in the expression of B-cell genes to better our understanding of B-cell behaviour during M.tb infection and tuberculosis (TB). Real-time PCR was utilised to assess the expression of gene transcripts of cytokines, together with genes involved in B-cell activation and effector functions.
Results
Comparison of gene expression between TB, OLD and Control groups
In order to evaluate the differences in the expression of the 12 specific genes in purified B-cells between healthy controls (Ctrl), TB cases and individuals with other lung diseases (OLD), the delta Ct method was utilised. All analyses were carried out by means of the online software provided by SABiosciences.
The expression of APRIL, BAFF, CD19, IL4, FCGR1A, IL35, IL5RA, TNF and TLR9 was similar between Ctrl and OLD groups (p > 0.05) (Table 2). In contrast, FASLG and CD38 expression was significantly decreased in OLD compared to Ctrl (p < 0.01; Table 2). There were no differences in the expression of all the genes between individuals with other lung diseases and TB cases. When comparing the expression of the genes between healthy controls and TB cases, we found that there was a significant decrease in the expression of IL4, FASLG, IL5RA and CD38 (p < 0.05) (Table 2). The relative gene expression changes between the CTRL, OLD and TB groups are shown in the form of a heat map (Figure 1), which demonstrates differential expression of genes between the control group and the TB group is evident.
Table 1: Clinical and demographic characteristics of study participants
TB |
CTRL |
OLD |
|
No. of Female |
8 |
10 |
5 |
No. of Male |
12 |
0 |
5 |
QuantiFERON status (Dx) |
NA |
POSITIVE |
5 POSITIVE |
5 NEGATIVE |
|||
Sputum-culture status (Dx) |
POSITIVE |
NEGATIVE |
NEGATIVE |
Table 2: Gene expression differences between TB and Control Groups
GENES |
Ctrl versus OLD |
Ctrl versus TB |
OLD versus TB |
|||
Log2 Fold Change |
p-value |
Log2 Fold Change |
p-value |
Log2 Fold Change |
p-value |
|
APRIL |
-2.08 |
p > 0.05 |
-3.03 |
p > 0.05 |
-1.46 |
p > 0.05 |
TLR9 |
-1.60 |
p > 0.05 |
-2.10 |
p > 0.05 |
-1.31 |
p > 0.05 |
IL5RA |
-3.54 |
p > 0.05 |
-8.26 |
p < 0.01 |
-2.33 |
p > 0.05 |
IL4 |
-7.03 |
p > 0.05 |
-10.70 |
p < 0.01 |
-1.52 |
p > 0.05 |
IL35 |
-2.77 |
p > 0.05 |
-3.35 |
p > 0.05 |
-1.21 |
p > 0.05 |
FASLG |
-6.26 |
p < 0.01 |
-5.70 |
p < 0.01 |
1.10 |
p > 0.05 |
FCGR1A |
-1.78 |
p > 0.05 |
1.39 |
p > 0.05 |
2.47 |
p > 0.05 |
BAFF |
-1.71 |
p > 0.05 |
-1.74 |
p > 0.05 |
-1.02 |
p > 0.05 |
TNF |
1.63 |
p < 0.05 |
1.12 |
p > 0.05 |
-1.45 |
p > 0.05 |
CD38 |
-6.06 |
p < 0.01 |
-6.59 |
p < 0.01 |
-1.09 |
p > 0.05 |
CD19 |
1.08 |
p > 0.05 |
-1.03 |
p > 0.05 |
-1.12 |
p > 0.05 |
STAT6 |
-1.57 |
p > 0.05 |
-1.66 |
p > 0.05 |
-1.06 |
p > 0.05 |
The fold change values represent the changes in gene expression between the respective groups, as calculated by SABiosciences online software. Positive values indicate an increase in expression, (negative value indicates a decrease in expression) between groups. Kruskal-Wallis tests were used for comparisons, and a p-value < 0.05 is considered significant and is highlighted in bold.
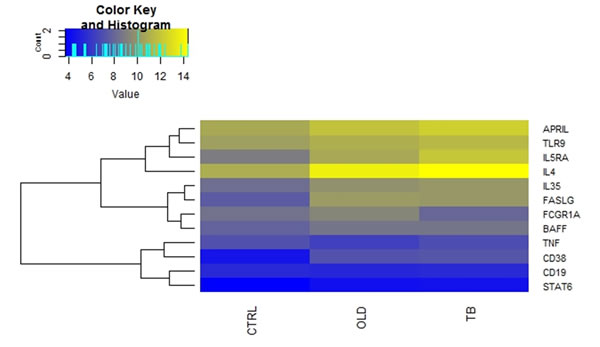
Figure 1: Differences in mRNA expression between TB and Control groups. Comparison of the average gene expression between the respective groups. Where Ctrl are healthy controls, OLD are individuals with other lung diseases and TB are individuals is TB disease. Heatmap, which was generated using R statistical packages, depicting changes in normalized expression values (dCt). Genes with low expression levels are depicted in yellow, whereas genes with high expression levels are depicted in blue.
Differential gene expression during Anti-TB treatment
The expression of specific genes in purified B-cells was compared between diagnosis (before treatment started), month two (the time point frequently used to evaluate sputum culture conversion) and month six (end of treatment) following the initiation of anti-TB treatment. There were no significant differences in the expression of BAFF, CD19, FASLG, IL4, CD38, FCGR1A, IL35, TNF and TLR9 between diagnosis and month 2 of treatment (p > 0.05) (Table 3). However, APRIL and IL5RA were differentially expressed between these two time points with fold changes of 1.85 (p < 0.05) and 1.87 (p < 0.05) respectively (Table 3).
When comparing the expression of the 12 genes between diagnosis and month six of treatment, APRIL, CD19, FASL and IL5RA were differentially expressed (Table 3 and Figure 3). There was an increase in the expression of all the latter genes at month 6. The expression of BAFF, STAT6, IL35, TNF, CD38 and TLR9 was similar at diagnosis and month six of treatment. The relative gene expression is depicted in a heat map for individual samples (Figure 2a) and clustered as groups (Figure 2b).
Table 3: Gene expression in TB group over 6 months of treatment
GENES |
Dx vs M2 |
Dx vs M6 |
M2 vs M6 |
|||
Log2 Fold Change |
p-value |
Log2 Fold Change |
p-value |
Log2 Fold Change |
p-value |
|
APRIL |
1.85 |
p < 0.05 |
2.06 |
p < 0.01 |
1.12 |
p > 0.05 |
IL5RA |
1.87 |
p < 0.05 |
1.96 |
p < 0.05 |
1.05 |
p > 0.05 |
TLR9 |
1.18 |
p > 0.05 |
1.35 |
p > 0.05 |
1.15 |
p > 0.05 |
IL4 |
1.79 |
p > 0.05 |
1.84 |
p > 0.05 |
1.03 |
p > 0.05 |
IL35 |
1.04 |
p > 0.05 |
1.21 |
p > 0.05 |
1.17 |
p > 0.05 |
FASLG |
1.33 |
p > 0.05 |
1.87 |
p < 0.01 |
1.40 |
p > 0.05 |
FCGR1A |
-1.91 |
p > 0.05 |
-2.74 |
p > 0.05 |
-1.43 |
p > 0.05 |
BAFF |
1.13 |
p > 0.05 |
1.00 |
p > 0.05 |
-1.12 |
p > 0.05 |
TNF |
1.10 |
p > 0.05 |
-1.02 |
p > 0.05 |
-1.12 |
p > 0.05 |
CD38 |
1.65 |
p > 0.05 |
1.48 |
p > 0.05 |
1.11 |
p > 0.05 |
CD19 |
1.49 |
p > 0.05 |
1.77 |
p < 0.05 |
1.18 |
p > 0.05 |
STAT6 |
1.08 |
p > 0.05 |
1.21 |
p > 0.05 |
1.12 |
p > 0.05 |
The fold change values represent the changes in gene expression between the respective groups, as calculated by SABiosciences online software. Positive values indicate an increase in expression, whereas a negative value indicates a decrease in expression. Kruskal Wallis tests were used for comparisons, and a p-value ≤ 0.05 is considered significant and is highlighted in bold.
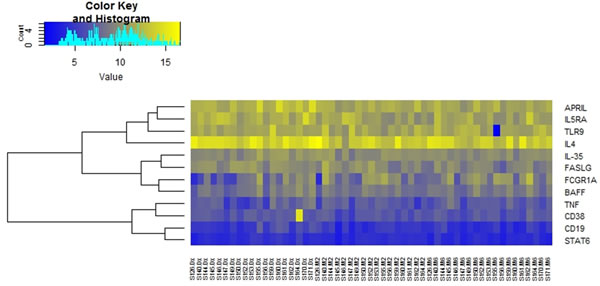
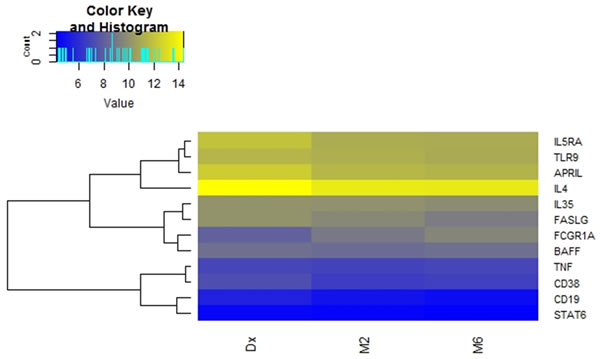
Figure 2: Differential mRNA expression over the course of anti-tuberculosis treatment. Heat map depicting changes in normalized expression values (dCt). Genes with low expression levels are depicted in yellow, whereas genes with high expression levels are depicted in blue. a. Group comparisons showing gene expression for individual participants. b. Comparison of the average gene expression between the respective groups.
Discussion
B-cells displaying regulatory phenotypes secrete cytokines such as IL-10 and IL-35, and also express FasL. These FasL-expressing B-cells have predominantly been studied in autoimmune diseases and infections [18]. A study conducted in mice showed that IL-35 secreted by B-cells limited EAE pathogenesis by decreasing the accumulation of pathogenic cells in the target organ [11]. Similarly, B-cell-deficiencies in mice have been linked to a decreased control of Salmonella infection [19]. In the current study, FASLG, IL5RA and IL4 expression were decreased in TB cases at diagnosis compared to healthy controls. In contrast, FASLG and IL5RA expression were increased after 6 months in TB cases. These results suggest that B-cell activity may be restored following successful anti-TB treatment and could play a role in the protective immunity against M.tb infection.
CD38 is a membrane-bound protein which is expressed on the surface of B-cells throughout their lifespan [20]. However, the expression of CD38 is highest on B1 B-cells [21]. Crosslinking of the CD38 receptor on mature B-cells leads to proliferation, isotype switching and reduced apoptosis. Additionally, CD38 acts as a co-stimulatory signal to B-cells activated by means of TLR ligands [22], [23]. Here we show a decline in the expression of CD38 in B-cells from TB participants compared to healthy controls. This points to a reduction in the activation of B-cells during active M.tb infection. APRIL, which is a proliferation inducing ligand, is also associated with the activation of B-cells. We found APRIL at lower levels in TB participants compared to healthy controls. However, the expression of this gene was restored after 6 months of treatment, in addition to CD19. Together these results suggest that there is an increase in B-cell activation throughout treatment in TB cases. This restored B-cell activation may lead to more interactions between B-cells and helper T-cells due to the upregulation of co-stimulatory molecules [23].
Transcriptional analyses are useful for the identification of biomarkers for diagnostics, as well as monitoring treatment response during tuberculosis and other diseases [14]-[17]. In the current study, FASLG and IL5RA was downregulated in TB cases at diagnosis compared to healthy controls. The expression of the latter genes were upregulated in TB cases at 6 months of treatment. Collectively, this suggests that FASLG and IL5RA have the potential to be utilised as a biosignature to monitor success or failure of treatment. Further studies in larger cohorts are required to confirm this.
In conclusion, the results of our pilot study suggest that B-cells expressing regulatory genes could be involved during the immune response to M.tb infection. Previous studies of regulatory B-cells focussed mostly on autoimmune diseases and helminth infections. Supplementary transcriptional and functional studies are required to confirm the precise role that B cells play during tuberculosis disease and the mechanisms by which the activation/immune induction is achieved.
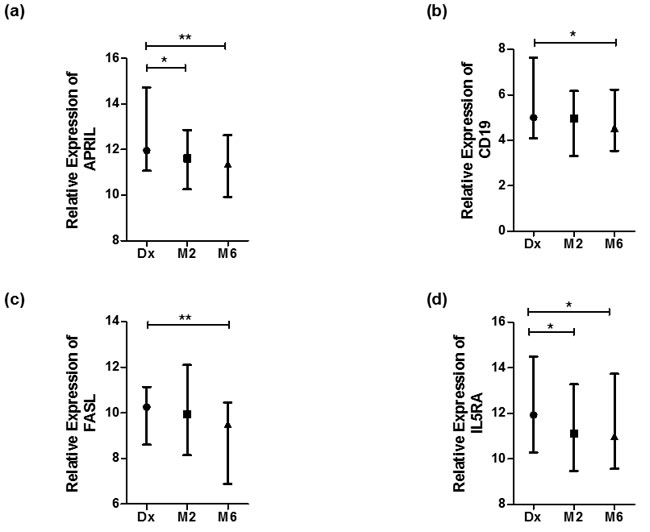
Figure 3: Genes differentially expressed during anti-TB treatment. Normalized expression values of genes as calculated using the dCt method (Ct (gene) - Ct (housekeeping gene)). Statistical differences calculated by means of Kruskal Wallis tests, where significant differences are indicated by an asterisk (* = p < 0, 05 or ** = p < 0.01). Data represented as median dCt with bars representing range. High dCt values indicate low gene expression, and low dCt values indicate high gene expression. a. APRIL, b. CD19, c. FASL and d. IL5RA.
Materials and Methods
Participant recruitment and sample collection
This study was carried out according to the guidelines of the ICH-GCP. All participants provided written informed consent for participation in the study, and the use and storage of the samples for biomarker discovery. Ethical approval was obtained from the Health Research Ethics Committee (Ethics number N10/01/013) of Stellenbosch University and the Departments of Health of the Province of the Western Cape and City of Cape Town.
The study participants were recruited from the Ravensmead/Uitsig community in Cape Town Western Cape. Individuals with newly diagnosed, untreated pulmonary TB were enrolled into the study prior to commencement of anti-TB treatment. The inclusion criteria for the ten healthy controls was a positive IGRA. For TB cases we included participants with a chest radiograph with suggestive signs of TB, clinical symptoms of TB including a chronic cough, weight loss and night sweats, as well as a positive sputum-culture and -smear. The exclusion criteria included prior cases of TB or other lung diseases, and a HIV positive status. In addition, ten individuals with a lung disease (other than TB) were enrolled into the study. Half of the other lung disease (OLDs) (Table 1) were IGRA positive. The individuals in the OLD and healthy control (Ctrl) groups did not present any clinical symptoms of M.tb infection.
Peripheral blood was collected from the study participants into sodium heparin tubes, as well as sputum samples for smear/culture tests. The individuals with TB were subsequently followed up at month two and month six of treatment, where blood and sputum samples were collected once more to monitor their response to treatment. Thirteen TB cases had converted to culture negative at month 2 of treatment, and all TB cases were cured at the end of treatment which was confirmed by sputum culture tests.
Sample preparation, mRNA isolation and quality check
On the day of blood collection, peripheral blood mononuclear cells (PBMCs) were isolated using the ficoll/histopaque separation method (GE Health, Piscataway, NJ). Total B-cells were isolated using the MACS bead separation method through positive selection (B cell isolation kit II, Miltenyi, Germany), and stored in RNAlater® (Life Technologies, USA). The cells were stored in liquid nitrogen until batch analysis.
The cells were thawed on ice and spun down before being washed in Phosphate-buffered saline (PBS). Subsequently, mRNA was isolated using the RNEasy® Mini Kit (Qiagen, Germany) according to manufacturer’s instructions. RNA purity and quantification was assessed using NanoDrop 2000 spectrophotometer data. More specifically, the 260/ 280 ratio and the 260/ 230 ratio were measured to assess the purity of the isolated RNA. A 260/280 and 260/230 ratio of at least 1.7 and 1.5 respectively, was considered sufficiently pure for further analysis. The RNA samples were stored at -80 ˚C.
cDNA synthesis and RT-qPCR
The isolated RNA was thawed on ice and diluted to a concentration of 300ug, and subsequently used to synthesise cDNA. The procedure was carried out in a thermal cycler (Life Technologies, USA) using the First Strand Kit (Qiagen, Germany) according to the manufacturer’s instructions. The cDNA was then used as template for quantitative PCR on the ABI 7900HT platform. The RT2 Profiler Custom Arrays (Qiagen, Germany) were utilised and manufacturer’s instructions were followed. The arrays contained primers for the following genes of interest: IL35 (NM_000882.3), IL4(NM_000589.3), Fas-ligand (FASLG) (NM000639.2), IL5RA receptor alpha (IL5RA) (NM_000564.4), cluster of differentiation 38 (CD38) (NM_001775.2), APRIL (NM_00198622.1), BAFF (NM001145645.2), TNF-a (NM_000594.3), Fc gamma receptor 1 alpha (FCGR1A) (NM_000566.3), Toll-like receptor 9 (TLR9) (NM_017442.3), STAT6 (NM_001178078.1), as well as two housekeeping genes B2M (NM_004048) and GAPDH (NM_002046). FASLG, IL5RA and IL35 is associated with regulatory B-cells. Furthermore, APRIL, CD38 and TLR9 is involved in B-cells activation.
Data analysis
The gene expression data obtained from the ABI 7900HT was represented as Ct values, which indicated the earliest visible cycle of amplification. These Ct values were converted to fold change values using the Qiagen online software (www.SABiosciences.com/pcrarraydataanalysis.php). Where applicable, differences were calculated using Prism 5 Software and Kruskal-Wallis tests, where p < 0.05 indicates a statistically significant difference. Heatmaps were generated using delta Ct (dCt) data and R statistical packages.
Acknowledgments
We would like to thank the field staff and members of the Immunology Research Group (SUNIRG) as well as the study participants.
Conflicts of Interest
The authors declare no conflict of interest.
Funding
ICvR holds an MRC scholarship. GW holds the DST/NRF SA Research Chair Initiative (SARChI) for TB Biomarkers.
References
1. Caccamo N, Guggino G, Joosten SA, Gelsomino G, Di Carlo P, Titone L, Galati D, Bocchino M, Matarese A, Salerno A, Sanduzzi A, Franken WPJ, Ottenhoff THM, et al. Multifunctional CD4+ T cells correlate with active Mycobacterium tuberculosis infection. Eur J Immunol. 2010; 40: 2211–20.
2. Qiu Z, Zhang M, Zhu Y, Zheng F, Lu P, Liu H, Graner MW, Zhou B, Chen X. Multifunctional CD4 T Cell Responses in Patients with Active Tuberculosis. Sci Rep. 2012; 2.
3. Lichtner M, Mascia C, Sauzullo I, Mengoni F, Vita S, Marocco R, Belvisi V, Russo G, Vullo V, Mastroianni CM. Multifunctional Analysis of CD4+T-cell Response as immune-based model for Tuberculosis detection. J Immunol Res. 2015
4. De Valliere S, Abate G, Blazevic A, Heuertz RM, Hoft DF. Enhancement of Innate and Cell-Mediated Immunity by Antimycobacterial Antibodies. Infect Immun. 2005; 73: 6711–20.
5. Maglione PJ, Xu J, Chan J. B cells moderate inflammatory progression and enhance bacterial containment upon pulmonary challenge with Mycobacterium tuberculosis. J Immunol. 2007; 178: 7222–34.
6. Maglione PJ, Chan J. How B cells shape the immune response against Mycobacterium tuberculosis. Eur J Immunol. 2009; 39: 676–86.
7. Ganapamo F, Dennis VA, Philipp MT. CD19+ cells produce IFN-γ in mice infected with Borrelia burgdorferi. Eur J Immunol. 2001; 31: 3460–8.
8. Liu Q, Liu Z, Rozo CT, Hamed HA, Alem F, Urban JF, Gause WC. The role of B cells in the development of CD4 effector T cells during a polarized Th2 immune response. J Immunol. 2007; 179: 3821–30.
9. Schultze JL, Michalak S, Lowne J, Wong A, Gilleece MH, Gribben JG, Nadler LM. Human non-germinal center B cell interleukin (IL)-12 production is primarily regulated by T cell signals CD40 ligand, interferon γ, and IL-10: role of B cells in the maintenance of T cell responses. J Exp Med. 1999; 189: 1–12.
10. Wagner M, Poeck H, Jahrsdoerfer B, Rothenfusser S, Prell D, Bohle B, Tuma E, Giese T, Ellwart JW, Endres S, Hartmann G. IL-12p70-Dependent Th1 Induction by Human B Cells Requires Combined Activation with CD40 Ligand and CpG DNA. J Immunol. 2004; 172: 954–63.
11. Shen P, Roch T, Lampropoulou V, O’Connor RA, Stervbo U, Hilgenberg E, Ries S, Dang VD, Jaimes Y, Daridon C, Li R, Jouneau L, Boudinot P, et al. IL-35-producing B cells are critical regulators of immunity during autoimmune and infectious diseases. Nature. 2014; 507: 366–70.
12. Klinker MW, Reed TJ, Fox DA, Lundy SK. Interleukin-5 Supports the Expansion of Fas Ligand-Expressing Killer B Cells that Induce Antigen-Specific Apoptosis of CD4+ T Cells and Secrete Interleukin-10. Bobé P, editor. PLoS ONE. 2013; 8: e70131.
13. Montandon R, Korniotis S, Layseca-Espinosa E, Gras C, Megret J, Ezine S, Dy M, Zavala F. Innate pro-B-cell progenitors protect against type 1 diabetes by regulating autoimmune effector T cells. Proc Natl Acad Sci. 2013; 110: E2199–208.
14. Cliff JM, Lee J-S, Constantinou N, Cho J-E, Clark TG, Ronacher K, King EC, Lukey PT, Duncan K, Van Helden PD, Walzl G, Dockrell HM. Distinct Phases of Blood Gene Expression Pattern Through Tuberculosis Treatment Reflect Modulation of the Humoral Immune Response. J Infect Dis. 2013; 207: 18–29.
15. Berry MPR, Graham CM, McNab FW, Xu Z, Bloch SAA, Oni T, Wilkinson KA, Banchereau R, Skinner J, Wilkinson RJ, Quinn C, Blankenship D, Dhawan R, et al. An interferon-inducible neutrophil-driven blood transcriptional signature in human tuberculosis. Nature. 2010; 466: 973–7.
16. Anderson ST, Kaforou M, Brent AJ, Wright VJ, Banwell CM, Chagaluka G, Crampin AC, Dockrell HM, French N, Hamilton MS, Hibberd ML, Kern F, Langford PR, et al. Diagnosis of Childhood Tuberculosis and Host RNA Expression in Africa. N Engl J Med. 2014; 370: 1712–23.
17. Van Rensburg IC, Loxton AG. Transcriptomics: the key to biomarker discovery during tuberculosis? Biomark Med. 2015; 9: 483–95.
18. Lundy SK. Killer B lymphocytes: the evidence and the potential. Inflamm Res. 2009
19. Mittrücker H-W, Kaufmann SH. Immune response to infection with Salmonella typhimurium in mice. J Leukoc Biol. 2000; 67: 457–63.
20. Vences-Catalán F, Santos-Argumedo L. CD38 through the life of a murine B lymphocyte. IUBMB Life. 2011; 63: 840–6.
21. Donís-Hernández FR, Parkhouse RME, Santos-Argumedo L. Ontogeny, distribution and function of CD38-expressing B lymphocytes in mice. Eur J Immunol. 2001; 31: 1261–7.
22. Tsukamoto Y, Nagai Y, Kariyone A, Shibata T, Kaisho T, Akira S, Miyake K, Takatsu K. Toll-like receptor 7 cooperates with IL-4 in activated B cells through antigen receptor or CD38 and induces class switch recombination and IgG1 production. Mol Immunol. 2009; 46: 1278–88.
23. Manjarrez-Orduño N, Moreno-García ME, Fink K, Santos-Argumedo L. CD38 cross-linking enhances TLR-induced B cell proliferation but decreases IgM plasma cell differentiation. Eur J Immunol. 2007; 37: 358–67.