
INTRODUCTION
Pancreatic ductal adenocarcinoma (PDAC) has a dismal prognosis with a 5-year survival of 5% [1, 2]. Surgery is currently the only potentially curative treatment for PDAC but the majority of patients are diagnosed at advanced inoperable stage, whereas radiotherapy and chemotherapy are associated with high recurrence rates [1, 2]. A common characteristic of PDAC is the presence of a desmoplastic stroma with infiltration by immunosuppressive cells, such as macrophages that has been associated with disease aggressiveness [3, 4], whereas the role of B cells in this disease remains controversial [5–8].
The aberrant vascular architecture of solid tumors in conjunction with increased consumption of oxygen by cancer cells leads to hypoxia that limits the efficacy of conventional treatments and promotes metastasis [9–12]. Traditionally, PDAC has been considered as a highly hypoxic malignancy based on histological studies and pO2 measurements with intratumoral Eppendorf electrode probes [13–16]. However, these studies presented limitations. Indeed, immunohistochemical staining for either carbonic anhydrase (CA9) and hypoxia-inducible factor (HIF-1) has revealed very high expression of these hypoxia markers [17, 18], these analyses were performed in either tissue microarrays (TMAs) or small sections that fail to consider the potentially large tissue heterogeneity across the resected specimen. Similarly, the Eppendorf probe-based measurement of hypoxia by Koong et al. was only conducted in seven patients and hence no definitive conclusions can be drawn [19].
In addition, the stroma of PDAC prevents chemotherapy delivery in part by compromising vascular patency and functionality [13, 20]. Depletion or „re-education“ of the stroma can, in certain conditions, lead to increased vessel density and increased intratumoral gemcitabine concentration, enhancing therapeutic response [13, 20–22], albeit stromal alteration can have mixed effects on tumor progression [23–26]. Also, the accuracy of vessel density assessment in PDAC has been hampered by the examination of small tumor regions, and mixed findings have been reported regarding the prognostic value of vascularity [27–30]. Importantly, previous clinical analyses failed to examine hypoxia and vessel density in the context of desmoplastic stroma [25, 26, 31–33].
We have recently studied the prognostic impact of several important immune markers and cell populations, such as PD-1, PD-L1, CD8 and FOXP3 [34]. In the present work we decided to focus on cell populations that have not been previously investigated on entire pancreatectomy sections. For that purpose, we examine the prognostic impact of macrophages (CD68), B cells (CD20) as well hypoxia (carbonic anhydrase 9; CA9) and vessel density (CD31) alone, and also the correlation with the desmoplastic stroma density and activity based on haematoxylin-eosin and αSMA, respectively, in a large number of patients (n = 141) that received primary surgery followed by adjuvant chemotherapy. An additional reason for studying CD68 and C20 is the recent work by Coussens and colleagues which demonstrated that B cell-macrophage interactions lead, via the Bruton tysoine kinase, to immune suppression and PDAC progression [5]. Notably, we performed our study by examining large sections obtained from the entire pancreatectomy sample that takes into consideration the tissue heterogeneity and facilitates a more accurate evaluation of the hypoxic and vascular area distribution and proportion.
RESULTS
CA9, CD31, CD68 and CD20 staining characteristics
The median percentage of tumor surface area positive for CA9 and CD31 immunohistochemical staining were 7.8% and 8.1%, respectively. Of note, only 15 (10.6%) and 5 (3.5%) patients had a percentage of positive CA9 tumor area expression higher than 20% and 30%, respectively. The results of CD68 and CD20 immunohistochemistry including the three individual tumor compartment scores (intraepithelial, stroma and periphery) and the total score from all compartments are presented in Table 1.
Table 1: Results of CD68 and CD20 immunohistochemistry scoring
Immune marker |
CD68 n (%) |
CD20 n (%) |
|---|---|---|
Dichotomized total score* |
< 8 vs ≥ 8 |
< 5 vs ≥ 5 |
Low expression |
65 (46.1) |
50 (35.5) |
High expression |
76 (53.9) |
91 (64.5) |
Dichotomized tumor (intraepithelial) compartment score |
< 2 vs ≥ 2 |
< 2 vs ≥ 2 |
Low expression |
33 (23.4) |
118 (83.6) |
High expression |
108 (76.6) |
23 (16.4) |
Dichotomized stroma compartment score |
< 3 vs ≥ 3 |
< 2 vs ≥ 2 |
Low expression |
30 (21.3) |
46 (32.6) |
High expression |
111 (78.7) |
95 (67.4) |
Dichotomized peripheral compartment score |
< 3 vs ≥ 3 |
< 2 vs ≥ 2 |
Low expression |
52 (36.9) |
12 (8.5) |
High expression |
89 (63.1) |
129 (91.5) |
*Dichotomized labelling (low vs high expression) based on the median value of immune marker expression. Total score accounted for all three compartment scores (tumor, stroma, periphery).
With regard to the correlation of CA9, CD31, total CD68 and total CD20 expression with the clinicopathological parameters (Table 2), patients younger than 65 years of age (median cut-off) had significantly lower percentages of tumor hypoxia and vice versa (low CA9 vs high: p < 0.001). Unexpectedly, significantly more patients with vascular invasion (VI) had lower CA9 expression (p = 0.034). Also, PNI was more common in patients with high CD68 expression (p = 0.016). We failed to detect any further significant correlation between either CA9, CD31, CD68, CD20 and the clinicopathological characteristics (Table 2).
Table 2: Clinicopathological characteristics and correlation with CA9, CD31, CD68 and CD20 expression
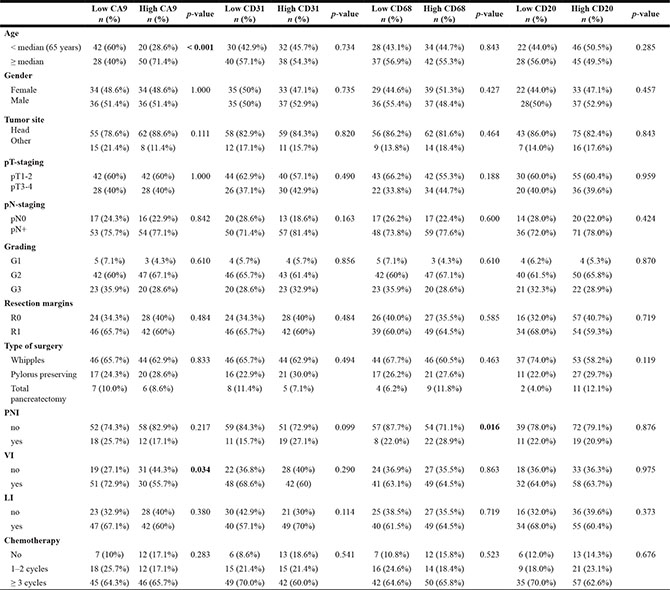
Abbreviations: PNI, perineural/neural invasion; VI, vascular invasion; LI, lymphatic invation.
Image examples of whole-mount pancreatectomy sections with low and high CA9 and CD31 together with the corresponding H&E (stromal density), αSMA (stromal activation) images are shown in Figure 1. Scanning and histological mapping revealed interpatient and intrapatient heterogeneity with regard to the extent and the localization of regions with positive CA9 and CD31 staining. This finding highlights the importance of using large pancreatectomy sections rather than TMAs or small sections as the latter can lead to either under- or overestimation of marker expression. Examples of images with high and low CD68 expression with the corresponding CD20 (double staining) are shown in Figure 2. The clinicopathological characteristics for the entire cohort are shown in Supplementary Table 1.
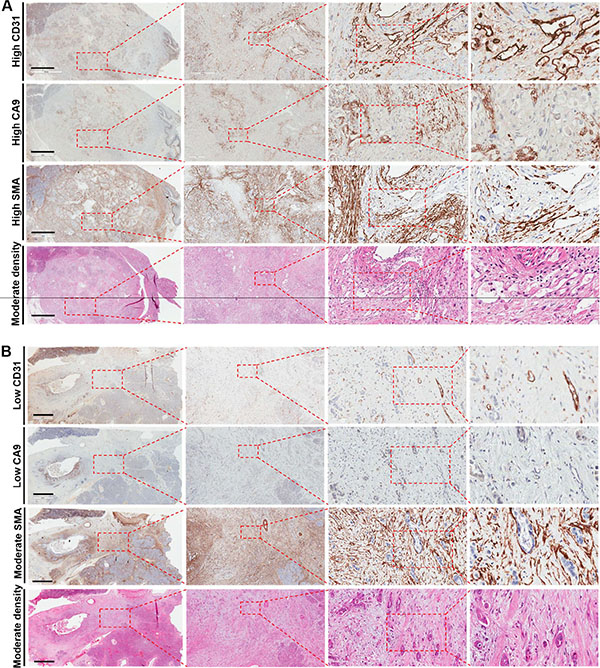
Figure 1: Examples of (A) high CD31 and CA9 expression and (B) low CD31 and CA9 expression in patients with pancreatic cancer adenocarcinoma. The corresponding haematoxyllin-eosin (stroma density) and αSMA (stroma activation) images are shown as well. The left panels illustrate large pancreatectomy sections (Bar: 6 mm). The magnifications of the second, third and fourth inserts from the left are × 50, × 200 and × 400, respectively.
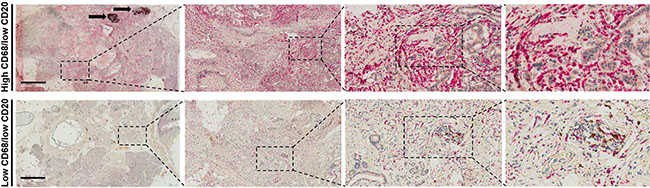
Figure 2: Examples of (A) high CD68 expression and (B) low CD68 expression in patients with pancreatic cancer adenocarcinoma. The corresponding CD20 images are shown as well. The left panels illustrate large pancreatectomy sections (Bar: 6 mm). Black arrows indicate two lymph node metastases. The magnifications of the second, third and fourth inserts from the left are × 50, × 200 and × 400, respectively.
Hypoxia, vessel density, immune markers and prognosis
The median OS for the entire cohort was 21 months and the 3-year OS was 36% after a mean follow-up of 20 months (range, 2–69 months). From the entire cohort, 55 (39%) patients presented with distant recurrence, 15 (10.6%) developed local recurrence, 14 (9.9%) had both local and distant recurrence, whereas 57 (40.4%) lacked any recurrence by the time of analysis. In the univariate analysis, CA9 lacked any statistical prognostic significance for either OS (p = 0.229), PFS (p = 0.388), LPFS (p = 0.0.375) or DMFS (p = 0.405) (Table 3). Similarly, CD31, total CD68 and total CD20 expression failed to demonstrate any correlation with the clinical outcome. Advanced T-stage (T3-4 vs T1-2), the presence of lymph node metastases (pN+ vs pN0), resection margin status, perineural/neural invasion (PNI), venous invasion (VI) and chemotherapy adversely affected all four clinical endpoints. High tumor grading negatively impacted PFS (p = 0.009) and DMFS (p = 0.004) but not OS (p = 0.056) or LPFS (p = 0.064). We failed to detect a significant correlation for either sex, age, tumor localization or type of surgery with the clinical outcome (Table 3).
Table 3: Univariate and multivariate analysis of prognostic factors in the entire patient cohort (n = 141)
Univariate |
Multivariate |
||||
|---|---|---|---|---|---|
p-value |
HR |
95% CI |
p-value |
||
Lower |
Upper |
||||
OS |
|||||
CA9 (Low vs High) |
0.229 |
1.207 |
0.720 |
2.022 |
0.475 |
CD31 (Low vs High) |
0.285 |
0.956 |
0.583 |
1.569 |
0.860 |
CD68 (Low vs High) |
0.623 |
1.032 |
0.860 |
1.237 |
0.738 |
CD20 (Low vs High) |
0.864 |
1.048 |
0.637 |
1.724 |
0.854 |
Age (< median(65) vs ≥ median) |
0488 |
1.180 |
0.702 |
1.985 |
0.532 |
Sex (male vs female) |
0.291 |
1.176 |
0.722 |
1.917 |
0.514 |
Tumour localisation (head vs other) |
0.204 |
0.633 |
0.279 |
1.436 |
0.274 |
pT-stage (pT1-2 vs pT3-4) |
0.001 |
0.495 |
0.295 |
0.829 |
0.008 |
pN-stage ( pN0 vs pN+) |
0.001 |
1.874 |
0.927 |
3.786 |
0.080 |
Grading (G1 vs G2 vs G3) |
0.056 |
1.252 |
0.815 |
1.926 |
0.305 |
Resection margins (R0 vs R1) |
0.001 |
1.374 |
0.769 |
2.453 |
0.283 |
Type of surgery (W vs PP vs TP) |
0762 |
1.170 |
0.745 |
1.839 |
0.496 |
PNI (no vs yes) |
0.001 |
1.695 |
0.977 |
2.941 |
0.060 |
VI (no vs yes) |
0.010 |
1.633 |
0.883 |
3.023 |
0.118 |
LI (no vs yes) |
0.11 |
0.923 |
0.516 |
1.650 |
0.787 |
Chemotherapy (no vs 1-2 cycles vs ≥ 3 cycles) |
< 0.001 |
0.564 |
0.406 |
0.782 |
0.001 |
PFS |
|||||
CA9 (Low vs High) |
0.388 |
1.100 |
0.680 |
1.780 |
0.697 |
CD31 (Low vs High) |
0.349 |
0.894 |
0.569 |
1.406 |
0.628 |
CD68 (Low vs High) |
0.745 |
1.010 |
0.849 |
1.202 |
0.908 |
CD20 (Low vs High) |
0.623 |
0.912 |
0.586 |
1.419 |
0.683 |
Age (< median(65) vs ≥ median) |
0.532 |
1.168 |
0.713 |
1.914 |
0.538 |
Sex (male vs female) |
0.790 |
1.041 |
0.661 |
1.638 |
0.864 |
Tumour localisation (head vs other) |
0.204 |
0.700 |
0.343 |
1.429 |
0.327 |
pT-stage (pT1-2 vs pT3-4) |
0.002 |
0.557 |
0.350 |
0.887 |
0.014 |
pN-stage ( pN0 vs pN+) |
0.001 |
2.537 |
1.309 |
4.916 |
0.006 |
Grading (G1 vs G2 vs G3) |
0.009 |
1.476 |
0.991 |
2.197 |
0.055 |
Resection margins (R0 vs R1) |
0.001 |
1.354 |
0.798 |
2.300 |
0.261 |
Type of surgery (W vs PP vs TP) |
0.704 |
1.022 |
0.691 |
1.510 |
0.915 |
PNI (no vs yes) |
< 0.001 |
1.878 |
1.111 |
3.177 |
0.019 |
VI (no vs yes) |
0.007 |
1.473 |
0.854 |
2.542 |
0.164 |
LI (no vs yes) |
0.077 |
0.961 |
0.576 |
1.605 |
0.880 |
Chemotherapy (no vs 1-2 cycles vs ≥ 3 cycles) |
< 0.001 |
0.692 |
0.509 |
0.941 |
0.019 |
LPFS |
|||||
CA9 (Low vs High) |
0.375 |
1.130 |
0.682 |
1.874 |
0.634 |
CD31 (Low vs High) |
0.252 |
1.015 |
0.630 |
1.636 |
0.950 |
CD68 (Low vs High) |
0.446 |
1.046 |
0.874 |
1.252 |
0.625 |
CD20 (Low vs High) |
0.850 |
1.011 |
0.631 |
1.622 |
0.962 |
Age (< median(65) vs ≥ median) |
0.222 |
1.414 |
0.845 |
2.367 |
0.187 |
Sex (male vs female) |
0.435 |
1.276 |
0.805 |
2.021 |
0.299 |
Tumour localisation (head vs other) |
0.186 |
0.689 |
0.318 |
1.494 |
0.345 |
pT-stage (pT1-2 vs pT3-4) |
0.007 |
0.612 |
0.375 |
1.000 |
0.050 |
pN-stage ( pN0 vs pN+) |
0.001 |
1.930 |
0.980 |
3.799 |
0.057 |
Grading (G1 vs G2 vs G3) |
0.064 |
1.241 |
0.824 |
1.868 |
0.301 |
Resection margins (R0 vs R1) |
0.001 |
1.496 |
0.858 |
2.609 |
0.156 |
Type of surgery (W vs PP vs TP) |
0.814 |
1.056 |
0.687 |
1.624 |
0.804 |
PNI (no vs yes) |
< 0.001 |
1.960 |
1.139 |
3.374 |
0.015 |
VI (no vs yes) |
0.008 |
1.543 |
0.851 |
2.796 |
0.153 |
LI (no vs yes) |
0.011 |
0.937 |
0.541 |
1.622 |
0.816 |
Chemotherapy (no vs 1-2 cycles vs ≥ 3 cycles) |
< 0.001 |
0.606 |
0.442 |
0.830 |
0.002 |
DMFS |
|||||
CA9 (Low vs High) |
0.405 |
1.189 |
0.728 |
1.944 |
0.489 |
CD31 (Low vs High) |
0.342 |
0.880 |
0.550 |
1.408 |
0.594 |
CD68 (Low vs High) |
0.949 |
0.965 |
0.810 |
1.150 |
0.688 |
CD20 (Low vs High) |
0.526 |
0.848 |
0.536 |
1.341 |
0.481 |
Age (< median(65) vs ≥ median) |
0.818 |
1.042 |
0.628 |
1.729 |
0.874 |
Sex (male vs female) |
0.452 |
1.119 |
0.701 |
1.786 |
0.637 |
Tumour localisation (head vs other) |
0.291 |
0.674 |
0.318 |
1.428 |
0.303 |
pT-stage (pT1-2 vs pT3-4) |
0.001 |
0.409 |
0.250 |
0.671 |
0.001 |
pN-stage ( pN0 vs pN+) |
0.001 |
2.347 |
1.197 |
4.600 |
0.013 |
Grading (G1 vs G2 vs G3) |
0.004 |
1.485 |
0.982 |
2.243 |
0.061 |
Resection margins (R0 vs R1) |
0.001 |
1.351 |
0.779 |
2.342 |
0.284 |
Type of surgery (W vs PP vs TP) |
0.428 |
1.010 |
0.666 |
1.530 |
0.963 |
PNI (no vs yes) |
0.001 |
1.590 |
0.926 |
2.730 |
0.093 |
VI (no vs yes) |
0.005 |
1.640 |
0.933 |
2.882 |
0.086 |
LI (no vs yes) |
0.078 |
0.963 |
0.568 |
1.634 |
0.890 |
Chemotherapy (no vs 1-2 cycles vs ≥ 3 cycles) |
< 0.001 |
0.706 |
0.510 |
0.976 |
0.035 |
Abbreviations: HR. hazard ratio; CI, confidence interval; W, Whipples; PP, partial pancreatectomy; TP, total pancreatectomy; VI, vascular invasion; LI, lymphatic invasion; PNI, perineural/neural invasion; OS, overall survival; PFS, progression-free survival; LFFS, local failure-free survival; DMFS, distant metastases-free survival;
Significant values have been marked with bold.
Subsequently, we performed a multivariate analysis by including CA9, CD31, CD68, CD20 and the clinicopathological factors (Table 3). In the Cox model adjuvant chemotherapy and advanced T-stage (pT3-4 vs pT1-2) retained their significance for all four clinical endpoints. The presence of lymph node metastases (pN+ vs pN0) correlated with worse PFS (p = 0.006) and DMFS (p = 0.013), whereas PNI was associated with worse PFS (p = 0.019) and LPFS (p = 0.015).
We conducted a separate analysis whereby we examined the prognostic role of the markers according to the different tumour compartments. Only high tumor (intraepithelial) compartment expression of CD68 predicted for worse PFS (p = 0.033) and DMFS (p = 0.047) (Figure 3), whereas no other significant findings were found for CD20.
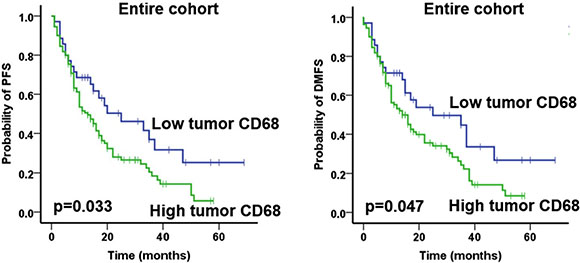
Figure 3: Prognostic impact of tumor compartment CD68 expression on progression-free survival (PFS) and and distant metastases free survival (DMFS) in the entire cohort, as indicated. Only significant data are shown here. Analysis was based on the dichotomized tumor compartment CD68 score in resected patient samples (cut-off according to median value of tumor compartment score).
The correlation of hypoxia, vessel density and immune markers with stromal morphology
We have recently demonstrated that the desmoplastic stroma of human PDAC is not homogeneous but rather presents three different patterns of stroma density and activation [31]. Patients with high stromal density tumors had a significantly superior outcome compared to patients with moderate or loose density [31]. Because the lack of prognostic value for CA9, CD31, total CD68 and total CD20 expression was an unexpected finding, we first examined the correlation of these markers with stromal density (H&E) and stromal activation (αSMA; Supplementary Tables 2–3). Interestingly, tumors with high stromal density had lower levels of CA9 expression and, vice versa, tumors with loose stroma had higher CA9 expression (p = 0.037). CD31 expression did not show variation with stromal density. Similarly, there was no correlation of either CA9 or CD31 with αSMA (Supplementary Table 2), or for CD68 and CD20 with the stromal morphology (Supplementary Table 3).
Subsequently, we investigated the prognostic impact of the CA9 and CD31 according to the different degrees of stromal density and activation (Table 4). Intriguingly, in contrast to the entire cohort, patients with high CD31 expression in the moderate stromal density subgroup had a significantly worse OS (low vs high CD31: mean 30.2 vs 18.3 months; p = 0.004), PFS (low vs high CD31: mean 23.7 vs 12.3 months; p = 0.008), LPFS (low vs high CD31: mean 27.2 vs 16.8 months; p = 0.014) and DMFS (low vs high CD31: mean 26.1 vs 12.6 months; p = 0.004) (Figure 4; Table 4).
Table 4: Prognostic impact of CA9 and CD31 according to stroma density and activation
Marker expression (high vs low) |
OS p-value |
PFS p-value |
LPFS p-value |
DMFS p-value |
|---|---|---|---|---|
CA9 |
||||
Dense stroma |
0.715 |
0.517 |
0.775 |
0.860 |
Moderate stroma |
0.913 |
0.617 |
0.879 |
0.756 |
Loose Stroma |
0.658 |
0.985 |
0.667 |
0.889 |
CD31 |
||||
Dense stroma |
0.303 |
0.163 |
0.250 |
0.263 |
Moderate stroma |
0.004 |
0.008 |
0.014 |
0.004 |
Loose Stroma |
0.415 |
0.147 |
0.772 |
0.162 |
CA9 |
||||
Absent/low SMA |
0.420 |
0.542 |
0.283 |
0.791 |
Moderate/strong SMA |
0.702 |
0.821 |
0.905 |
0.681 |
CD31 |
||||
Absent/low SMA |
0.702 |
0.338 |
0.462 |
0.241 |
Moderate/strong SMA |
0.258 |
0.432 |
0.285 |
0.520 |
Abbreviations: OS, overall survival; PFS, progression-free survival; LFFS, local failure-free survival; DMFS, distant metastases-free survival; significant values have been marked with bold.
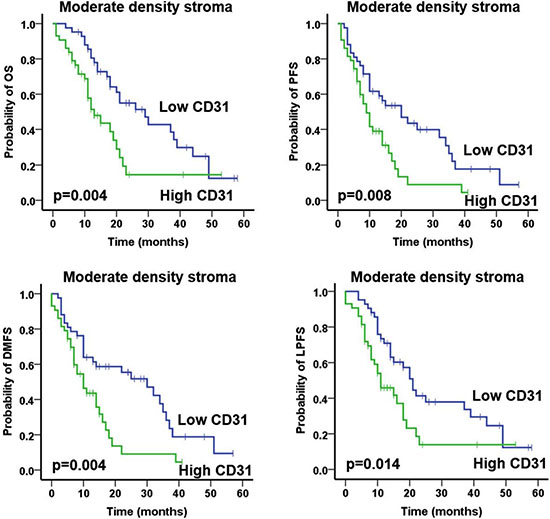
Figure 4: Prognostic impact of total CD31 expression on overall survival (OS), progression-free survival (PFS), local progression-free survival (LPFS) and distant metastases free survival (DMFS) in patients with tumors of moderate stroma density, as indicated. Analysis was based on the dichotomized percentage of CD31 surface area expression in resected patient samples (cut-off according to median value of surface area expression percentage).
Similarly, we analysed the prognostic role of CD68 and CD20 according to the three tumor compartments (tumor, stromal and peripheral) separately, and also with regard to stromal morphology (Table 5; Supplementary Table 4; Supplementary Figure 1). High stromal CD68 expression predicted for significantly worse PFS (p = 0.017) and DMFS (p = 0.023) in patients with tumors of lose density, whereas high peripheral compartment CD68 expression correlated with less favourable PFS (p = 0.013), LPFS (p = 0.044) and DMFS (p = 0.048) only in patients with moderate density tumors. We did not observe any further significant differences in the prognostic role of these immune markers according to the tumor compartment.
Table 5: Prognostic impact of CD68 and CD20 according to stroma density
Marker expression (high vs low) |
OS p-value |
PFS p-value |
LPFS p-value |
DMFS p-value |
|---|---|---|---|---|
Total CD68 |
||||
Dense stroma |
0.725 |
0.954 |
0.509 |
0.804 |
Moderate stroma |
0.307 |
0.102 |
0.096 |
0.940 |
Loose Stroma |
0.399 |
0.256 |
0.988 |
0.283 |
Total CD20 |
||||
Dense stroma |
0.736 |
0.701 |
0.753 |
0.804 |
Moderate stroma |
0.373 |
0.955 |
0.975 |
0.940 |
Loose Stroma |
0.366 |
0.269 |
0.199 |
0.333 |
Stromal compartment CD68 |
||||
Dense stroma |
0.370 |
0.884 |
0.439 |
0.964 |
Moderate stroma |
0.454 |
0.185 |
0.305 |
0.243 |
Loose Stroma |
0.331 |
0.017 |
0.182 |
0.023 |
Stromal compartment CD20 |
||||
Dense stroma |
0.473 |
0.196 |
0.210 |
0.235 |
Moderate stroma |
0.647 |
0.827 |
0.957 |
0.834 |
Loose Stroma |
0.214 |
0.514 |
0.333 |
0.536 |
Tumor compartment CD68 |
||||
Dense stroma |
0.113 |
0.126 |
0.133 |
0.196 |
Moderate stroma |
0.292 |
0.063 |
0.105 |
0.069 |
Loose Stroma |
0.748 |
0.775 |
0.496 |
0.796 |
Tumor compartment CD20 |
||||
Dense stroma |
N/A |
N/A |
N/A |
N/A |
Moderate stroma |
0.678 |
0.981 |
0.609 |
0.823 |
Loose Stroma |
N/A |
N/A |
N/A |
N/A |
Peripheral compartment CD68 |
||||
Dense stroma |
0.432 |
0.398 |
0.460 |
0.559 |
Moderate stroma |
0.065 |
0.013 |
0.044 |
0.048 |
Loose Stroma |
0.153 |
0.985 |
0.372 |
0.989 |
Peripheral compartment CD20 |
||||
Dense stroma |
0.483 |
0.544 |
0.089 |
0.097 |
Moderate stroma |
0.785 |
0.189 |
0.375 |
0.272 |
Loose Stroma |
0.393 |
0.761 |
0.693 |
0.601 |
Abbreviations: OS, overall survival; PFS, progression-free survival; LFFS, local failure-free survival; DMFS, distant metastases-free survival; significant values have been marked with bold.
Immune markers and lymphoid aggregates
In total, 57 (40.4%) patients from the entire cohort (n = 141) presented with intratumoral lymphoid aggregates, based on H&E staining. Hence, we examined the expression (absent vs present) of CD68 and CD20 in the lymphoid aggregates and their clinical impact (Supplementary Table 5). The presence of CD68 and CD20 did not correlate with the clinical outcome. Of note, the majority of B cells were located in lymphoid aggregates in close association with macrophages, whereas B cell infiltration throughout the tumor area was only scarce in our series (Supplementary Figure 2).
DISCUSSION
Although previous studies have analyzed the prognostic role of hypoxia markers HIF-1α and CA9, and CD31-based vascular density in patients with PDAC, the vast majority had been performed using either TMAs or small sections, whereas the correlation with the desmoplastic stroma remains, to the best of our knowledge, unexplored. Here, we examined hypoxia and vessel density using CA9 and CD31, respectively, in whole-mount pancreatectomy sections. We observed interpatient and intrapatient variability in the distribution of hypoxia throughout the tumor surface area. More importantly, and in contrast to the notion that PDAC is a highly hypoxic malignancy, a large proportion of tumor samples presented with either minimal or even lack of CA9 expression in our cohort. Indeed, from the n = 141 samples of the entire cohort, only 15 (10.6%) and 5 (3.5%) patients had a percentage of positive CA9 tumor surface area expression higher than 20% and 30%, respectively. Our data are in line with and further build upon a recent prospective clinical study in n = 10 patients that received intravenously the hypoxia marker pimonidazole preoperatively [35]. In that work, seven patients had minimal or very low levels of hypoxia, whereas the most hypoxic tumors showed positive pimonidazole staining in 20-30% of tumor surface area. Also, in accordance to our observation, large variability was noted [35].
Several reasons could be responsible for discrepancy between our results and previous reports indicating that PDAC is severely hypoxic [13–16, 19]. First, the measurement of hypoxia in clinical samples is challenging as different methods have been proposed including staining with nitroimidazoles, HIF-1α and CA9, pO2 assessment with Eppendorf probes or even imaging with F-MISO PET-CT scan [13–16, 19]. Second, the vast majority of studies have used small sections that failed to consider the substantial intratumoral heterogeneity of PDAC [17, 18]. Third, in contrast to our analysis that was conducted using automated computerized slide scanning and analysis of hypoxia expression, previous histological studies have used manual scoring of hypoxia which can be biased and is far from optimal for histological quantification of hypoxia. Our findings could have implications for strategies to alleviate hypoxia. For example, recent preclinical and clinical work using the prodrug TH-302 that releases the DNA alkylator bromo-isophosphoramide mustard in hypoxic areas demonstrated promising results [36, 37]. However, as we show in the present work, several patients had minimal or undetectable hypoxia levels in their tumors and hence caution is needed as this agent is unlikely to be effective in all patients with PDAC.
PDAC has been considered a hypovascular and poorly perfused tumor, albeit large scale imaging studies in the clinical setting are still lacking [13, 20]. We and others have recently described differential survival rates in patients with PDAC that varied significantly according to the degree of desmoplastic stromal density (H&E) and activation (αSMA) [31, 32]. In our series, tumors exhibited heterogeneous distribution of CD31-positive blood vessels throughout the tumor area, whereas vascularity in adjacent normal pancreas appeared less heterogeneous. High vessel density was significantly associated with worse clinical outcome only in patients with tumors of moderate but not strong or loose stroma density, whereas no correlation was found according to stromal activation. This intriguing finding could, in part, explain the discrepancy in reports on the prognostic role of vessel density. Indeed, some groups have described a strong prognostic impact, while other reports have failed to identify a correlation of vessel density with survival [27–30, 38]. Of note, angiogenesis inhibitors failed to demonstrate efficacy in PDAC [4]. Also, preclinical studies in transgenic mouse models of PDAC have shown that depletion or “re-education” of the stroma can reduce solid stress and/or interstitial fluid pressure to decompress blood vessels to enhance chemotherapy delivery and improve survival [20]. Depletion of stroma in sonic hedgehog-deficient mice led to more aggressive tumors that responded to blockade of vascular endothelial growth factor (VEGF) blockade [23]. Thus, our data on the adverse role of vessel density only in patients with moderately-dense stroma should be explored in larger series as the concept of vascular remodeling using either direct VEGF-blocking agents [10] or indirectly with agents such as PI3K/mTOR inhibitors [39] with the aim of normalizing vasculature making chemotherapy and radiotherapy more efficacious might still be applicable in a subgroup of patients.
Macrophages have been classified into two groups depending on their functional status, that is classically activated (M1) and alternatively activated (M2) macrophages. In malignancies, tumor associated macrophages (TAMs) have been traditionally considered to belong to the polarized M2 phenotype and can be identified using varies markers, such as CD163, CD23, IL-10, CXCR2 and others [40] M2-type TAMs decrease response to chemotherapy and radiotherapy, impair T cell infiltration and function, and promote immune evasion and tumor progression [40, 41]. Previous groups have investigated the prognostic impact of macrophages and reported an adverse impact on outcome [42, 43] but their association with the desmoplastic stroma in human samples remains unexplored. We failed to detect a significant clinical role for total CD68 expression. Instead, high tumor compartment CD68 expression predicted for worse outcome in the entire cohort, similar to stromal compartment CD68 infiltration in loose density tumors. Thus, immune markers should be examined in the context of tumor compartment and desmoplastic stroma, as analysis of their total expression in isolation can “mask” their prognostic impact in patient subgroups. These data are also important with the progressively increased testing of agents targeting macrophages, such as colony-stimulating factor 1 (CSF1) inhibitors [44] in the clinical setting.
Moreover, we did not find a prognostic significance for B cells in our series. B cells constitute effector cells and mediate cellular immunity via antigen-presentation, promoting tumor-specific activation of cytotoxic T cells [45] but their prognostic role has been controversial. Castino et al. recently demonstrated that the vast majority of B cells were located in lymphoid aggregates in close association with T cells and TAMs, as in our present series [8]. High B cell expression in lymphoid aggregates correlated with a better outcome. In contrast, expression throughout the rest of the tumor surface was only scarce, and stromal infiltration failed to predict for outcome [8]. Recently, three preclinical studies reported a protumorigenic role for different B cell subpopulations via diverse mechanisms in PDAC [5–7]. Thus, it is likely that B cells can exert both pro- and antitumorigenic roles in PDAC, depending on the pathophysiological context and possibly tumor localization, highlighting their complexity.
Lymphoid aggregates constitute lymphoid-like structures that vary from T and B cells clusters to germinal-like centers, and have been previously described in cancer, infection and autoimmune diseases [46]. Mixed findings have been reported regarding their prognostic value [46]. In total n = 57 patients presented with lymphoid aggregates in our cohort. A recent study by Lutz et al. demonstrated lack of lymphoid aggregates in 54 previously untreated patients that received primary surgical resection [47], which is in contrast to our present findings. In that work, Lutz et al. found aggregates in 33 out of the 39 (84.6%) patients 2 weeks after administration of a GVAX vaccine [47]. The presence of either CD68+ or CD20+ cells in lymphoid aggregates did not possess a prognostic role in our series. Further reports on the impact of lymphoid aggregates in PDAC are lacking, possibly due to the fact that the majority of pathological investigations have been performed in TMAs rather than whole-mount sections.
We would like to acknowledge the limitations of our work. First, although patients were treated and followed up prospectively, the retrospective nature cannot exclude potential selection bias. Second, the median follow-up in our study is relatively short. Also, CD68 is a pan-macrophage marker, which does not provide any information with regard to the polarization status of macrophages, such as CD163 that is specific for M2-macrophages. Furthermore, the lack of automated confirmation of CD68 and CD20 constitutes another limitation. Finally, our observations warrant validation in prospective cohorts, preferably in large pancreatectomy sections.
In conclusion, in contrast to the current belief that PDAC is severely hypoxic, examination of entire pancreatectomy sections demonstrated hypoxia levels comparable to those described in others malignancies. Histological mapping of CA9 and CD31 staining showed inter- and intrapatient heterogeneity. Although CD31 and CD68 failed to demonstrate a prognostic role in the entire cohort, analysis revealed an adverse impact in the outcome of patient subgroups that varied with the tumor compartment and stromal density. Our findings provide important insight on the pathophysiology of PDAC and could be potentially exploited in future studies to guide novel therapeutics.
MATERIALS AND METHODS
Patients and treatment
During the period between 2009 and 2014 patients with previously-untreated PDAC received surgery followed by adjuvant chemotherapy at the Oxford University Hospital NHS Trust, Oxford, UK. The type of pancreatectomy performed was conducted according to international guidelines. Patients included in the present retrospective study had to meet the following criteria: histologically-confirmed PDAC, complete macroscopic surgical resection (R0 or R1), lack of metastatic spread and/or ascites, absence of previous history of malignancy, archived formalin-fixed paraffin-embedded (FFPE) surgical samples at the Department of Pathology. In total, n = 141 patients were included in the present study. The majority of patients were treated with adjuvant chemotherapy consisted of gemcitabine (GEM) as monotherapy. GEM alone was administered intravenously (dose 1,000 mg/m2 over 30 minutes), at days 1, 8 and 15 (1 cycle) for up to 6 cycles. Few patients received a combination of gemcitabine with capecitabine (GEM-CAP). In this case, GEM was administered as described above and CAP was administered orally (dose 830 mg/m2 twice daily) for 3 weeks followed by 1-week pause. FFPE tissue blocks were obtained from the Department of Pathology archive together with clinical follow-up data and diagnostic images at the Oxford University Hospital NHS Trust. Patients had previously provided an informed consent. The present study was approved by the Oxford Radcliffe Biobank, University of Oxford (Project: OCHRe 14/A176).
Immunohistochemical staining and scoring
An experienced gastrointestinal pathologist (LMW) reviewed the n = 141 pancreatomy samples. For the purpose of the present study, the best representative FFPE tissue block according to the following criteria: most representative of stromal morphology, least amount of necrosis highest cellularity. Sections (3-μm thick) were cut and mounted on coated superfrost slides. Slides were stained with haematoxylin and eosin (H&E) as previously reported [48]. The Leica Bond Max staining platform was used for the immunohistochemical studies at the Department of Pathology, Oxford University Hospital NHS Trust in conjuction with a DAKO Autostainer Link 48 (DAKO, UK) using a horseradish-peroxidase technique. The Leica DS 9800 detection system facilitated antibody detection. Automatic antigen retrieval was conducted by the pretreatment of the paraffin sections (SuperFrost Plus, Thermo Scientific, UK) with either Bond ER 1 (Citrate based buffer at Ph 6) or Bond ER2 (EDTA based buffer at Ph 9; both Leica Microsystems, UK) for 20 min on the Bond Max staining machine. After that, staining with the primary antibodies for CA9 (1:200; Leica, UK), CD31 (1:80 Dako, UK) was performed after incubation for 20 minutes on the Bond staining platform. Double staining for CD68 (Dako, UK) and CD20 (Dako, UK) was performed in a similar manner. Subsequently, slides were stained with dextran polymer-conjugated horseradish-peroxidase and 3,3′-diaminobenzidine (DAB) chromogen intensified with 1 % copper sulphate followed by a light haematoxylin counterstain (Gill 3, Sigma, UK).
To take into account the intratumoral heterogeneity and facilitate precise calculation of the percentage of surface area positive for CA9 and CD31 staining, the large pancreatectomy sections were scanned by Aperio ScanScope XT at × 20 magnification. We used the Positive Pixel Count Algorithm of the ImageScope Viewer (Aperio Technologies, Inc., Vista, CA, USA) to analyse the percentage of the tissue surface area that was positive for CA9 and CD31 in the large pancreatectomy sections. To investigate the prognostic role of hypoxia and vessel density, we used the median score value as a cut-off to classify patients into two groups: low or high CA9 and CD31 expression. Additionally, we examined the prognostic value of CA9 and CD31 in the context of the desmoplastic stroma density and activation. For that purpose, stromal density was assessed based on haematoxyllin-eosin staining (HE) into loose, moderate or strong stroma, whereas αSMA (stromal activation) was scored as high, moderate and low as recently reported [31].
The expression of CD68 and CD20 was assessed semiquantitatively by measuring cell density as previously reported [49, 50]. Immunohistochemical scoring was conducted as follows: (1) absent cells; (2) < 25% cell density; (3) 25–50% cell density; (4) > 50% cell density. Cells were assessed in all three compartments of the tumor: the intra-epithelial compartment (cells within and in direct contact with tumor cell nests); the stroma (cells within the intratumoral stroma) and the tumor periphery (cells localised in tumor periphery). The sum of the separate scores from the three tumor compartments (tumor, stromal and peripheral compartment) determined the total score for CD68 and CD20. The total score ranged from 3 to 12. The median score value was used as a cut-off to separate patients into two groups: low or high CD68 and CD20 expression. In addition, we examined the prognostic impact of CD68 and CD20 for each of the 3 different compartments separately. The median score of each area was measured and the cut-off point was chosen to separate the cohort into two subgroups with either low or high score. Stromal density was defined as loose, moderate or strong, whereas αSMA was classified as high, moderate [31]. Finally, the presence or absence of CD68 and CD20 expression was considered for estimating their prognostic value in lymphoid aggregates.
Statistics
The differences between categorical variables were anlysed with the Fisher’s exact test. Overall survival (OS) was calculated from the date of surgery to the day of death from any cause. Progression-free survival (PFS) was measured from the date of surgery to the day of local or distant recurrence, or death from any cause. Distant metastasis free survival (DMFS) and local progression free survival (LPFS) were assessed from the date of surgery to distant metastasis or death and local progress or death, respectively. Patients that lacked local or distant tumor recurrence were censored at the time of the last follow-up. A p-value lower than 0.05 was considered as statistically significant. The Kaplan-Meier method was used to plot the survival curves. Univariate analyses were made with the log-rank (Mantel–Cox) test and multivariate analyses with the Cox proportional hazard model. All statistical analyses were performed with the SPSS 20 software (SPSS Inc., Chicago, IL, USA).
ACKNOWLEDGMENTS AND FUNDING
This project has received funding from the European Union’s Horizon 2020 research and innovation programme under the Marie Skłodowska-Curie grant agreement No 642623. This work was funded in part by CRUK and the Kidani Memorial Trust.
CONFLICTS OF INTEREST
We hereby confirm that we have no conflicts of interest relevant to the present work.
REFERENCES
1. Hidalgo M. Pancreatic cancer. The New England journal of medicine. 2010; 362:1605–1617.
2. Heestand GM, Kurzrock R. Molecular landscape of pancreatic cancer: implications for current clinical trials. Oncotarget. 2015; 6:4553–4561. doi: 10.18632/oncotarget.2972.
3. Neesse A, Michl P, Frese KK, Feig C, Cook N, Jacobetz MA, Lolkema MP, Buchholz M, Olive KP, Gress TM, Tuveson DA. Stromal biology and therapy in pancreatic cancer. Gut. 2011; 60:861–868.
4. Fokas E, O’Neill E, Gordon-Weeks A, Mukherjee S, McKenna WG, Muschel RJ. Pancreatic ductal adenocarcinoma: From genetics to biology to radiobiology to oncoimmunology and all the way back to the clinic. Biochim Biophys Acta. 2015; 1855:61–82.
5. Gunderson AJ, Kaneda MM, Tsujikawa T, Nguyen AV, Affara NI, Ruffell B, Gorjestani S, Liudahl SM, Truitt M, Olson P, Kim G, Hanahan D, Tempero MA, et al. Bruton Tyrosine Kinase-Dependent Immune Cell Cross-talk Drives Pancreas Cancer. Cancer discovery. 2016; 6:270–285.
6. Lee KE, Spata M, Bayne LJ, Buza EL, Durham AC, Allman D, Vonderheide RH, Simon MC. Hif1a Deletion Reveals Pro-Neoplastic Function of B Cells in Pancreatic Neoplasia. Cancer discovery. 2016; 6:256–269.
7. Pylayeva-Gupta Y, Das S, Handler JS, Hajdu CH, Coffre M, Koralov SB, Bar-Sagi D. IL35-Producing B Cells Promote the Development of Pancreatic Neoplasia. Cancer discovery. 2016; 6:247–255.
8. Castino GF, Cortese N, Capretti G, Serio S, Di Caro G, Mineri R, Magrini E, Grizzi F, Cappello P, Novelli F, Spaggiari P, Roncalli M, Ridolfi C, et al. Spatial distribution of B cells predicts prognosis in human pancreatic adenocarcinoma. Oncoimmunology. 2016; 5:e1085147.
9. Fokas E, McKenna WG, Muschel RJ. The impact of tumor microenvironment on cancer treatment and its modulation by direct and indirect antivascular strategies. Cancer metastasis reviews. 2012; 31:823–842.
10. Carmeliet P, Jain RK. Principles and mechanisms of vessel normalization for cancer and other angiogenic diseases. Nature reviews Drug discovery. 2011; 10:417–427.
11. Semenza GL. Hypoxia-inducible factors in physiology and medicine. Cell. 2012; 148:399–408.
12. Miller BW, Morton JP, Pinese M, Saturno G, Jamieson NB, McGhee E, Timpson P, Leach J, McGarry L, Shanks E, Bailey P, Chang D, Oien K, et al. Targeting the LOX/hypoxia axis reverses many of the features that make pancreatic cancer deadly: inhibition of LOX abrogates metastasis and enhances drug efficacy. EMBO molecular medicine. 2015; 7:1063–1076.
13. Olive KP, Jacobetz MA, Davidson CJ, Gopinathan A, McIntyre D, Honess D, Madhu B, Goldgraben MA, Caldwell ME, Allard D, Frese KK, Denicola G, Feig C, et al. Inhibition of Hedgehog signaling enhances delivery of chemotherapy in a mouse model of pancreatic cancer. Science. 2009; 324:1457–1461.
14. Jacobetz MA, Chan DS, Neesse A, Bapiro TE, Cook N, Frese KK, Feig C, Nakagawa T, Caldwell ME, Zecchini HI, Lolkema MP, Jiang P, Kultti A, et al. Hyaluronan impairs vascular function and drug delivery in a mouse model of pancreatic cancer. Gut. 2013; 62:112–120.
15. Koong AC, Mehta VK, Le QT, Fisher GA, Terris DJ, Brown JM, Bastidas AJ, Vierra M. Pancreatic tumors show high levels of hypoxia. Int J Radiat Oncol Biol Phys. 2000; 48:919–922.
16. Buchler P, Reber HA, Lavey RS, Tomlinson J, Buchler MW, Friess H, Hines OJ. Tumor hypoxia correlates with metastatic tumor growth of pancreatic cancer in an orthotopic murine model. The Journal of surgical research. 2004; 120:295–303.
17. Hiraoka N, Ino Y, Sekine S, Tsuda H, Shimada K, Kosuge T, Zavada J, Yoshida M, Yamada K, Koyama T, Kanai Y. Tumour necrosis is a postoperative prognostic marker for pancreatic cancer patients with a high interobserver reproducibility in histological evaluation. British journal of cancer. 2010; 103:1057–1065.
18. Colbert LE, Fisher SB, Balci S, Saka B, Chen Z, Kim S, El-Rayes BF, Adsay NV, Maithel SK, Landry JC, Curran WJ, Jr. High nuclear hypoxia-inducible factor 1 alpha expression is a predictor of distant recurrence in patients with resected pancreatic adenocarcinoma. Int J Radiat Oncol Biol Phys. 2015; 91:631–639.
19. Koong AC, Mehta VK, Le QT, Fisher GA, Terris DJ, Brown JM, Bastidas AJ, Vierra M. Pancreatic tumors show high levels of hypoxia. Int J Radiat Oncol Biol Phys. 2000; 48:919–922.
20. Provenzano PP, Cuevas C, Chang AE, Goel VK, Von Hoff DD, Hingorani SR. Enzymatic targeting of the stroma ablates physical barriers to treatment of pancreatic ductal adenocarcinoma. Cancer cell. 2012; 21:418–429.
21. Sherman MH, Yu RT, Engle DD, Ding N, Atkins AR, Tiriac H, Collisson EA, Connor F, Van Dyke T, Kozlov S, Martin P, Tseng TW, Dawson DW, et al. Vitamin D receptor-mediated stromal reprogramming suppresses pancreatitis and enhances pancreatic cancer therapy. Cell. 2014; 159:80–93.
22. Froeling FE, Feig C, Chelala C, Dobson R, Mein CE, Tuveson DA, Clevers H, Hart IR, Kocher HM. Retinoic acid-induced pancreatic stellate cell quiescence reduces paracrine Wnt-beta-catenin signaling to slow tumor progression. Gastroenterology. 2011; 141:1486–1497, 1497 e1481–1414.
23. Rhim AD, Oberstein PE, Thomas DH, Mirek ET, Palermo CF, Sastra SA, Dekleva EN, Saunders T, Becerra CP, Tattersall IW, Westphalen CB, Kitajewski J, Fernandez-Barrena MG, et al. Stromal elements act to restrain, rather than support, pancreatic ductal adenocarcinoma. Cancer cell. 2014; 25:735–747.
24. Chauhan VP, Boucher Y, Ferrone CR, Roberge S, Martin JD, Stylianopoulos T, Bardeesy N, DePinho RA, Padera TP, Munn LL, Jain RK. Compression of pancreatic tumor blood vessels by hyaluronan is caused by solid stress and not interstitial fluid pressure. Cancer cell. 2014; 26:14–15.
25. Ozdemir BC, Pentcheva-Hoang T, Carstens JL, Zheng X, Wu CC, Simpson TR, Laklai H, Sugimoto H, Kahlert C, Novitskiy SV, De Jesus-Acosta A, Sharma P, Heidari P, et al. Depletion of carcinoma-associated fibroblasts and fibrosis induces immunosuppression and accelerates pancreas cancer with reduced survival. Cancer cell. 2014; 25:719–734.
26. Neesse A, Algul H, Tuveson DA, Gress TM. Stromal biology and therapy in pancreatic cancer: a changing paradigm. Gut. 2015; 64:1476–1484.
27. van der Zee JA, van Eijck CH, Hop WC, van Dekken H, Dicheva BM, Seynhaeve AL, Koning GA, Eggermont AM and ten Hagen TL. Angiogenesis: a prognostic determinant in pancreatic cancer? European journal of cancer. 2011; 47:2576–2584.
28. Khorana AA, Ahrendt SA, Ryan CK, Francis CW, Hruban RH, Hu YC, Hostetter G, Harvey J, Taubman MB. Tissue factor expression, angiogenesis, and thrombosis in pancreatic cancer. Clinical cancer research. 2007; 13:2870–2875.
29. Giannopoulos G, Kavantzas N, Parasi A, Tiniakos D, Peros G, Tzanakis N, Patsouris E, Pavlakis K. Morphometric microvascular characteristics in the prognosis of pancreatic and ampullary carcinoma. Pancreas. 2007; 35:47–52.
30. Niedergethmann M, Hildenbrand R, Wostbrock B, Hartel M, Sturm JW, Richter A, Post S. High expression of vascular endothelial growth factor predicts early recurrence and poor prognosis after curative resection for ductal adenocarcinoma of the pancreas. Pancreas. 2002; 25:122–129.
31. Wang LM, Silva MA, D’Costa Z, Bockelmann R, Soonawalla Z, Liu S, O’Neill E, Mukherjee S, McKenna WG, Muschel R, Fokas E. The prognostic role of desmoplastic stroma in pancreatic ductal adenocarcinoma. Oncotarget. 2015; 7:4183–94. doi: 10.18632/oncotarget.6770.
32. Sinn M, Denkert C, Striefler JK, Pelzer U, Stieler JM, Bahra M, Lohneis P, Dorken B, Oettle H, Riess H, Sinn BV. alpha-Smooth muscle actin expression and desmoplastic stromal reaction in pancreatic cancer: results from the CONKO-001 study. British journal of cancer. 2014; 111:1917–1923.
33. Bever KM, Sugar EA, Bigelow E, Sharma R, Laheru D, Wolfgang CL, Jaffee EM, Anders RA, De Jesus-Acosta A, Zheng L. The prognostic value of stroma in pancreatic cancer in patients receiving adjuvant therapy. HPB (Oxford). 2015; 17:292–298.
34. Diana A, Wang LM, D’Costa Z, Allen P, Azad A, Silva MA, Soonawalla Z, Liu S, McKenna WG, Muschel RJ, Fokas E. Prognostic value, localization and correlation of PD-1/PD-L1, CD8 and FOXP3 with the desmoplastic stroma in pancreatic ductal adenocarcinoma. Oncotarget. 2016; 7:40992–41004. doi: 10.18632/oncotarget.10038.
35. Dhani NC, Serra S, Pintilie M, Schwock J, Xu J, Gallinger S, Hill RP, Hedley DW. Analysis of the intra- and intertumoral heterogeneity of hypoxia in pancreatic cancer patients receiving the nitroimidazole tracer pimonidazole. British journal of cancer. 2015; 113:864–871.
36. Borad MJ, Reddy SG, Bahary N, Uronis HE, Sigal D, Cohn AL, Schelman WR, Stephenson J, Jr., Chiorean EG, Rosen PJ, Ulrich B, Dragovich T, Del Prete SA, et al. Randomized Phase II Trial of Gemcitabine Plus TH-302 Versus Gemcitabine in Patients With Advanced Pancreatic Cancer. J Clin Oncol. 2015; 33:1475–1481.
37. Lohse I, Rasowski J, Cao P, Pintilie M, Do T, Tsao MS, Hill RP, Hedley DW. Targeting hypoxic microenvironment of pancreatic xenografts with the hypoxia-activated prodrug TH-302. Oncotarget. 2016; 7:33571–80. doi: 10.18632/oncotarget.9654.
38. Banerjee SK, Zoubine MN, Mullick M, Weston AP, Cherian R, Campbell DR. Tumor angiogenesis in chronic pancreatitis and pancreatic adenocarcinoma: impact of K-ras mutations. Pancreas. 2000; 20:248–255.
39. Fokas E, Im JH, Hill S, Yameen S, Stratford M, Beech J, Hackl W, Maira SM, Bernhard EJ, McKenna WG, Muschel RJ. Dual inhibition of the PI3K/mTOR pathway increases tumor radiosensitivity by normalizing tumor vasculature. Cancer research. 2012; 72:239–248.
40. Noy R, Pollard JW. Tumor-associated macrophages: from mechanisms to therapy. Immunity. 2014; 41:49–61.
41. Beatty GL, Winograd R, Evans RA, Long KB, Luque SL, Lee JW, Clendenin C, Gladney WL, Knoblock DM, Guirnalda PD, Vonderheide RH. Exclusion of T Cells From Pancreatic Carcinomas in Mice Is Regulated by Ly6C(low) F4/80(+) Extratumoral Macrophages. Gastroenterology. 2015; 149:201–210.
42. Ino Y, Yamazaki-Itoh R, Shimada K, Iwasaki M, Kosuge T, Kanai Y, Hiraoka N. Immune cell infiltration as an indicator of the immune microenvironment of pancreatic cancer. British journal of cancer. 2013; 108:914–923.
43. Ruffell B, Coussens LM. Macrophages and therapeutic resistance in cancer. Cancer cell. 2015; 27:462–472.
44. Ries CH, Cannarile MA, Hoves S, Benz J, Wartha K, Runza V, Rey-Giraud F, Pradel LP, Feuerhake F, Klaman I, Jones T, Jucknischke U, Scheiblich S, Kaluza K, et al. Targeting tumor-associated macrophages with anti-CSF-1R antibody reveals a strategy for cancer therapy. Cancer cell. 2014; 25:846–859.
45. Gunderson AJ, Coussens LM. B cells and their mediators as targets for therapy in solid tumors. Experimental cell research. 2013; 319:1644–1649.
46. Husain K, Centeno BA, Chen DT, Hingorani SR, Sebti SM, Malafa MP. Vitamin E delta-tocotrienol prolongs survival in the LSL-KrasG12D/+;LSL-Trp53R172H/+;Pdx-1-Cre (KPC) transgenic mouse model of pancreatic cancer. Cancer prevention research. 2013; 6:1074–1083.
47. Lutz ER, Wu AA, Bigelow E, Sharma R, Mo G, Soares K, Solt S, Dorman A, Wamwea A, Yager A, Laheru D, Wolfgang CL, Wang J, et al. Immunotherapy converts nonimmunogenic pancreatic tumors into immunogenic foci of immune regulation. Cancer immunology research. 2014; 2:616–631.
48. Wang LM, Kevans D, Mulcahy H, O’Sullivan J, Fennelly D, Hyland J, O’Donoghue D, Sheahan K. Tumor budding is a strong and reproducible prognostic marker in T3N0 colorectal cancer. The American journal of surgical pathology. 2009; 33:134–141.
49. Dahlin AM, Henriksson ML, Van Guelpen B, Stenling R, Oberg A, Rutegard J, Palmqvist R. Colorectal cancer prognosis depends on T-cell infiltration and molecular characteristics of the tumor. Mod Pathol. 2011; 24:671–682.
50. Balermpas P, Michel Y, Wagenblast J, Seitz O, Weiss C, Rodel F, Rodel C, Fokas E. Tumour-infiltrating lymphocytes predict response to definitive chemoradiotherapy in head and neck cancer. Br J Cancer. 2014; 110:547.