
INTRODUCTION
Metastatic breast cancer (MBC), which is largely incurable, poses a major challenge to the management of breast cancer. Human epidermal growth factor receptor 2 (HER2)-positive breast cancer accounts for approximately 20-30% of total breast cancer cases and is associated with inferior prognosis compared to HER2-negative subtypes [1–5]. Despite the established efficacy of standard anti-HER2 therapy and emerging therapeutic options in the breast medical oncology armamentarium, precise evaluation of response to treatment in the metastatic setting remains problematic in clinical practice. Serial assessment by radiological imaging may be inconclusive and fail to rapidly detect drug resistance. In addition, it is clinically crucial to identify resistance-conferring genomic events, particularly in heavily treated cases, so as to disclose actionable targets for subsequent therapy. Tumor genotyping by repeated tissue biopsies is subjected to spatial selection bias [6, 7] and precluded by complications associated with this procedure [8]. Hence, non-invasive biomarkers that can be utilized to monitor the disease in real-time and molecularly characterize drug resistance are urgently needed.
The clinical application of circulating tumor DNA (ctDNA) as a “liquid biopsy” has been investigated in recent years [9]. ctDNA, which carries tumor-specific genetic alterations, is shed by tumor cells into the bloodstream and represents only a small fraction of cell-free DNA (cfDNA) [10, 11]. ctDNA can be employed to monitor tumor dynamics in multiple malignancies including breast cancer [12, 13]. In a proof-of-concept study, Dawson et al evaluated ctDNA in serially collected blood samples from patients with MBC and determined that ctDNA exhibited greater correlation with changes in tumor burden than circulating tumor cells (CTCs) and CA15-3 [14]. Moreover, it is feasible to capture resistance to targeted therapy, either intrinsic or acquired, and determine the molecular basis by profiling ctDNA in cancer [15–18].
However, most studies incorporating ctDNA assay into disease monitoring interrogated only one or a few genes and failed to develop workable criteria to inform clinical practice. Multigene mechanisms have been implicated in resistance to HER2 blockade agents [19–22]. Hence we hypothesized that serial gene-panel sequencing of ctDNA would be sensitive and accurate in identifying therapeutic resistance. The current study was conducted in the setting of a prospective clinical trial which evaluated the safety and efficacy of pyrotinib in HER2-positive MBC [23]. Pyrotinib is a novel small molecule tyrosine kinase inhibitor (TKI) which has irreversible inhibitory capacity towards HER1 and HER2. Patients who had been previously exposed to anti-HER2 TKIs were excluded from the trial. Preliminary data showed its manageable toxicity and promising anti-tumor activity, with an overall objective response rate (ORR) of 52.8% and median progression-free survival (PFS) of 35.3 weeks [23]. We exploited ctDNA from serially collected samples to identify resistance-related tumor genetic alterations and made an initial attempt to establish ctDNA-based criteria to detect resistance to anti-HER2 therapy.
RESULTS
Patients and samples
In total, 18 patients (Supplementary Table S1) whose diseases were histologically confirmed as HER2 positive before enrollment were evaluated in the present study. The other participants of the clinical trial who did not give consent to sample collection were excluded from the current analysis. 52 prospectively collected plasma samples and temporally matched peripheral blood cells were assayed for somatic genomic alterations by target-capture next-generation sequencing (NGS). A panel of 368 genes was interrogated in the present study (Supplementary Table S2). The average sequencing coverage depth of 52 plasma samples was 704-fold, and the coverage rate of the target region was >99% (Supplementary Table S3).
Identification of somatic genome alterations
We identified copy number variants (CNVs) in 17 out of 18 (94.4%) patients and in 33 of 52 (63.5%) plasma samples by analyzing the sequencing data for plasma matched with blood cells from the same patient (Supplementary Table S4). Amplification of the ERBB2 gene, which encodes the HER2 protein, was predominant and identified in 13 of 18 (72.2%) patients and 20 of 52 (38.5%) plasma samples. In addition, ctDNA sequencing identified other less common CNVs in the study population. Elevated levels of CDK12 were present in 6 of 52 plasma samples (11.5%), all of which were characterized by ERBB2 and CDK12 co-amplification. Moreover, deletions of the NFKBIA and HLA-A genes were recurrently captured in 6 (11.5%) and 5 (9.6%) samples. Amplification of GAB2 and RPS6KB1 was detected in the baseline plasma of 2 patients (GAB2 for No. 7 and RPS6KB1 for No. 16) but not in samples collected thereafter.
Point mutations in breast cancer-related genes were present in 49 of 52 (94.2%) plasma samples and all 18 patients (Supplementary Table S5). Mutations in the hotspot genes TP53 and PIK3CA were recurrently detected in 8 (44.4%) and 7 (27.8%) patients, respectively. Variants in other frequently mutated genes, i.e., ATM/BRCA2/ERBB2, were also identified. We also captured rarely documented somatic mutations in the genes CDK12, ROS1 and TSC2. CDK12 is a key regulator of transcription and has been correlated with homologous recombination (HR) repair defects in ovarian cancer [24]. A nonsense mutation in CDK12 (c.3724C>T, p.R1242*) was identified in the baseline and second cycle plasma of patient No. 12.
In summary, somatic genomic alterations in ctDNA including CNVs and point mutations were identified in 50 of 52 (96.2%) blood samples and all 18 patients (100%).
Serial monitoring of genome alterations in ctDNA
As is always true in administration of anti-HER2 targeted therapy, it’s crucial to evaluate the status of HER2 amplification before initiation of treatment. At baseline we identified HER2 amplification in only 9 of 18 patients (50.0%) who presented with HER2-positive tumors at diagnosis by histologic review. The status of HER2 amplification at baseline was not informative because we failed to observe an association between initial ctDNA assay results and the best response achieved. Nevertheless, by comparing the performance of serial ctDNA assays with that of consecutive radiological assessments we found that the dynamics of HER2 copy number rather than baseline HER2 amplification status correlated with response to targeted therapy in the real-time management of MBC.
Patient No. 3 is illustrative of the relationship between HER2 copy number dynamics and outcome (Figure 1A). HER2 amplified copies were not identified in the ctDNA prior to treatment and remained undetectable after cycle 2 (C2), which coincided with a slight decrease in the tumor load. However, a notable rise in the HER2 copy number was captured after C4, which further increased until the clinical establishment of disease progression after C6. In other words, monitoring for drug resistance via HER2 CNV dynamics in ctDNA provided 8 weeks’ lead time compared with conventional imaging methods.
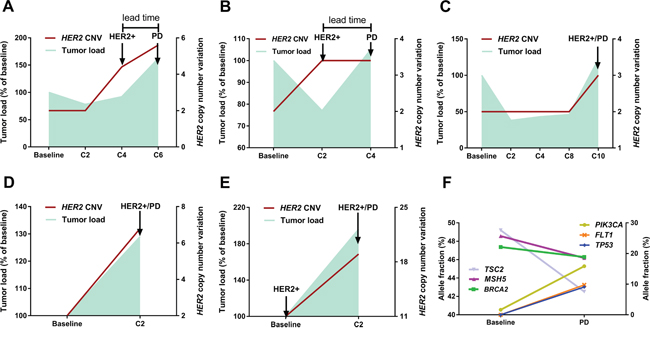
Figure 1: Serial monitoring of genomic alterations in ctDNA. (panel A, patient No.3) A typical case illustrates the relationship between fluctuation patterns of HER2 copy number (right Y axis) and dynamics of tumor load (left Y axis). Notably, HER2 amplification in ctDNA was identified 8 weeks earlier than the clinical establishment of disease progression by CT. (panel B, patient No.2) The tumor load moderately decreased after C2 whereas HER2 copy number was elevated, which was followed by immediate disease progression after C4. (panel C, patient No.17; panel D, patient No.5; panel E, patient No.8) Notable increase in HER2 copy number and tumor burden was concurrently detected, regardless of HER2 status at baseline. (panel F, patient No.5) Dynamic ctDNA profiling revealed intra-tumor heterogeneity and clonal evolution, as evidenced by the diverging patterns of fluctuation in identified mutations. The left Y axis refers to the allele fractions of mutations in genes TSC2/MSH5/BRAC2 and the right Y axis to genes PIK3CA/FLT1/TP53.
The relationship between fluctuation patterns of HER2 CNV and tumor dynamics was also observed in other cases which were demonstrated in Figure 1 (panel B, C, D, E). For patient No.2 (Figure 1B), the tumor load moderately decreased after C2 whereas HER2 copy number was elevated in the ctDNA, which was followed by immediate disease progression after C4. This case together with patient No.3 indicated that ctDNA assays might provide early detection of resistance compared with conventional methods. Shown in panels C (patient No.17), D (patient No.5) and E (patient No.8) is the concurrent detection of notable increase in HER2 copy number and tumor burden, regardless of HER2 status at baseline.
Moreover, dynamic profiling of somatic mutations in ctDNA identified intra-tumor heterogeneity and resistance-mediating mechanisms. For example, in a patient (No. 5, Figure 1F) diagnosed with multiple liver and bone metastases, a set of gene mutations (BRCA2, MSH5 and TSC2) dominated in the baseline plasma while the fraction of PIK3CA mutation was low. Subsequent analysis of the plasma collected prior to the establishment of progressive disease revealed diverging patterns in the fractions of mutated genes, with an evident increase in the PIK3CA mutation level and moderate decrease in the levels of previously dominant genes. These changes indicated that they derived from different subclones and thus added evidence of intra-tumor heterogeneity. Importantly, we identified much more mutations in the C2 sample than at baseline, with a noticeable rise in the fractions of mutated TP53 and FLT1 (Figure 1F), which suggested the increase of clonal heterogeneity at the metastatic sites. Elevation in the level of PIK3CA mutation as well as subclonity might account for the observed immediate resistance to targeted therapy.
ctDNA profiling to identify genomic patterns of resistance
Events of progressive disease occurred in 14 of 18 patients, and primary therapeutic resistance was identified in 6 of them (6/14, 42.9%). For the subset of patients with primary resistance (n=6), the results of pre- and post-treatment ctDNA assays were compared so as to generate clues about the sources of resistance to anti-HER2 therapy.
First and foremost, HER2 amplification in ctDNA concurred with disease progression in 4 patients (4/6, 66.7%) irrespective of HER2 status at baseline. However, we failed to capture HER2 amplification in the ctDNA of the other two patients when a definite increase in the tumor burden was recognized, indicating the role of other resistance-conferring mechanisms. As summarized in Table 1, somatic mutations in gene TP53 were identified in 3 of 6 patients (50.0%) with primary resistance to anti-HER2 therapy. Other putative mechanisms included variants in genes implicated in the PI3K/Akt/mTOR signaling pathway, i.e. PIK3CA/PTEN/MTOR (3/6, 50.0%).
Table 1: Genetic alterations in ctDNA associated with resistance to anti-HER2 therapy
Patient ID |
Resistance |
Gene |
Mutation (CDS) |
Mutation (Amino Acid) |
Oncogenic alteration in COSMIC database |
|---|---|---|---|---|---|
5 |
Primary |
PIK3CA |
c.[3140A>G] |
p.[H1047R] |
Yes |
|
|
ERBB2 |
c.[3235G>A] |
p.[E1079K] |
Yes |
|
|
MTOR |
c.[6286G>C] |
p.[D2096H] |
— |
|
|
ERBB2 |
Amplification |
— |
Yes |
|
|
CDK12 |
Amplification |
— |
Yes |
|
|
TP53 |
c.[811G>T] |
p.[E271*] |
Yes |
8 |
Primary |
ERBB2 |
Amplification |
— |
Yes |
|
|
ROS1 |
c.[6316G>A] |
p.[A2106T] |
Yes |
9 |
Primary |
ATM |
c.[8246A>T] |
p.[K2749I] |
— |
|
|
TP53 |
c.[392A>G] |
p.[N131S] |
Yes |
|
|
NOTCH1 |
c.[4319_4320insC] |
p.[I1440fs*?] |
— |
11 |
Primary |
ERBB2 |
Amplification |
— |
Yes |
|
|
CDK12 |
Amplification |
— |
Yes |
|
|
MED12 |
c.[3745C>A] |
p.[L1249I] |
— |
|
|
MSH2 |
c.[1742T>G] |
p.[I581S] |
— |
12 |
Primary |
ERBB2 |
Amplification |
— |
Yes |
|
|
TP53 |
c.[706T>A] |
p.[Y236N] |
Yes |
14 |
Primary |
PIK3CA |
c.[1035T>A] |
p.[N345K] |
Yes |
|
|
CCND1 |
Amplification |
— |
— |
|
|
FGF19 |
Amplification |
— |
— |
|
|
FGF3 |
Amplification |
— |
— |
|
|
FGF4 |
Amplification |
— |
— |
|
|
GPR124 |
Amplification |
— |
— |
2 |
Acquired |
CROT |
c.[1152A>C] |
p.[K384N] |
— |
|
|
ERBB2 |
Amplification |
— |
Yes |
|
|
CDK12 |
Amplification |
— |
Yes |
|
|
DOT1L |
c.[967G>A] |
p.[E323K] |
— |
3 |
Acquired |
PIK3CA |
c.[3140A>G] |
p.[H1047R] |
Yes |
|
|
ERBB2 |
Amplification |
— |
Yes |
|
|
CDK12 |
Amplification |
— |
Yes |
|
|
TP53 |
c.[375+2T>G] |
— |
Yes |
4 |
Acquired |
PIK3CA |
c.[3140A>G] |
p.[H1047R] |
Yes |
|
|
TP53 |
c.[318C>G] |
p.[S106R] |
Yes |
6 |
Acquired |
RPS14 |
c.[218C>A] |
p.[A73D] |
— |
7 |
Acquired |
ERBB2 |
Amplification |
— |
Yes |
|
|
TP53 |
c.[497C>G] |
p.[S166*] |
Yes |
15 |
Acquired |
MTOR |
c.[1077C>A] |
p.[S359R] |
— |
17 |
Acquired |
TP53 |
c.[672+1G>T] |
— |
Yes |
|
|
PIK3CA |
c.[1637A>G] |
p.[Q546R] |
Yes |
|
|
TP53 |
c.[833C>G] |
p.[P278R] |
Yes |
|
|
ERBB2 |
Amplification |
— |
Yes |
|
|
PIK3CA |
c.[3140A>G] |
p.[H1047R] |
Yes |
18 |
Acquired |
ERBB2 |
c.[2264T>C] |
p.[L755S] |
Yes |
|
|
PTEN |
c.[511C>T] |
p.[Q171*] |
Yes |
|
|
PIK3CA |
c.[1624G>A] |
p.[E542K] |
Yes |
With regards to the patients with acquired resistance (N=8), serial ctDNA sequencing has revealed similar findings. HER2 amplification was identified in 7 of 8 patients. When the tumors responded to the therapy (SD/PR) HER2 amplified copies were infrequently detected (3/14 samples, 21.4%), whereas at disease progression HER2 amplification was present in ctDNA in 4 out of 7 samples (4/7, 57.1%). All of the patients had mutations detected. The most frequent mutations identified were PIK3CA/PTEN/MTOR (5/8, 62.5%), followed by TP53 (4/8, 50%). Fluctuations in allele fraction (AF) of dominant mutations generally correlated with tumor burden reflected by imaging method, with increased AF concurring with or even preluding disease progression (Figure 2).
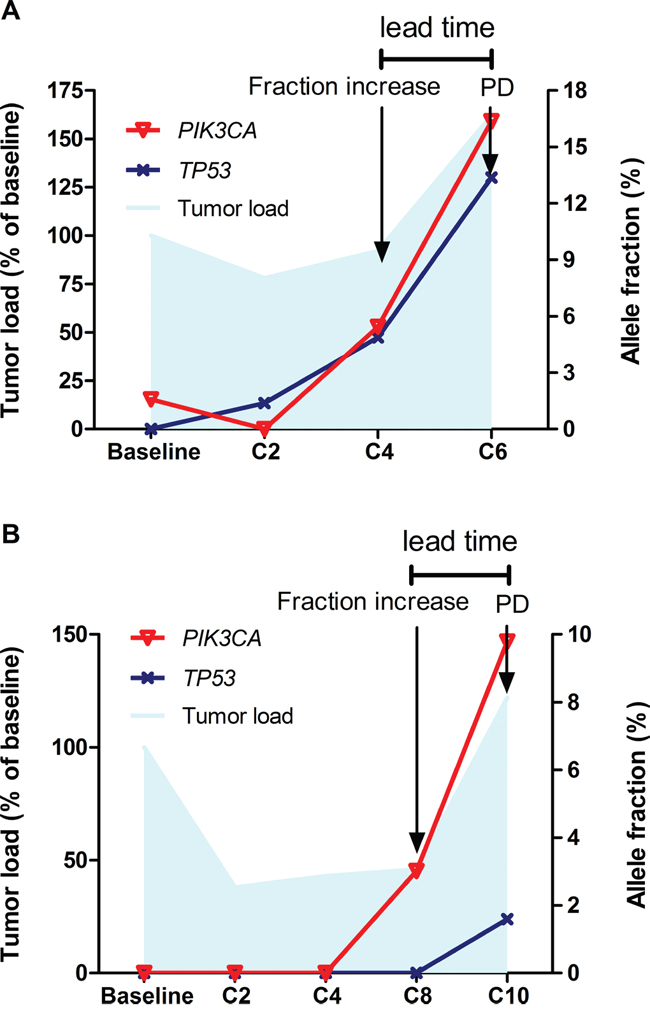
Figure 2: Dynamics of somatic mutations in ctDNA. Fluctuations in allele fraction of somatic mutations (right Y axis) generally correlated with tumor burden reflected by imaging method (left Y axis), with increased allele fraction concurring with or even preluding disease progression (panel A., patient No.3; panel B., patient No.17).
Together, based on the dominant markers of resistance described above, we identified 4 patterns of change in ctDNA at the onset of resistance to anti-HER2 therapy as shown by Figure 3. Among the patients with primary or acquired drug resistance (N=14), 5 patients (35.7%) exhibited concurring HER2 amplification and mutations in genes TP53/PIK3CA/MTOR/PTEN. Alterations in these genes have been previously demonstrated to correlate with resistance to HER2 targeted therapeutics. In 8 patients either HER2 amplification (N=3, 21.4%) or mutations in the genes specified above (N=5, 35.7%) were detected in the ctDNA at disease progression. There was one patient (No. 6) displaying neither HER2 amplification nor important mutations but we captured a mutation in RSP14 prior to progression which might be associated with treatment failure.
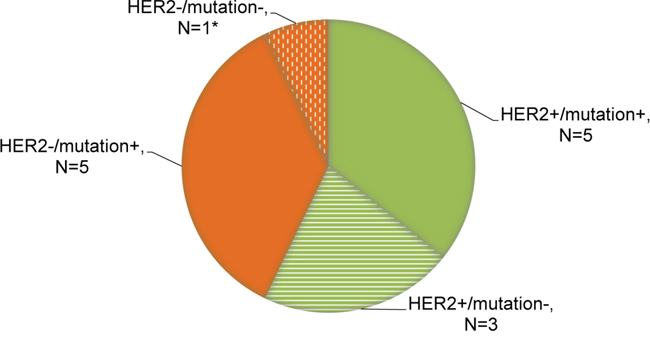
Figure 3: Distribution of genomic patterns of resistance to anti-HER2 therapy. Relevant mutations involve genes TP53/PIK3CA/MTOR/PTEN, all of which have been identified to correlate with resistance to anti-HER2 therapy. *Patient No. 6 displayed neither HER2 amplification nor specific mutations but we captured a mutation in RSP14 prior to progression which might be associated with treatment failure.
Use of ctDNA-based criteria to monitor resistance to targeted therapy
As stated above, ctDNA sequencing enabled the personalized and dynamic profiling of the tumor molecular landscape, which may be exploited to elucidate the tumor genomic response and monitor resistance to targeted therapy. The findings of the present and previous studies indicate that the predictive power of a single-gene-based ctDNA assay is limited in monitoring response to treatment. Here, we proposed a set of combined criteria that could be adopted to identify resistance to HER1/HER2 blockade in HER2-positive MBC. Drug resistance should be indicated during treatment if any of the following situations applies: 1) recurrence or persistence of HER2 amplification in the blood; 2) emergence or ≥20% increase in the fraction of mutations in any of these resistance-related genes including TP53/PIK3CA/MTOR/PTEN. We set the threshold value for the increase of AF as 20% after allowing for the margin of error in ctDNA assay.
Table 2 compares the performance of ctDNA profiling of 34 plasma samples with that of temporally matched CT scans. Specifically, ctDNA analysis utilizing the combined criteria was a highly sensitive approach (sensitivity 85.7%) to detect drug resistance confirmed by CT. However, the relatively low specificity (55.0%) of this method should be interpreted with caution because the discordant evaluations (progression by ctDNA/non-progression by CT, false positivity) were ascribed to the inefficient reflection of tumor response by CT in some cases. After adjusting for this caveat in cases in which ctDNA assay identified resistance earlier than CT (N=6), we obtained a concordance rate up to 82.1%, confirming the robustness of this approach.
Table 2: Comparison of ctDNA assay with CT scans to monitor resistance to anti-HER2 therapy
N (%) |
CT |
Concordance rate (%) a |
Adjusted concordance rate (%) b |
|
|---|---|---|---|---|
Progression |
Non-progression |
|||
HER2 amplification |
|
|
73.5 |
80.6 |
Progression |
8 (57.1) |
3 (15.0) |
|
|
Non-progression |
6 (42.9) |
17 (85.0) |
|
|
Somatic mutations c |
|
|
58.8 |
69.0 |
Progression |
8 (57.1) |
8 (40.0) |
|
|
Non-progression |
6 (42.9) |
12 (60.0) |
|
|
Combined ctDNA criteria |
|
|
67.6 |
82.1 |
Progression |
12 (85.7) |
9 (45.0) |
|
|
Non-progression |
2 (14.3) |
11 (55.0) |
|
|
aConcordance rate=Number of consistent evaluations by ctDNA assay and CT/total number of evaluations×100%
bIn some cases, ctDNA assay detected drug resistance earlier than CT did, as confirmed by subsequent imaging assessment. In that situation, the discordant evaluations (progression by ctDNA/non-progression by CT) were ascribed to the inefficient reflection of tumor response by CT and consequently were excluded when calculating the concordance rate.
cIn this criterion, relevant mutations involve genes TP53/PIK3CA/MTOR/PTEN, all of which have been identified as potential markers of resistance to anti-HER2 therapy.
Subsequently we sought to explore the prognostic value of ctDNA-based criteria in HER2-positive metastatic disease. Notably, patients with resistance determined by C2 ctDNA results displayed significantly shorter PFS (median 8.5 vs. 32.4 weeks, p=0.0007, Figure 4), suggesting the discriminating role of ctDNA criteria in the prognosis of MBC. The present study is not yet powered to prove that ctDNA-based criteria outperforms Response Evaluation Criteria In Solid Tumors (RECIST), which should be addressed in future study with larger cohorts.
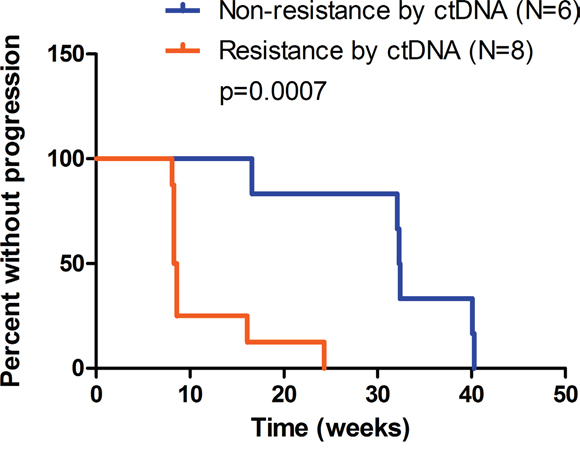
Figure 4. Progression-free survival (PFS) of patients with events of progressive disease (N=14). Based on sequencing data of C2 ctDNA, patients were evaluated as non-resistant (N=6) or resistant (N=8) using pre-defined ctDNA criteria. Non-resistance subset includes patient No.4, 6, 7, 15, 17, 18, and resistance subset includes patient No. 2, 3, 5, 8, 9, 11, 12, 14. Median PFS was 32.4 and 8.5 weeks respectively. P=0.0007 by log-rank test.
DISCUSSION
In the present study, we demonstrated that ctDNA genotyping using serially collected samples was an efficient and inherently specific approach to monitor resistance to targeted agent administration and identify emerging mechanisms of resistance in HER2-positive MBC. Compared with previous research, our study is the first to propose ctDNA-based criteria to determine resistance to HER1/HER2 blockade. We also made an initial attempt to investigate the tumor genomic response to anti-HER2 targeted therapy by ctDNA genotyping in the setting of a prospective clinical trial.
For patients with metastatic disease, it’s clinically important to precisely determine response and timely detect drug resistance. In this prospective study, we exploited longitudinal analysis of ctDNA to monitor resistance to HER1/HER2 blockade. We found that the dynamics of HER2 CNVs rather than baseline HER2 amplification status closely correlated with response to anti-HER2 therapy. Recurrence or persistence of HER2 amplified copies in the blood heralded resistance-related disease progression.
Nevertheless, the above-described pattern of HER2 CNV fluctuation was not captured in a considerable fraction of patients (6/14, 42.9%). We adopted target-capture NGS to characterize alterations in a panel of breast cancer-related genes and revealed resistance-related events other than HER2 CNVs. Putative mechanisms underpinning resistance to anti-HER2 therapy included up-regulation of the PI3K/Akt/mTOR pathway [20], PTEN mutation or loss of heterozygosity (LOH) [19, 20], accumulation of the p95 isoform of HER2 [25], signaling from HER family receptors [22] and insulin-like growth factor receptor [26, 27] and activation of estrogen receptor signaling [21]. Here we exploited pre- and post-treatment ctDNA profiling and found that mutations in TP53 and genes in the PI3K/Akt/mTOR pathway were heavily involved in resistance to HER1/HER2 blockade, adding evidence for the crucial role of these plausible mechanisms. Intriguingly, we also detected a moderate level of CDK12/ERBB2 co-amplification in resistant cases, but the biological relevance of this observation warrants further exploration.
Given that the agent used in our study is a dual EGFR/HER2 inhibitor, one important issue should be highlighted concerning the predictive value of EGFR alteration. Here alteration in gene EGFR (amplification) was identified in only one sample (patient No. 3, at disease progression). The very low detection rate of EGFR alteration (1/18, 5.6%) has prevented further exploration of its predictive value in our study. Previous findings indicated that EGFR mutations were rare if not absent in breast cancer [28, 29] and thus not a suitable predictor for anti-EGFR targeted therapy. Data on EGFR amplification rates in breast carcinomas has been inconsistent ranging from 0.8-28% [30–32]. Clinical trials evaluating the efficacy of anti-EGFR therapy in breast cancer have revealed disappointing outcomes [33–35], and correlative studies suggested that EGFR expression/amplification status was not a significant predictor [33, 35]. However, whether limited presence of EGFR amplification in ctDNA could predict resistance to dual EGFR/HER2 blockade has yet to be elucidated in future studies.
Our findings have several important implications. First, we demonstrated the clinical utility and validity of serial ctDNA profiling in precise delivery of targeted therapy in HER2-positive MBC. Based on our data, resistance to targeted therapy in HER2-positive MBC should be noted if ctDNA profiling reveals recurrence or persistence of CNVs in HER2, or increase in the fraction of certain mutations. These combined criteria exemplify how ctDNA sequencing data can be interpreted to determine drug resistance, which we expect to be useful in the management of various metastatic cancers. Although what degree of change is sufficient to cause shift in clinical management still merits further study, the results derived herein could at least provide hints for rational design of customized ctDNA assays in the future.
Besides, as a multiplex biomarker another purpose of ctDNA sequencing was to identify emerging mechanisms of resistance and propose candidate drug targets for salvage treatment. For example, regarding patients with obvious increase in the fraction of PI3KCA mutation before progression, predominant growth of PIK3CA mutation-carrying clone probably resulted in treatment failure and PI3K signaling blockade might be the optimal remedy for subsequent management.
Of note, our data convincingly demonstrated the validity of tumor clonal evolution theory. In some cases, we observed discordant patterns of change in somatic genomic mutations, suggesting that these mutations originated from different subclones and the selective pressure of therapeutic intervention finally led to the expansion of resistant clones. Genetic diversification as exemplified by an increase in clonal heterogeneity also promotes the territorial expansion of the tumor. Serial ctDNA analysis substantiated the reiterative and adaptive process of clonal evolution and provided further insights into disease biology.
The present research features several improvements over previous studies. First and foremost, earlier ctDNA studies were mostly retrospective and based on small cohorts, and the patients were treated with a mixture of various chemotherapeutic regimens, which precluded rational inter-study comparisons [36–39]. Conversely, our study was conducted in the setting of a prospective clinical trial, and the study population was uniformly exposed to anti-HER2 targeted therapy. Therefore, the major findings derived from our study would better fit into the practice and guide the optimal administration of HER2 blocking agents in HER2-positive MBC. Second, our study represents an initial attempt to propose a set of ctDNA-based criteria that can be readily used to assess resistance to HER2-targeted therapy during treatment. This actually helped narrow the gap between bench and bedside and further confirmed the clinical validity and utility of ctDNA profiling.
Despite the advantages delineated above, several limitations of our study should be noted. To start with, HER2 amplification was identified by ctDNA assay in only 13 of 18 patients at any time point, resulting in a relatively low concordance rate with tumor HER2 status (13/18, 72.2%). Although different timing of tissue (primary lesion) and plasma sampling (metastatic setting) may partly account for the disconcordance, possible methodological concerns were still explored. The sensitivity of the ctDNA assay might not suffice to accurately detect copy number variants which could be addressed in future study by improving the coverage depth of sequencing. This poor concordance could also be attributed to other technical issues such as inadequate plasma available for assay and high background levels of circulating wild-type DNA. Secondly, the threshold value for the degree of increase in the fraction of mutations was laid down at 20% so that optimal sensitivity/specificity of the ctDNA-based criteria could be derived, in a somewhat arbitrary way. The level of alteration in somatic mutations sufficient to initiate a change in clinical management needs to be specified in large-scale prospective trials. Thirdly, a comparison of genomic data from non-treated HER2-positive breast cancer patients is lacking, to be able to get a perspective of the therapy effect in driving HER2 CNVs and vice versa. Moreover, the small number of evaluable patients prevented rigorous statistical analysis, so the present study was less powered to arrive at statistically sound conclusions. Our findings derived from this proof-of-principle study, which represent a logical evolution in the field of ctDNA, warrant further validation in larger series of patients.
MATERIALS AND METHODS
Patients and sample collection
Blood samples were prospectively collected from patients with HER2-positive MBC who participated in a clinical trial (NCT01937689) evaluating the safety and efficacy of pyrotinib, an oral anti-HER1/HER2 tyrosine kinase inhibitor, which was administered daily on a 28 d/cycle regimen [23]. All enrolled patients provided written informed consent for serial blood collection and sample assay. The study was approved by the institutional review board of Cancer Hospital, Chinese Academy of Medical Sciences. Blood samples were collected before the initiation of treatment and after every two cycles of therapy until disease progression. Plasma was separated by centrifugation at 1,600 g for 10 min at 4°C and the supernatant was then centrifuged for a second time at 16,000g for 10 min at 4°C to remove the cellular components. Both plasma and peripheral blood cells were aliquoted and stored at −80 °C until ctDNA and genomic DNA (gDNA) extraction. In order to prevent lysis of white blood cell and thus preserve the integrity of ctDNA, blood samples were processed and frozen within 2 hours of sample collection.
DNA extraction
ctDNA and gDNA were extracted using the QIAamp Circulating Nucleic Acid Kit (Qiagen) and QIAamp DNA Blood Mini Kit (Qiagen) respectively, according to the manufacturer’s instructions. ctDNA was sequenced to detect somatic alterations, whereas gDNA was adopted as normal control.
Target capture and next-generation sequencing
A total of 368 genes were selected from four sources: 1) known oncogenes and tumor suppressor genes; 2) genes that are targets of agents approved by the FDA or have been assessed in clinical trials; 3) genes implicated in major cancer-related signaling pathways; 4) genes identified in the findings of the TCGA network which covers 12 cancer types. The target-capture region was 1.9 Mb in size and designed for all exons from 368 genes. Sequencing libraries were prepared from ctDNA using KAPA DNA Library Preparation Kits (Kapa Biosystems, Inc.), and gDNA sequencing libraries were prepared using the protocols recommended by the Illumina TruSeq DNA Library Preparation Kit. For samples close to the minimum input requirement, additional pre-capture PCR cycles were performed to generate sufficient PCR product for hybridization. The libraries were hybridized to the 1.9-Mb custom-designed probes (NimbleGen, Roche) of biotinylated oligonucleotides. DNA sequencing was performed on a HiSeq2500 sequencing system (Illumina, San Diego, CA) with 2*101 bp paired-end reads. The reads were aligned to the human genome build GRCh37 using BWA (a Burrows–Wheeler aligner). Somatic single nucleotide variant (sSNV) and indel calls were generated using MuTect and GATK, respectively. Somatic copy number alterations were identified with CONTRA (COpy Number Targeted Resequencing Analysis, Supplementary Figure S1).
Sequencing data analysis
All variants identified by the bioinformatics pipeline were manually reviewed by an experienced bioinformatics director to assess the quality of base calls, the mapping quality of the reads, and the overall read depth at the site. Variations meeting any of the criteria listed below were filtered: low base quality (Phred score <13) in all reads supporting the variation; mutant reads all in the plus or minus strand; all the reads with mutant allele did not meet mapping confidently (quality score >=30); reads support at variant position <3; and variants detected near the start/end of sequencing reads. For a given variant in plasma ctDNA, allele fraction = sequencing read count of alternate alleles / (sequencing read count of reference alleles + sequencing read count of alternate alleles) *100%.
Statistical analysis
Tumor burden was measured as the sum of the largest diameters of the target lesions. Clinical response was evaluated every two cycles as per RECIST v1.1 [40]. Primary resistance referred to disease progression on the first restaging CT scan, while acquired resistance was defined as progression after initial response to HER2 targeted therapy. PFS was defined as the interval between the initiation of treatment and the date of disease progression or death from any cause. Cases without progression or death events were censored at the date of last follow-up. Survival curves were estimated using the Kaplan–Meier method and unadjusted comparison of these estimates was performed using log-rank test. We assessed the clinical utility of ctDNA assay in monitoring drug resistance in terms of sensitivity, specificity and concordance rate. Using temporally paired plasma samples and CT scans, the concordance rate was defined as the number of consistent evaluations by ctDNA assay and CT out of the total number of evaluations (N=34). Sensitivity was calculated as the proportion of progression events decided by both ctDNA assay and CT scans among all the progression events established by CT (N=14). Specificity referred to the percentage of non-progression evaluations determined by both ctDNA assay and CT scans in total non-progression evaluations assessed by CT (N=20). All reported p values were two-sided, and p<0.05 was considered statistically significant. All statistical analyses were performed using SPSS version 19.0 (SPSS Company, Chicago, IL).
ACKNOWLEDGMENTS
We thank the staff from breast medical oncology unit at Cancer Hospital, Chinese Academy of Medical Sciences and Peking Union Medical College for their assistance in patient enrollment and sample collection.
CONFLICTS OF INTEREST
The authors disclose no potential conflicts of interest.
FUNDING
The present study was funded by Major Project of Beijing Municipal Science and Technology Commission [D161100000816004] and Beijing Hope Run Special Fund [LC2013L09].
REFERENCES
1. Slamon DJ, Clark GM, Wong SG, Levin WJ, Ullrich A, McGuire WL. Human breast cancer: correlation of relapse and survival with amplification of the HER-2/neu oncogene. Science. 1987; 235:177-182.
2. Slamon DJ, Godolphin W, Jones LA, Holt JA, Wong SG, Keith DE, Levin WJ, Stuart SG, Udove J, Ullrich A, et al. Studies of the HER-2/neu proto-oncogene in human breast and ovarian cancer. Science. 1989; 244:707-712.
3. Seshadri R, Firgaira FA, Horsfall DJ, McCaul K, Setlur V, Kitchen P. Clinical significance of HER-2/neu oncogene amplification in primary breast cancer. The South Australian Breast Cancer Study Group. J Clin Oncol. 1993; 11:1936-1942.
4. Press MF, Pike MC, Chazin VR, Hung G, Udove JA, Markowicz M, Danyluk J, Godolphin W, Sliwkowski M, Akita R. Her-2/neu expression in node-negative breast cancer: direct tissue quantitation by computerized image analysis and association of overexpression with increased risk of recurrent disease. Cancer Res. 1993; 53:4960-4970.
5. Ravdin PM, Chamness GC. The c-erbB-2 proto-oncogene as a prognostic and predictive marker in breast cancer: a paradigm for the development of other macromolecular markers--a review. Gene. 1995; 159:19-27.
6. Gerlinger M, Rowan AJ, Horswell S, Larkin J, Endesfelder D, Gronroos E, Martinez P, Matthews N, Stewart A, Tarpey P, Varela I, Phillimore B, Begum S, et al. Intratumor heterogeneity and branched evolution revealed by multiregion sequencing. N Engl J Med. 2012; 366:883-892.
7. Vogelstein B, Papadopoulos N, Velculescu VE, Zhou S, Diaz LA, Jr., Kinzler KW. Cancer genome landscapes. Science. 2013; 339:1546-1558.
8. Overman MJ, Modak J, Kopetz S, Murthy R, Yao JC, Hicks ME, Abbruzzese JL, Tam AL. Use of research biopsies in clinical trials: are risks and benefits adequately discussed? J Clin Oncol. 2013; 31:17-22.
9. Diaz LA, Jr., Bardelli A. Liquid biopsies: genotyping circulating tumor DNA. J Clin Oncol. 2014; 32:579-586.
10. Gormally E, Caboux E, Vineis P, Hainaut P. Circulating free DNA in plasma or serum as biomarker of carcinogenesis: practical aspects and biological significance. Mutat Res. 2007; 635:105-117.
11. Schwarzenbach H, Hoon DS, Pantel K. Cell-free nucleic acids as biomarkers in cancer patients. Nat Rev Cancer. 2011; 11:426-437.
12. Diehl F, Schmidt K, Choti MA, Romans K, Goodman S, Li M, Thornton K, Agrawal N, Sokoll L, Szabo SA, Kinzler KW, Vogelstein B, Diaz LA, Jr. Circulating mutant DNA to assess tumor dynamics. Nat Med. 2008; 14:985-990.
13. Forshew T, Murtaza M, Parkinson C, Gale D, Tsui DW, Kaper F, Dawson SJ, Piskorz AM, Jimenez-Linan M, Bentley D, Hadfield J, May AP, Caldas C, et al. Noninvasive identification and monitoring of cancer mutations by targeted deep sequencing of plasma DNA. Sci Transl Med. 2012; 4:136ra168.
14. Dawson SJ, Tsui DW, Murtaza M, Biggs H, Rueda OM, Chin SF, Dunning MJ, Gale D, Forshew T, Mahler-Araujo B, Rajan S, Humphray S, Becq J, et al. Analysis of circulating tumor DNA to monitor metastatic breast cancer. N Engl J Med. 2013; 368:1199-1209.
15. Diaz LA, Jr., Williams RT, Wu J, Kinde I, Hecht JR, Berlin J, Allen B, Bozic I, Reiter JG, Nowak MA, Kinzler KW, Oliner KS, Vogelstein B. The molecular evolution of acquired resistance to targeted EGFR blockade in colorectal cancers. Nature. 2012; 486:537-540.
16. Misale S, Yaeger R, Hobor S, Scala E, Janakiraman M, Liska D, Valtorta E, Schiavo R, Buscarino M, Siravegna G, Bencardino K, Cercek A, Chen CT, et al. Emergence of KRAS mutations and acquired resistance to anti-EGFR therapy in colorectal cancer. Nature. 2012; 486:532-536.
17. Siravegna G, Mussolin B, Buscarino M, Corti G. Clonal evolution and resistance to EGFR blockade in the blood of colorectal cancer patients. Nat Med. 2015; 21:795-801.
18. Murtaza M, Dawson SJ, Tsui DW, Gale D, Forshew T, Piskorz AM, Parkinson C, Chin SF, Kingsbury Z, Wong AS, Marass F, Humphray S, Hadfield J, et al. Non-invasive analysis of acquired resistance to cancer therapy by sequencing of plasma DNA. Nature. 2013; 497:108-112.
19. Pandolfi PP. Breast cancer--loss of PTEN predicts resistance to treatment. N Engl J Med. 2004; 351:2337-2338.
20. Saal LH, Holm K, Maurer M, Memeo L, Su T, Wang X, Yu JS, Malmstrom PO, Mansukhani M, Enoksson J, Hibshoosh H, Borg A, Parsons R. PIK3CA mutations correlate with hormone receptors, node metastasis, and ERBB2, and are mutually exclusive with PTEN loss in human breast carcinoma. Cancer Res. 2005; 65:2554-2559.
21. Chen FL, Xia W, Spector NL. Acquired resistance to small molecule ErbB2 tyrosine kinase inhibitors. Clin Cancer Res. 2008; 14:6730-6734.
22. Garrett JT, Arteaga CL. Resistance to HER2-directed antibodies and tyrosine kinase inhibitors: mechanisms and clinical implications. Cancer Biol Ther. 2011; 11:793-800.
23. Xu B, Ma F, Chen S, Li Q, Yang F, Zhang Y, Chen X, Zhong D, Zhang G. A phase I study for tolerability, safety, and pharmacokinetics of pyrotinib, a novel irreversible HER2 and EGFR inhibitor, in Chinese patients with HER2+ metastatic breast cancer. J Clin Oncol. 2015; 33:abstr e11596.
24. Joshi PM, Sutor SL, Huntoon CJ, Karnitz LM. Ovarian cancer-associated mutations disable catalytic activity of CDK12, a kinase that promotes homologous recombination repair and resistance to cisplatin and poly (ADP-ribose) polymerase inhibitors. J Biol Chem. 2014; 289:9247-9253.
25. Tural D, Serdengecti S, Demirelli F, Ozturk T, Ilvan S, Turna H, Ozguroglu M, Buyukunal E. Clinical significance of p95HER2 overexpression, PTEN loss and PI3K expression in p185HER2-positive metastatic breast cancer patients treated with trastuzumab-based therapies. Br J Cancer. 2014; 110:2996.
26. Liu B, Fan Z, Edgerton SM, Yang X, Lind SE, Thor AD. Potent anti-proliferative effects of metformin on trastuzumab-resistant breast cancer cells via inhibition of erbB2/IGF-1 receptor interactions. Cell Cycle. 2011; 10:2959-2966.
27. Nahta R. Pharmacological strategies to overcome HER2 cross-talk and Trastuzumab resistance. Curr Med Chem. 2012; 19:1065-1075.
28. Generali D, Leek R, Fox SB, Moore JW, Taylor C, Chambers P, Harris AL. EGFR mutations in exons 18-21 in sporadic breast cancer. Ann Oncol. 2007; 18:203-205.
29. Reis-Filho JS, Pinheiro C, Lambros MB, Milanezi F, Carvalho S, Savage K, Simpson PT, Jones C, Swift S, Mackay A, Reis RM, Hornick JL, Pereira EM, et al. EGFR amplification and lack of activating mutations in metaplastic breast carcinomas. J Pathol. 2006; 209:445-453.
30. Al-Kuraya K, Schraml P, Torhorst J, Tapia C, Zaharieva B, Novotny H, Spichtin H, Maurer R, Mirlacher M, Kochli O, Zuber M, Dieterich H, Mross F, et al. Prognostic relevance of gene amplifications and coamplifications in breast cancer. Cancer Res. 2004; 64:8534-8540.
31. Bhargava R, Gerald WL, Li AR, Pan Q, Lal P, Ladanyi M, Chen B. EGFR gene amplification in breast cancer: correlation with epidermal growth factor receptor mRNA and protein expression and HER-2 status and absence of EGFR-activating mutations. Mod Pathol. 2005; 18:1027-1033.
32. Reis-Filho JS, Milanezi F, Carvalho S, Simpson PT, Steele D, Savage K, Lambros MB, Pereira EM, Nesland JM, Lakhani SR, Schmitt FC. Metaplastic breast carcinomas exhibit EGFR, but not HER2, gene amplification and overexpression: immunohistochemical and chromogenic in situ hybridization analysis. Breast Cancer Res. 2005; 7:R1028-1035.
33. Dickler MN, Rugo HS, Eberle CA, Brogi E, Caravelli JF, Panageas KS, Boyd J, Yeh B, Lake DE, Dang CT, Gilewski TA, Bromberg JF, Seidman AD, et al. A phase II trial of erlotinib in combination with bevacizumab in patients with metastatic breast cancer. Clin Cancer Res. 2008; 14:7878-7883.
34. Nabholtz JM, Chalabi N, Radosevic-Robin N, Dauplat MM, Mouret-Reynier MA, Van Praagh I, Servent V, Jacquin JP, Benmammar KE, Kullab S, Bahadoor MR, Kwiatkowski F, Cayre A, et al. Multicentric neoadjuvant pilot Phase II study of cetuximab combined with docetaxel in operable triple negative breast cancer. Int J Cancer. 2016; 138:2274-2280.
35. Tryfonidis K, Basaran G, Bogaerts J, Debled M, Dirix L, Thery JC, Tjan-Heijnen VC, Van den Weyngaert D, Cufer T, Piccart M, Cameron D. A European Organisation for Research and Treatment of Cancer randomized, double-blind, placebo-controlled, multicentre phase II trial of anastrozole in combination with gefitinib or placebo in hormone receptor-positive advanced breast cancer (NCT00066378). Eur J Cancer. 2016; 53:144-154.
36. Rothe F, Laes JF, Lambrechts D, Smeets D, Vincent D, Maetens M, Fumagalli D, Michiels S, Drisis S, Moerman C, Detiffe JP, Larsimont D, Awada A, et al. Plasma circulating tumor DNA as an alternative to metastatic biopsies for mutational analysis in breast cancer. Ann Oncol. 2014; 25:1959-1965.
37. Leary RJ, Sausen M, Kinde I, Papadopoulos N, Carpten JD, Craig D, O'Shaughnessy J, Kinzler KW, Parmigiani G, Vogelstein B, Diaz LA, Jr., Velculescu VE. Detection of chromosomal alterations in the circulation of cancer patients with whole-genome sequencing. Sci Transl Med. 2012; 4:162ra154.
38. Heidary M, Auer M, Ulz P, Heitzer E, Petru E, Gasch C, Riethdorf S, Mauermann O, Lafer I, Pristauz G, Lax S, Pantel K, Geigl JB, et al. The dynamic range of circulating tumor DNA in metastatic breast cancer. Breast Cancer Res. 2014; 16:421.
39. Maier J, Lange T, Kerle I, Specht K, Bruegel M, Wickenhauser C, Jost P, Niederwieser D, Peschel C, Duyster J, von Bubnoff N. Detection of mutant free circulating tumor DNA in the plasma of patients with gastrointestinal stromal tumor harboring activating mutations of CKIT or PDGFRA. Clin Cancer Res. 2013; 19:4854-4867.
40. Eisenhauer EA, Therasse P, Bogaerts J, Schwartz LH, Sargent D, Ford R, Dancey J, Arbuck S, Gwyther S, Mooney M, Rubinstein L, Shankar L, Dodd L, et al. New response evaluation criteria in solid tumours: revised RECIST guideline (version 1.1). Eur J Cancer. 2009; 45:228-247.