
INTRODUCTION
The prognosis of esophageal cancer patient is still poor [1]. Immune checkpoint proteins (or checkpoints) are many inhibitory immune signalings that are vital for maintaining self-tolerance and dictating the duration or the amplitude of immune responses in peripheral tissues [2]. They are extremely important to minimize collateral tissue damages [2]. Existing evidences have shown that blockade of immune checkpoints could potently activate therapeutic anti-cancer immunity, which has become a promising anti-cancer (i.e. esophageal cancer) strategy [2].
Preclinical studies have demonstrated that antibodies that block the checkpoints could enhance antigen-specific T cell responses [2, 3]. A fully humanized anti-cytotoxic T lymphocyte antigen 4 (CTLA-4) antibody, ipilimumab, has displayed a long-term survival benefit in patients with advanced melanoma [4]. Blocking programmed death 1 (PD-1) pathway could overcome immune resistance, and induce clinical responses in patients with melanoma, renal cell carcinoma and non-small cell lung cancer [5]. Therefore, immune checkpoints are promising immunotherapeutic targets for esophageal cancer treatment. The PD-1 pathway has been evaluated in esophageal cancer by immunohistochemistry (IHC), yet immune checkpoints have not been systematically tested in esophageal cancers [6].
In the current study, we showed that, as compared to normal donors, the expressions of several co-inhibitory receptors (or checkpoints), including PD-1, T cell immunoglobulin mucin-3 (TIM-3), T cell Ig and ITIM domain (TIGIT) and CD160, were significantly increased in a fraction of peripheral T cells of esophageal cancer patients. Meanwhile, the expression levels of PD-1, TIM-3 and TIGIT were significantly higher in tumor-infiltrating lymphocytes (TILs) than that in peripheral T cells in the cancer patients.
RESULTS
Dysregulation of immune checkpoints in circulating T cells of esophageal cancer patients
We first tested expressions of a set of immune checkpoints, including CD200, PD-1, CD137L, CD273, CD274, CTLA-4, TIM-3, CD137, CD158, CD160, B-and T-lymphocyte attenuator (BTLA), CD28, CD27, TIGIT and CD278, in circulating CD4+ and CD8+ T cells that were derived from normal donors (n = 10) or esophageal cancer patients (n = 10, Figure 1). Results showed that expressions of PD-1, TIM-3 and CD158 in CD4+ T cells of esophageal cancer patients were significantly higher than that in healthy donors (cancer patients vs. healthy donors, 22.92 ± 4.974% vs. 5.966 ± 1.220%, p = 0.0039; 18.18 ± 4.177% vs. 7.126 ± 1.276%, p = 0.0209; 0.5710 ± 0.1785% vs. 0.1118 ± 0.02247%, p = 0.0200). On the other hand, the expressions of CD200, BTLA, CD28, CD27 and TIGIT in cancer patients’ CD4+ T cells were significantly lower than that of normal donors (cancer patients vs. healthy donors, 7.386 ± 0.7313% vs. 12.68 ± 1.134%, p = 0.0010; 93.48 ± 0.8471% vs. 96.95 ± 0.3344%, p = 0.0013; 88.98 ± 2.499% vs. 97.76 ± 0.6576%, p = 0.0032; 74.39 ± 4.781% vs. 94.99 ± 0.7738%, p = 0.0005; 80.95 ± 3.544% vs. 97.36 ± 0.4241%, p = 0.0002; Figure 2). Similar results were also observed when analyzing PD-1, TIM-3, CD200 and CD27 expressions on CD4+ T cells through mean fluorescence intensity (MFI, Figure 2). No significant differences were observed when analyzing CD158, CD28 and TIGIT expressions on CD4+ T cells from cancer patients and healthy donors (Figure 2). Intriguingly, MFIs of BTLA or CTLA-4 on CD4+ T cells from cancer patients were significantly higher than that from normal donors (Figure 2).
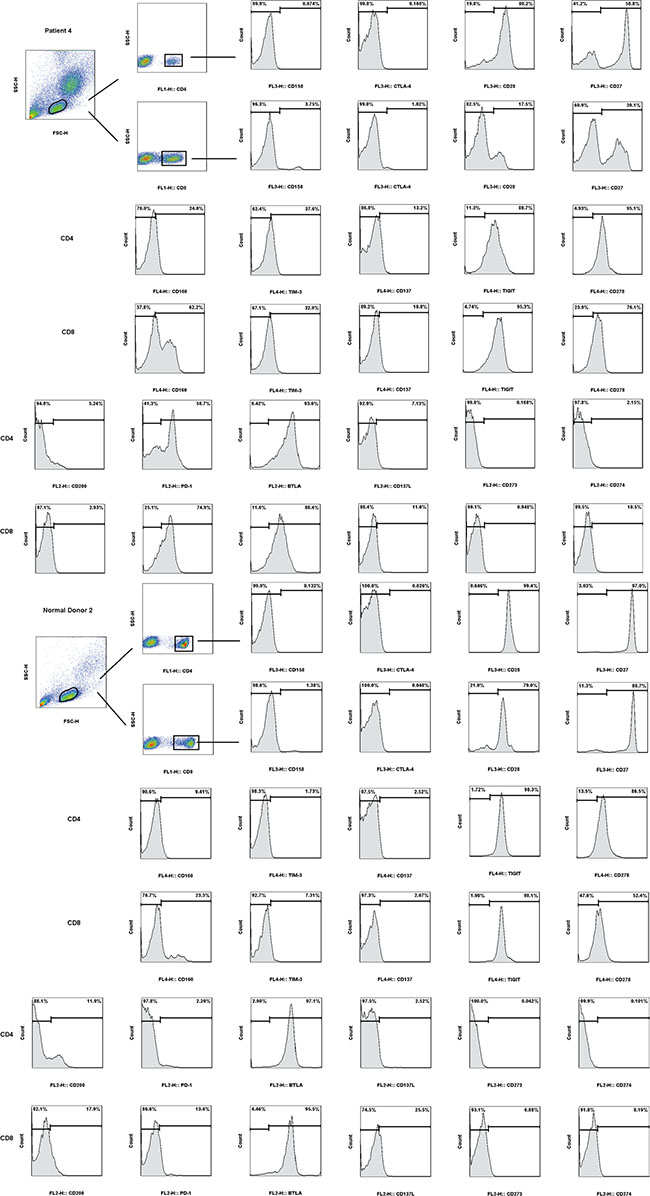
Figure 1: Expressions of multiple checkpoints (CD158, CTLA-4, CD28, CD27, CD160, TIM-3, CD137, TIGIT, CD278, CD200, PD-1, BTLA, CD137L, CD273 and CD274) in CD4+ and CD8+ T cells of normal donors’ peripheral blood mononuclear cells (PBMC) and esophageal cancer patients’ PBMC.
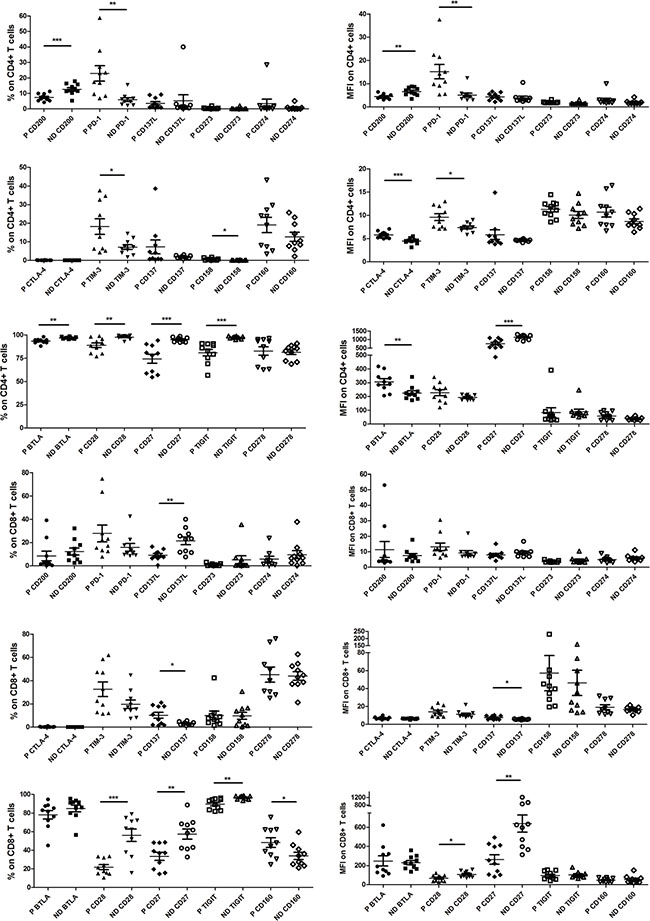
Figure 2: Pooled data from normal donor peripheral blood mononuclear cells (ND PBMC, n = 10) and esophageal cancer patient PBMC (P PBMC; n = 10, except n = 9 for CD278, CD273 and CD274 on patient CD8+ T cells) showing expression and mean fluorescence intensity (MFI) of CD158, CTLA-4, CD28, CD27, CD160, TIM-3, CD137, TIGIT, CD278, CD200, PD-1, BTLA, CD137L, CD273 and CD274 in CD4+ and CD8+ T cells. The horizontal bars indicate means. The error bars indicate SEM. “*” represents p < 0.05, “**” represents p < 0.01, “***” represents p < 0.001. “ND” represents normal donor, “P” represen ts esophageal cancer patient.
The expression levels of CD137 and CD160 on CD8+ T cells from esophageal cancer patients were significantly higher than that from normal donors (cancer patients vs. healthy donors, 10.12 ± 2.571% vs. 3.122 ± 0.4173%, p = 0.0150; 48.26 ± 5.225% vs. 33.95 ± 3.807%, p = 0.0400, Figure 2). Yet, the expression levels of CD137L, CD28, CD27 and TIGIT on cancer patients’ CD8+ T cells were significantly lower (cancer patients vs. healthy donors, 9.143 ± 1.450% vs. 21.53 ± 3.323%, p = 0.0031; 21.84 ± 2.707% vs. 56.12 ± 6.641%, p = 0.0001; 33.45 ± 4.259% vs. 57.36 ± 5.452%, p = 0.0028; 89.55 ± 1.816% vs. 96.66 ± 0.6024%, p = 0.0016; Figure 2). Similar results were also observed when analyzing CD137, CD28 and CD27 expressions on CD8+ T cells by MFI (Figure 2). No significant differences were observed when analyzing CD137L, CD160 and TIGIT expressios on these CD8+ T cells through the MFI method (Figure 2). Meanwhile, relative high levels of PD-1 and TIM-3 in CD8+ T cells of esophageal cancer patients (n = 10) were noted, although the differences (vs. healthy donors) were not significant (cancer patients vs. healthy donors, 27.85 ± 7.199% vs. 15.86 ± 3.282%, p = 0.1470; 32.56 ± 6.237% vs. 19.70 ± 3.579%, p = 0.0905; Figure 2).
Expressions of PD-1, TIM-3, TIGIT and BTLA in tumor-infiltrating lymphocytes (TILs) of esophageal cancer patients
Above results showed that PD-1, TIM-3, TIGIT and BTLA expressions were dysregulated on a fraction of peripheral blood T cells of esophageal cancer patients. We next assessed the expressions of PD-1, TIM-3, TIGIT and BTLA on CD4+ and CD8+ T cells isolated from esophageal cancer tissues, adjacent esophageal mucosa (AEM), and peripheral blood mononuclear cell (PBMC) from esophageal cancer patients (Figure 3).
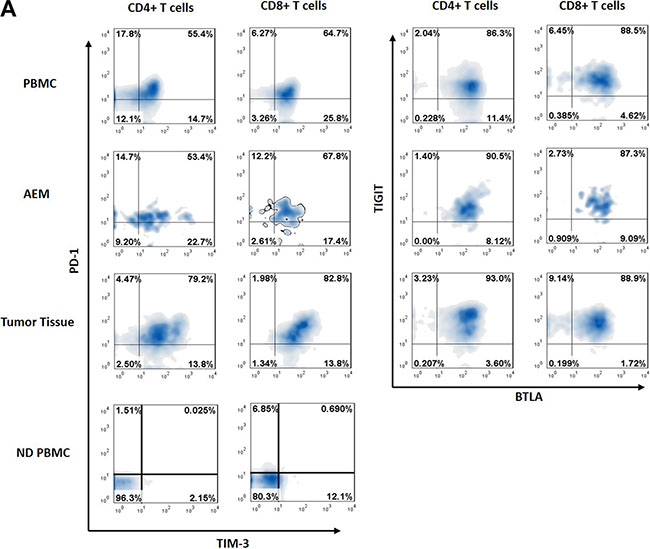
Figure 3: Representative data from normal donor peripheral blood mononuclear cells (ND PBMC), esophageal cancer patient peripheral blood mononuclear cells (PBMC), adjacent esophageal mucosa (AEM) and tumor tissue showing PD-1, TIM-3, BTLA and TIGIT expression in CD4+ and CD8+ T cells.
We showed that the expressions of PD-1 and TIM-3 on circulating CD4+ and CD8+ T cells from esophageal cancer patients (n = 35) were significantly higher than that from normal donors (n = 10, Figure 4A). The expression of TIGIT on cancer patients’ (n = 35) circulating CD8+ T cells (not circulating CD4+ T cells) was significantly lower than that of normal donors (n = 10) (Figure 4A). However, the difference in BTLA expression in circulating T cells between patients (n = 35) and normal donors (n = 10) was not statistically significant (Figure 4A).
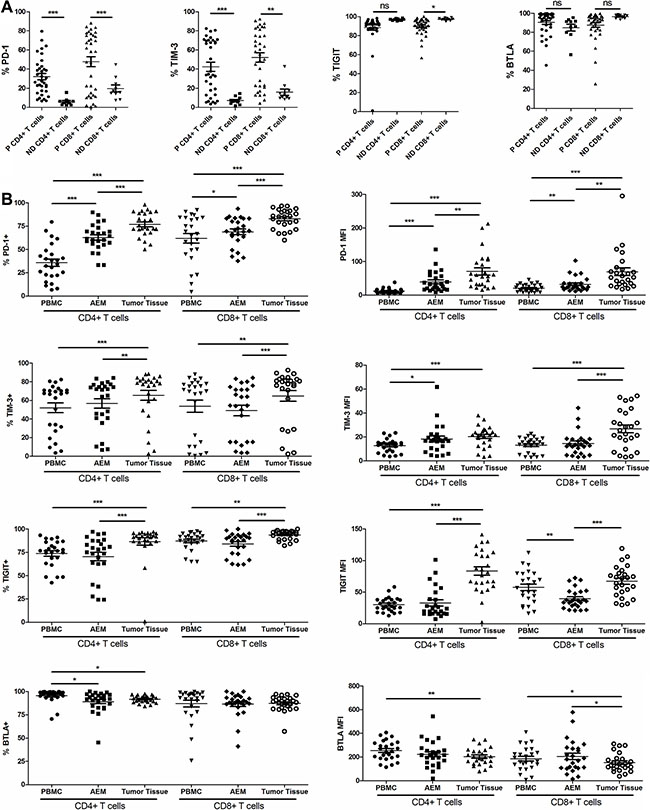
Figure 4: Pooled data from normal donor peripheral blood mononuclear cells (ND PBMC, n = 10) and esophageal cancer patient PBMC (P PBMC, n = 35) showing expression of PD-1, TIM-3, TIGIT and BTLA on CD4+ and CD8+ T cells. (A) Pooled data from esophageal cancer patient peripheral blood mononuclear cells (PBMC, n = 25), adjacent esophageal mucosa (AEM, n = 25) and tumor tissue (n = 25) showing expression and MFI of PD-1, TIM-3, BTLA and TIGIT on CD4+ and CD8+ T cells (B). The horizontal bars indicate means. The error bars indicate SEM. “*” represents p < 0.05, “**” represents p < 0.01, “***” represents p < 0.001, “ns” represents no significantly different.
The percentage of CD4+ TILs expressing PD-1 in tumor tissue was significantly higher than that of CD4+ T cells in AEM. It was also significantly higher than that of CD4+ PBMCs from esophageal cancer patients (76.83 ± 2.565% vs. 62.80 ± 2.882%, p < 0.0001; 62.80 ± 2.882% vs. 35.75 ± 35.75%, p = 0.0001; Figure 4B). The percentage of CD4+ TILs expressing TIM-3 and TIGIT in tumor tissues (65.43 ± 5.290% and 86.50 ± 3.890%) was significantly higher than that of CD4+ T cells in AEM (56.60 ± 5.091%, p = 0.0032; and 70.44 ± 4.505%, p = 0.0003) and PBMCs (52.04 ± 5.293%, p = 0.0010; and 73.77 ± 2.901%, p = 0.0006) from cancer patients (Figure 4B). The expression pattern of PD-1, TIM-3 and TIGIT on CD8+ T cells was similar to that on CD4+ T cells (Figure 4B). Similar results were also obtained when analyzing PD-1, TIM-3 and TIGIT expressions by MFI on TILs, AEM and PBMCs from cancer patients (Figure 4B). However, the MFI of TIGIT expression was lowest in CD8+ T cells from AEM (Figure 4B). The percentage of CD4+ TILs expressing BTLA was significantly lower than that of circulating CD4+ T cells from esophageal cancer patients (91.73 ± 0.7573% vs. 95.46 ± 1.438%, p = 0.0199). Yet, no significant difference was noticed in the percentage of BTLA+ cells on CD8+ T cells between PBMC and tumor tissues (87.23 ± 1.665% vs. 86.98 ± 3.576%, p = 0.9464; Figure 4B). The MFI of BTLA on CD4+ and CD8+ TILs was lower than that of circulating CD4+ and CD8+ T cells from esophageal cancer patients (Figure 4B).
Correlation between PD-1 and TIM-3/TIGIT expression
We examined the correlations between PD-1 and TIM-3 or TIGIT expression in CD4+ and CD8+ T cells in PBMC (n = 35, Figure 5A), AEM (n = 25, Figure 5B) and tumor tissues (n = 25, Figure 5C) from esophageal cancer patients. We observed statistically significant correlations between PD-1 and TIM-3 expression in CD4+ T cells in PBMC (r = 0.5270, p = 0.0011; Figure 5A) and tumor tissues (r = 0.4254, p = 0.0340; Figure 5C), as well as in CD8+ T cells in PBMC (r = 0.7110, p < 0.0001; Figure 5A), AEM (r = 0.5641, p = 0.0033; Figure 5B) and tumor tissues (r = 0.5148, p = 0.0058; Figure 5C). No significant correlations were observed in CD4+ T cells in AEM (r = 0.2434, p = 0.2410; Figure 5B). Moreover, we observed statistically significant correlations between PD-1 and TIGIT expression in CD4+ T cells in AEM (r = 0.4769, p = 0.0159; Figure 5B) and tumor tissues (r = 0.5121, p = 0.0089; Figure 5C), and in CD8+ T cells in PBMC (r = 0.3888, p = 0.0210; Figure 5A) and tumor tissues (r = 0.4793, p = 0.0153; Figure 5C). No significant correlations were observed in CD4+ T cells in PBMC (r = 0.2188, p = 0.2066; Figure 5A) or in CD8+ T cells of AEM (r = 0.26884, p = 0.1621; Figure 5C).
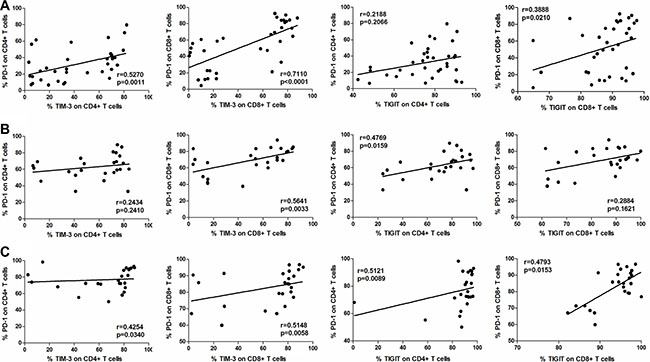
Figure 5: Correlation between PD-1 and TIM-3, or PD-1 and TIGIT expressions in CD4+ and CD8+ T cells in PBMC (n = 35, A), AEM (n = 25, B) and tumor tissues (n = 25, C) from esophageal cancer patients. Spearman’s rank test was used for statistical analysis.
Up-regulation of PD-1+TIM-3+ T cells in TILs
We next tested whether PD-1 and TIM-3 were expressed on identical or distinct T cell subsets. CD4+ and CD8+ T cells from patient PBMC had a significantly higher percentages of PD-1+TIM-3+ cells than CD4+ and CD8+ T cells from normal donor PBMC (20.03 ± 3.465% vs. 0.4998 ± 0.1179%, p = 0.0012; 36.90 ± 5.235% vs. 2.047 ± 0.7608%, p = 0.0002; Figure 6). Moreover, CD4+ T cells from patient PBMC had significantly higher percentages of PD-1-TIM-3+ and PD-1+TIM-3- cells than CD4+ T cells from normal donor PBMC (24.92 ± 2.886% vs. 6.184 ± 1.180%, p = 0.0003; 15.48 ± 2.741% vs. 5.568 ± 1.161%, p = 0.0321; Figure 6). The frequency of PD-1+TIM-3+ cells was significantly increased in the CD4+ T cells in AEM as compared to PBMC from patients (35.10 ± 4.047% vs. 20.03 ± 3.465%, p < 0.0001), but not in CD8+ T cells (35.60 ± 4.918% vs. 36.90 ± 5.235%, p = 0.6019; Figure 6). The frequency of PD-1+TIM-3+ cells was significantly increased in CD4+ and CD8+ T cell population in tumor tissues compared to AEM (48.28 ± 4.818% vs. 35.10 ± 4.047%, p = 0.0003; 52.63 ± 5.368% vs. 35.60 ± 4.918%, p < 0.0001) and in PBMC (48.28 ± 4.818% vs. 20.03 ± 3.465%, p < 0.0001; 52.63 ± 5.368% vs. 36.90 ± 5.235%, p < 0.0001) from esophageal cancer patients (Figure 6). However, the levels of PD-1+TIM-3- cells did not increase in CD4+ and CD8+ T cells in tumor tissues as compared to AEM. Furthermore, the levels of PD-1-TIM-3+ cells decreased in CD4+ and CD8+ T cells in tumor tissues and AEM, as compared to that in patient PBMC (Figure 6).
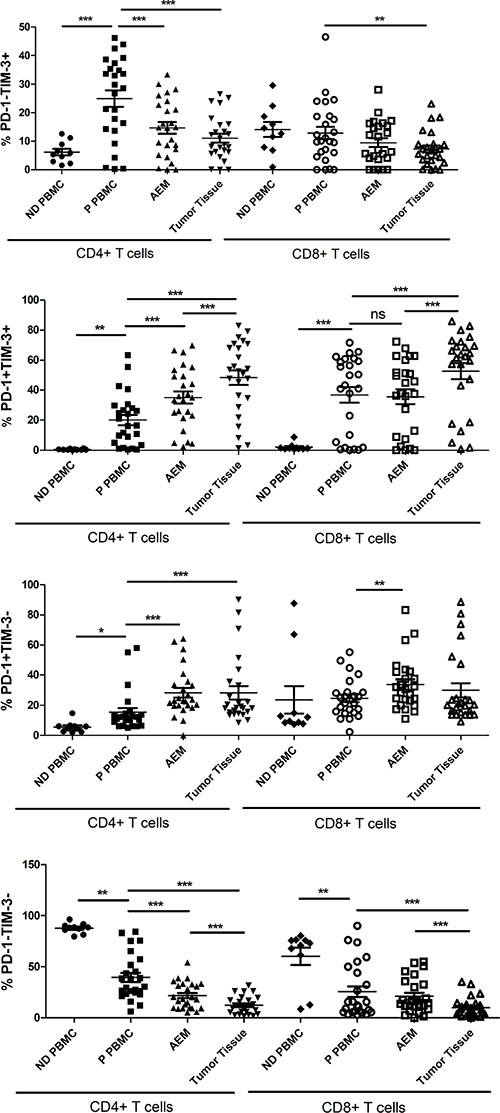
Figure 6: Pooled data showing the percentage (%) of PD-1-TIM-3+, PD-1+TIM-3+, PD-1+TIM-3- and PD-1-TIM-3- on CD4+ and CD8+ T cells from normal donor PBMC (n = 10), esophageal cancer patient PBMC (n = 25), adjacent esophageal mucosa (AEM, n = 25) and tumor tissues (n = 25). The horizontal bars indicate means. The error bars indicate SEM. “*” represents p < 0.05, “**” represents p < 0.01, “***” represents p < 0.001, “ns” represents no significantly different.
DISCUSSION AND CONCLUSIONS
Esophageal cancer is a highly lethal disease that lacks effective systemic treatment, making exploration of immunotherapy targets is extremely important. To our best knowledge, this study represents the first systematic effort to characterize expression pattern of immune checkpoints in esophageal cancers.
We show that the expressions of co-stimulatory molecules CD28, CD27 and CD137L were downregulated on a fraction circulating T cells from esophageal cancer patients (Figure 2). Yet, the expressions of co-inhibitory receptor PD-1, TIM-3, CD160 and CTLA-4 were upregulated (Figure 2). These observations indicated that circulating T cells may present with an immune suppressive phenotype in esophageal cancer patients. However, the expressions of co-inhibitory receptor CD200 and TIGIT were downregulated, and the expressions of co-stimulatory receptor CD137 and CD158 were upregulated on a fraction of circulating T cells from esophageal cancer patients (Figure 2).
Our results demonstrated that both PD-1 and TIM-3 were up-regulated on peripheral T cells and TILs from esophageal cancer patients, and that approximately half of TILs were PD-1+TIM-3+, a 26 to 100-fold increase compared to peripheral T cells of normal donors (Figure 6). The level of PD-1+TIM-3+ peripheral T cells of esophageal cancer patients was increased 18 to 40-fold compared to those from normal donors (Figure 6). Moreover, our observations showed statistically significant positive correlations between PD-1 and TIM-3 expression in T cells in PBMC and tumor tissue (Figure 5A and 5B). Similar results were also observed when analyzing the correlations between PD-1 and TIGIT expressions on T cells from esophageal cancer patients (Figure 5C). It has been demonstrated that TIGIT directly inhibits T cell activation [7, 8]. Therefore, our results suggest that PD-1, TIM-3 and TIGIT expressions on T cells from esophageal cancer patients would be in a co-expression pattern, which may cause T cell exhaustion.
In recent clinical cancer studies, the concurrent blockage of PD-1 and TIM-3 pathways exhibited better anti-cancer efficiency [9, 10]. Studies have shown that TIGIT is over-expressed on human and murine TILs. Dual blockade of TIGIT and PD-1 pathway additively increased proliferation, cytokine production, and de-granulation of tumor antigen-specific CD8+ T cells and CD8+ TILs [11, 12]. Our observations exhibited that the expression of PD-1 on circulating CD4+ T cells was positively correlated with histological grade of patients, and negatively correlated with tumor size and lymph node status of patients (Table 1). Moreover, the expressions of PD-1 and TIM-3 on CD4+ TILs were significantly associated with TNM stage of patients (Table 1). Studies have indicated that how PD-1 expression could affect T cell functions [13]. Recent data has suggested that TIM-3 positive CD4+ T cells could represent as functional regulatory T cells in human tumors [14]. However, due to the limitation of this small sample study, further studies will be needed to evaluate potential capacity of PD-1 and TIM-3 as prognostic factors, and to dissect the mechanism of PD-1 and TIM-3 pathways in esophageal cancer.
Table 1: Clinicopathological characteristics of esophageal cancers in relation to PD-1 and TIM-3 expression
Clinical pathological parameters |
Cases(n) |
PD-1+ on CD4+ PBMC(%) |
p |
PD-1+ on CD4+ TIL(%) |
p |
TIM-3+ on CD4+ PBMC(%) |
p |
TIM-3+ on CD4+ TIL(%) |
p |
|---|---|---|---|---|---|---|---|---|---|
Gender |
|
|
|
|
|
|
|
|
|
Male |
23 |
35.99 ± 4.267 |
|
76.54 ± 2.737 |
|
51.93 ± 5.631 |
|
65.08 ± 5.717 |
|
Female |
2 |
33 ± 6.800 |
0.8417 |
80.2 ± 8.200 |
0.7073 |
53.3 ± 19.50 |
0.9456 |
69.55 ± 10.35 |
0.8241 |
Age(years) |
|
|
|
|
|
|
|
|
|
< 70 |
15 |
31.37 ± 4.191 |
|
75.18 ± 3.187 |
|
47.32 ± 7.229 |
|
65.88 ± 6.714 |
|
≥ 70 |
10 |
42.33 ± 7.387 |
0.1784 |
79.31 ± 4.363 |
0.442 |
59.12 ± 7.451 |
0.2841 |
64.76 ± 9.016 |
0.9201 |
Tumor size(cm) |
|
|
|
|
|
|
|
|
|
< 4 |
12 |
43.99 ± 4.724 |
|
77.1 ± 4.367 |
|
52.22 ± 8.739 |
|
60.32 ± 9.465 |
|
≥ 4 |
13 |
28.15 ± 5.553 |
0.0419 |
76.58 ± 3.027 |
0.9226 |
51.87 ± 6.566 |
0.9747 |
70.15 ± 5.289 |
0.3641 |
Histological grade |
|
|
|
|
|
|
|
|
|
Well differentiated |
9 |
24.98 ± 4.180 |
|
77.8 ± 3.528 |
|
49.76 ± 8.130 |
|
70.48 ± 6.369 |
|
Moderately-poor differentiated |
16 |
41.82 ± 5.176 |
0.0373 |
76.29 ± 3.558 |
0.7839 |
53.32 ± 7.064 |
0.7541 |
62.6 ± 7.504 |
0.4863 |
Lymph node metastasis |
|
|
|
|
|
|
|
|
|
Negative |
12 |
44.33 ± 6.149 |
|
80 ± 4.072 |
|
51.66 ± 8.655 |
|
60.56 ± 9.54 |
|
Positive |
13 |
27.84 ± 4.108 |
0.0333 |
73.91 ± 3.129 |
0.2434 |
52.38 ± 6.659 |
0.9471 |
69.93 ± 5.208 |
0.3877 |
TNM stage |
|
|
|
|
|
|
|
|
|
Stage I |
7 |
44.26 ± 6.402 |
|
78.44 ± 5.854 |
|
35.93 ± 11.47 |
|
44.31 ± 13.32 |
|
Stage II |
8 |
39.54 ± 8.573 |
|
84.26 ± 3.814 |
|
64.8 ± 7.670 |
|
83.79 ± 1.516 |
|
Stage III |
10 |
26.78 ± 4.781 |
0.1609 |
69.76 ± 2.856 |
0.0467 |
53.1 ± 7.346 |
0.2381 |
65.54 ± 6.139 |
0.0093 |
In conclusion, our observations suggest that the co-inhibitory receptors PD-1, TIM-3 and TIGIT could be the immunotherapeutic targets in esophageal cancer.
MATERIALS AND METHODS
Study subjects
Thirty esophageal cancer patients, hospitalized at Hai’an County People’s Hospital (Hai’an, China), were enrolled in this study (Table 1). Detailed clinic pathologic data were summarized in Table 1. Patients received no immunotherapy or chemotherapy prior surgery. Ten informed consent healthy normal donors were recruited from Hai’an County People’s Hospital. The study protocol was approved by the Ethics Committee at Hai’an County People’s Hospital. Written-informed consent was obtained from each participant. All investigations were conducted according to the principles expressed in the Declaration of Helsinki.
Isolation of PBMC and TILs
A four mL peripheral blood sample was drawn from each health donor or esophageal cancer patient before surgery. The blood samples were centrifuged through a Ficoll-Paque Plus (GE, Shanghai, China) gradient. TILs were isolated by dissociating tumor tissue with the plunger portion of syringes on mesh sieves before centrifugation on a Ficoll-Paque Plus (GE) gradient. All investigations were conducted according to approval by the ethics committee and the principles expressed in the Declaration of Helsinki.
Flow cytometry
Acquired single cell suspensions were incubated with CD4-FITC, CD8-FITC, PD-1-PE, CD273(PDL1)-PE, CD274(PDL2)-PE, BTLA-PE, CD200-PE, CD137L-PE, CTLA-4-PE-Cy5, CD27-PE-Cy5, CD28-PerCP-Cy5.5, CD158-PE-Cy5, TIGIT-APC, CD160-eFluor 660, TIM-3-APC, CD137(4-1BB)-APC, and CD278(ICOS)-APC. 7-AAD (BD) was used to assess the viability of the cells. All data were collected on a FACSCalibur (BD) and analyzed with FlowJo software (Tree Star, Inc.).
Statistics
Data were collected and were utilized to calculate the mean ± standard error (SEM). Statistical differences were analyzed by one-way ANOVA followed by multiple comparisons performed with post hoc Bonferroni test (GraphPad Prism software). A multivariable analysis was performed using a logistic regression model in order to explore the association between expression of different checkpoint proteins, or the association between checkpoint protein expression and patients’ pathological features [15]. A step-down procedure method was selected. The criterion for variable removal was the likelihood ratio statistic based on the maximum partial likelihood estimates. Values of p < 0.05 were considered statistically significant.
ACKNOWLEDGMENTS
This work was supported by the National Natural Science Foundation (81572345, to H. Zhu).
CONFLICTS OF INTEREST
None.
Authors’ contributions
XJ, WJ, CS, ZL, JF, YL, and JH participated in the design of the study. XJ, WJ, CS, YL, ZY and JH performed all the experiments. XJ, WJ, CS, ZL, ZY and JH conceived of the study. XJ, WJ, JF, YL, ZY and JH participated in its design and coordination and helped to draft the manuscript. All authors have read and approved the final manuscript.
REFERENCES
1. Rustgi AK, El-Serag HB. Esophageal Carcinoma. N Engl J Med. 2014; 371:2499–2509.
2. Pardoll DM. The blockade of immune checkpoints in cancer immunotherapy. Nat Rev Cancer. 2012; 12:252–264.
3. Nirschl CJ, Drake CG. Molecular pathways: coexpression of immune checkpoint molecules: signaling pathways and implications for cancer immunotherapy. Clin Cancer Res. 2013; 19:4917–4924.
4. Sondak VK, Smalley KSM, Kudchadkar R, Grippon S, Kirkpatrick P. Ipilimumab. Nat Rev Drug Discov. 2011; 10:411–412.
5. Suzanne LT, Hodi FS, Julie RB, Scott NG, David CS, David FM, John DP, Richard DC, Jeffrey AS, Michael BA, Philip DL, David RS, Scott JA, et al. Safety, Activity, and Immune Correlates of Anti–PD-1 Antibody in Cancer. N Engl J Med. 2012; 366.
6. Derks S, Nason KS, Liao X, Stachler MD, Liu KX, Liu JB, Sicinska E, Goldberg MS, Freeman GJ, Rodig SJ, Davison JM, Bass AJ. Epithelial PD-L2 expression marks Barrett’s Esophagus and Esophageal Adenocarcinoma. Cancer Immunol Res. 2015.
7. Joller N, Hafler JP, Brynedal B, Kassam N, Spoerl S, Levin SD, Sharpe AH, Kuchroo VK. Cutting edge: TIGIT has T cell-intrinsic inhibitory functions. J Immunol. 2011; 186:1338–1342.
8. Lozano E, Dominguez-Villar M, Kuchroo V, Hafler D. The TIGIT/CD226 axis regulates human T cell function. J Immunol. (Baltimore, Md : 1950). 2012; 188:3869–3875.
9. Fourcade J, Sun Z, Benallaoua M, Guillaume P, Luescher IF, Sander C, Kirkwood JM, Kuchroo V, Zarour HM. Upregulation of Tim-3 and PD-1 expression is associated with tumor antigen-specific CD8+ T cell dysfunction in melanoma patients. J Exp Med. 2010; 207:2175–2186.
10. Zhou Q, Munger M, Veenstra R, Weigel B, Hirashima M, Munn D, Murphy W, Azuma M, Anderson A, Kuchroo V, Blazar B. Coexpression of Tim-3 and PD-1 identifies a CD8+ T-cell exhaustion phenotype in mice with disseminated acute myelogenous leukemia. Blood. 2011; 117:4501–4510.
11. Chauvin JM, Pagliano O, Fourcade J, Sun Z, Wang H, Sander C, Kirkwood JM, Chen TH, Maurer M, Korman AJ, Zarour HM. TIGIT and PD-1 impair tumor antigen-specific CD8(+) T cells in melanoma patients. J Clin Invest. 2015; 125:2046–2058.
12. Johnston RJ, Comps-Agrar L, Hackney J, Yu X, Huseni M, Yang Y, Park S, Javinal V, Chiu H, Irving B, Eaton DL, Grogan JL. The immunoreceptor TIGIT regulates antitumor and antiviral CD8(+) T cell effector function. Cancer Cell. 2014; 26:923–937.
13. Wei F, Zhong S, Ma Z, Kong H, Medvec A, Ahmed R, Freeman GJ, Krogsgaard M, Riley JL. Strength of PD-1 signaling differentially affects T-cell effector functions. Proc Natl Acad Sci USA. 2013; 110:E2480–2489.
14. Yan J, Zhang Y, Zhang J-P, Liang J, Li L, Zheng L. Tim-3 expression defines regulatory T cells in human tumors. PloS one. 2013; 8.
15. D’Incecco A, Andreozzi M, Ludovini V, Rossi E, Capodanno A, Landi L, Tibaldi C, Minuti G, Salvini J, Coppi E, Chella A, Fontanini G, Filice ME, et al. PD-1 and PD-L1 expression in molecularly selected non-small-cell lung cancer patients. Br J Cancer. 2015; 112:95–102.