
INTRODUCTION
Osteosarcoma is the most common primary bone cancer. It has a high propensity to metastasize to the lungs [1, 2]. Although multi-disciplinary treatments including neoadjuvant and adjuvant chemotherapy with aggressive surgical resection have improved the 5-year survival rate (approximately 70%) [1, 3], the treatment options are still unsatisfactory in osteosarcoma patients with metastasis [4]. Surgical resection has been shown to prolong the survival of patients with pulmonary metastases [5, 6]. However, for patients with multiple metastases, chemotherapy is the main strategy. The role of second-line chemotherapy is not well defined and a standard regimen has not been defined [7]. Biomarkers could enable identification of osteosarcoma patients who are likely to benefit from chemotherapy and facilitate selection of the appropriate treatment. However, markers that could predict second-line chemotherapy response in osteosarcoma patients with metastasis have not been elucidated.
Coagulation products have been associated with tumor growth, angiogenesis, and metastasis [8, 9]. D-dimer is a fibrin degradation product, which is produced when cross-linked fibrin is degraded by plasmin-induced fibrinolytic activity. The D-dimer level is widely used as an assessment tool for the diagnosis and treatment of thrombosis [10]. Elevated D-dimer levels were also associated with shorter survival times in patients with malignant tumors such as breast, colorectal, prostate, lung, pancreatic, and ovarian [11-16]. D-dimer is also a biomarker for chemotherapy response in patients with advanced lung, gastric, colorectal cancer, and serous ovarian cancer [17-20]. However, the clinical significance of D-dimer levels in metastatic osteosarcoma is not yet clear.
At our institute, we have observed elevated D-dimer levels in patients with metastatic osteosarcoma even in the absence of thrombotic episodes. In this retrospective study, we evaluated the role of D-dimer as a prognostic and predictive biomarker in patients with metastatic osteosarcoma who received second-line chemotherapy.
RESULTS
Patient characteristics
This study consisted of 32 osteosarcoma patients for whom we had complete clinical data. There were 18 male and 24 female patients. The baseline characteristics of the patients are shown in Table 1. The median age was 16 years. Most of the tumors (90.6%) were located in the extremities. A total of 71.9% of the patients had a Karnofsky Performance Scale (KPS) score ≥80. Four patients had pathological fractures and eight had local recurrence.
Table 1: Baseline characteristics of the patients
Characteristic |
|
|---|---|
Gender |
|
Female |
14 (43.8) |
Male |
18 (56.2) |
Age/year |
|
<18 |
17 (53.1) |
≥18 |
15 (46.9) |
Tumor site |
|
Extremities |
29 (90.6) |
Non-extremities |
3 (9.4) |
KPS |
|
≥80 |
23 (71.9) |
≥ 70 |
9 (28.1) |
Recurrence |
|
Yes |
8 (25.0) |
No |
24 (75.0) |
Pathological fracture |
|
Yes |
4 (12.5) |
No |
28 (87.5) |
Data are presented as percentages.
D-dimer as a prognostic marker of survival
The plasma D-dimer level before second-line chemotherapy (D1) and the D-dimer level after two cycles of second-line chemotherapy (D2) in 32 patients with metastatic osteosarcoma are shown in Figure 1. The median D1, D2, and the difference in D-dimer levels (ΔD) were 1.22(range 0.13–17.99) mg/mL, 1.17(range 0.02–20.71) mg/mL, and 0.18(range -2.26–8.75) mg/mL, respectively. Receiver operating characteristic (ROC) analyses were then performed (Figure 2). The optimal D-dimer threshold was obtained when the Youden index was maximal. The optimal cut-off values for D1, D2, and ΔD were 1.16 mg/mL (Youden index, 0.708), 0.845 mg/mL (Youden index, 0.583), and 0.51 mg/mL (Youden index, 0.333), respectively. Patients were divided into low and high groups based on these cut-off values. The patient numbers in the high D1, D2, and ΔD groups were 17 (53.1%), 18 (56.3%), and 12 (37.5%), respectively.
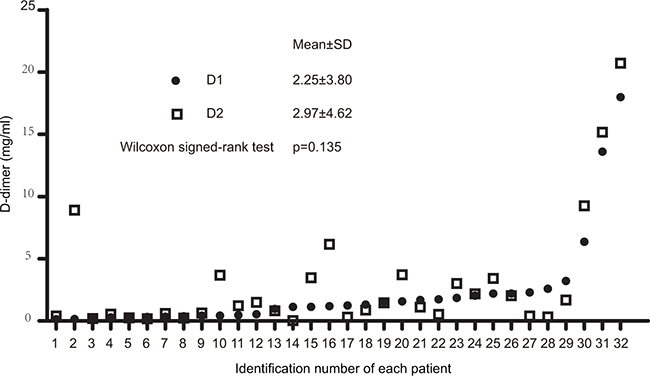
Figure 1: Dot plot of D-dimer levels before and after two cycles of second-line chemotherapy. D1, D-dimer level before second-line chemotherapy; D2, D-dimer level after two cycles of second-line chemotherapy.
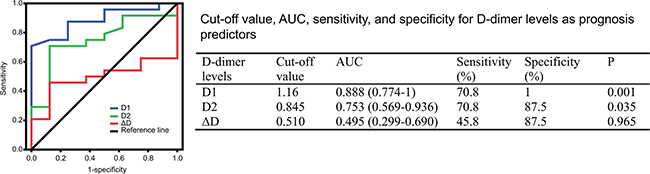
Figure 2: ROC curves of D-dimer levels to predict prognosis. ROC, receiver operating characteristic; AUC, the area under the curve; D1, D-dimer level before second-line chemotherapy; D2, D-dimer level after two cycles of second-line chemotherapy; ΔD, change in D-dimer level(D2 minus D1).
The median overall survival (OS) time of all patients was 5.3 (range 0.7–18.1) months. The survival curve indicated that the OS of patients with a high D1 was significantly shorter than those with a low D1 (median OS, 4.7 vs. 16.2 months, P=0.001). Similar results were observed in the D2 (median OS, 4.7 vs. 8.6 months, P=0.033). However, no differences were observed between the high ΔD and low ΔD groups (median OS, 4.6 vs. 7.7 months, P=0.215) (Figure 3).
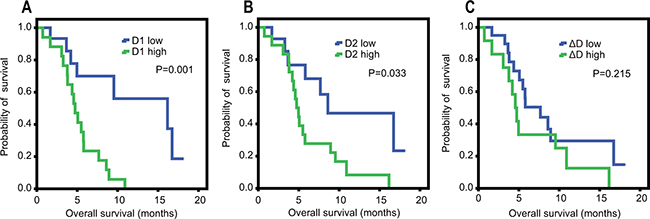
Figure 3: Kaplan Meier survival curves for overall survival according to D-dimer levels. A. D1, D-dimer level before second-line chemotherapy; B. D2, D-dimer level after two cycles of second-line chemotherapy; C. ΔD, change in D-dimer level (D2 minus D1).
The results of the univariable and multivariable analyses are shown in Table 2. The univariable analysis indicated that KPS (P=0.012), D1 (P=0.003), and D2 (P=0.040) were significantly associated with OS. Multivariable analysis of these factors demonstrated that a high D1 (hazard ratio [HR], 3.375; 95% confidence interval [CI], 1.133–10.053; P=0.029) was an independent unfavorable prognostic factor.
Table 2: Univariable and multivariable Cox proportional hazard regression analyses of overall survival
Factor |
Univariable analysis |
Multivariable analysis |
||
|---|---|---|---|---|
HR(95%CI) |
P |
HR(95%CI) |
P |
|
Gender |
0.088 |
|||
Female |
Reference |
|||
Male |
2.136 (0.893–5.110) |
|||
Age/year |
0.936 |
|||
<18 |
Reference |
|||
≥ 18 |
0.968 (0.431–2.172) |
|||
Tumor site |
0.274 |
|||
Extremities |
Reference |
|||
Non-extremities |
0.438 (0.100–1.920) |
|||
KPS |
0.012 |
0.093 |
||
≥ 80 |
Reference |
Reference |
||
≤70 |
3.390 (1.311–8.765) |
2.295 (0.870–6.057) |
||
Pathological fracture |
0.361 |
|||
No |
Reference |
|||
Yes |
1.802 (0.510–6.363) |
|||
Recurrence |
0.216 |
|||
No |
Reference |
|||
Yes |
0.534 (0.98–1.442) |
|||
Chemotherapy response |
0.546 |
|||
PR+SD |
Reference |
|||
PD |
1.319 (0.536–3.244) |
|||
D1 |
0.003 |
0.029 |
||
Low |
Reference |
Reference |
||
High |
4.835 (1.735–13.479) |
3.375 (1.133–10.053) |
||
D2 |
0.040 |
0.207 |
||
Low |
Reference |
Reference |
||
High |
2.677 (1.044–6.868) |
1.892 (0.703–5.094) |
||
ΔD |
0.220 |
|||
Low |
Reference |
|||
High |
1.682 (0.733–3.863) |
|||
AKP |
0.711 |
|||
Normal (<126 U/L) |
Reference |
|||
High |
1.262(0.369–4.313) |
|||
LDH |
0.995 |
|||
Normal (<618 U/L) |
Reference |
|||
High |
1.003(0.394–2.552) |
|||
HR, hazard ratio; CI, confidence interval; SD, stable disease; PD, progressive disease; D1, D-dimer level before second-line chemotherapy; D2, D-dimer level after two cycles of second-line chemotherapy; ΔD, change in D-dimer level(D2 minus D1); AKP, alkaline phosphatase; LDH, lactate dehydrogenase.
The relationship between D-dimer and second-line chemotherapy response
No differences were observed in the D1 and D2 (P =0.135) (Figure 1). We next evaluated the relationship between ΔD and treatment response. The mean D2 in11 patients with stable disease (SD) decreased by 0.69 mg/mL compared to the D1 (P = 0.016) (Figure 4 and Table 3). The mean D2 increased by 1.47 mg/mL compared to the D1 in 21 patients with progressive disease (PD) (P = 0.004). These results suggested that the D-dimer level may serve as a predictive biomarker for chemotherapy response.
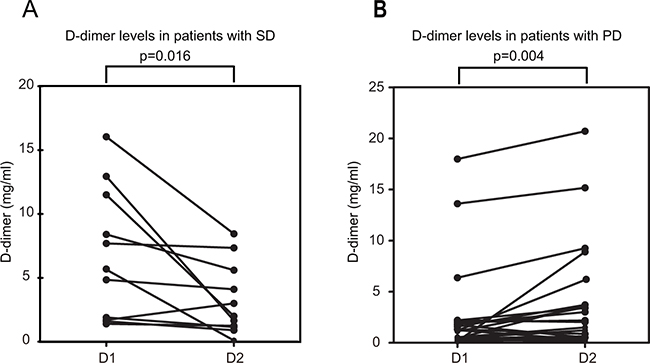
Figure 4: Changes in D-dimer levels in patients with metastatic osteosarcoma before and after two cycles of second-line chemotherapy. D1, D-dimer level before second-line chemotherapy; D2, D-dimer level after two cycles of second-line chemotherapy; A. stable disease (SD); B. progressive disease (PD).
Table 3: Differences in D-dimer levels in patients with PD and SD
Response (n=32) |
D1 |
D2 |
p |
|---|---|---|---|
PD (n=21) |
2.72±4.60 |
4.19 ± 5.33 |
0.004 |
SD (n=11) |
1.34 ± 1.02 |
0.65 ± 0.56 |
0.016 |
p |
0.858 |
0.003 |
SD, stable disease; PD, progressive disease; D1, D-dimer level before second-line chemotherapy; D2, D-dimer level after two cycles of second-line chemotherapy.
We compared the abilities of the D1, D2, and ΔD to discriminate between responders and non-responders using ROC curves. The area under the curve (AUC) of the D1 was 0.519 (95% CI, 0.307–0.732; P =0.858). The AUC of the D2 was 0.820 (95% CI, 0.677–0.963; P =0.003). The AUC of the ΔD was 0.786 (95% CI, 0.631–0.941; P =0.009). Finally, the AUC was significantly larger for the D2 and ΔD compared to the D1 (Figure 5).
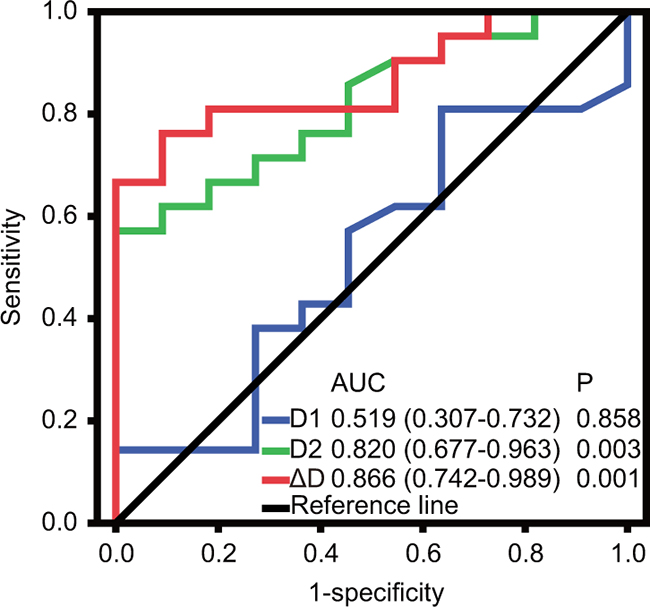
Figure 5: Comparison of the area under the ROC curve to assess whether D-dimer levels could predict chemotherapy response. ROC, receiver operating characteristic; AUC, the area under the curve; D1, D-dimer level before second-line chemotherapy; D2, D-dimer level after two cycles of second-line chemotherapy; ΔD, change of D-dimer level(D2 minus D1).
DISCUSSION
Metastasis involves multiple tumor-host interactions. Cancer cells dissociate from the primary tumor, migrate into the circulation, attach to the vasculature, invade the surrounding tissue, and establish a new blood supply at the metastatic site [19, 21]. Cross-linked fibrin in the extracellular matrix increases the metastatic potential by serving as a stable scaffold for endothelial cell migration during angiogenesis and invasion. It also protects the cells from natural-killer cells [22-24]. Fibrin remodeling plays a crucial role in metastatic progression [25, 26]. Indeed, a reduction in pulmonary micrometastases was observed in fibrinogen-deficient and plasminogen knockout mice compared to wild-type [27-29].
D-dimer is generated by the action of factor XIIIa on fibrin monomers and polymers, and when the endogenous fibrinolytic system degrades cross-linked fibrin [30]. D-dimer consists of two identical subunits derived from two fibrin proteins. It is the final fragment generated by plasmin-mediated degradation of cross-linked fibrin. The D-dimer level is elevated in situations of enhanced fibrin formation and fibrinolysis [31]. Tumor cells can alter the balance between the coagulation, anticoagulation, and fibrinolytic systems through multiple mechanisms. This can result in hypercoagulation [32, 33]. D-dimer levels were significantly higher in cancer patients compared to healthy controls, associated with patient prognosis, and even serving as a biomarker for chemotherapy response [11, 13, 17-20, 34-36].
In this retrospective study, we evaluated whether the D-dimer level was a prognostic biomarker in patients with metastatic osteosarcoma. Our results showed that a high D1 and D2 were associated with an adverse prognosis. Univariable analysis indicated that the KPS, D1, and D2 were associated with OS. Multivariable analysis demonstrated that a high D1 was an independent unfavorable prognostic factor. The mean D2 in 11 patients with SD was significantly lower than the mean D1. In contrast, in 21 patients with PD, the mean D2 was significantly higher than the mean D1. These data indicated that the D-dimer level could be a useful prognostic marker in metastatic osteosarcoma.
Patients with PD had a significantly higher D2 than patients with SD. Patients with SD had a lower D2 compared to patients with PD. The D2 was higher in patients with PD. These results indicated that the D1 and D2 could be useful markers of tumor response to second-line chemotherapy. However, previous studies have reported decreased D-dimer levels after chemotherapy in PD patients (not a significant difference) [17, 18]. The differences between our data and the data from previous studies could have resulted from study heterogeneity. For example, our patients were treated with second-line chemotherapy, but most of the other studies evaluated the D-dimer level in patients who were treated with first-line chemotherapy [13, 18, 20].
We also assessed whether the D1, D2, and ΔD could be used to discriminate between responders and non-responders using ROC curves. The AUC values were 0.519, 0.820, and 0.786 for the D1, D2, and ΔD, respectively. The AUC values for the D2 and ΔD were larger than the values for the D1, which indicated that the D2 and ΔD had a stronger association with tumor response. The D-dimer level was measured close to the start of chemotherapy and the tumor response assessed according to the treatment schedule (Figure 6). Based on our results, D-dimer has diagnostic value. It may also be a predictive factor of tumor response. To test this hypothesis, we will change the timing of the D2 measurement to right after the first cycle of second-line chemotherapy in a prospective study.
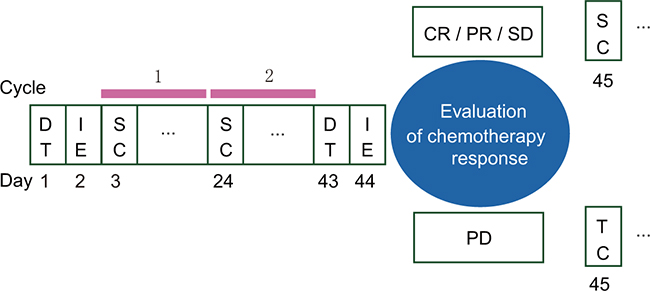
Figure 6: Treatment schedule. DT, D-dimer test; IE, imaging examination; SC, second-line chemotherapy; TC, third-line chemotherapy; CR, complete response; PR, partial response; SD, stable disease; PD, progressive disease.
Measurement of D-dimer levels is simple and cheap compared to imaging examinations. A new model based on the D-dimer level may be particularly useful for patients in developing countries. However, our study had several limitations. First, it was a retrospective, single-institution study with a small sample size. As a consequence, it provided a lower level of evidence than a randomized controlled trial. Second, we excluded patients for whom there was incomplete clinical data. This could have resulted in selection bias. The cut-off values for the D-dimer levels were also likely biased because they were determined based on ROC analysis. Finally, heterogeneity in the treatment approaches could have affected the results. Chemotherapeutic agents produce coagulation imbalances by causing endothelial injury, decreases in coagulation factors synthesis in the liver, and/or platelet dysfunction [37, 38]. Different second-line chemotherapies could have altered D-dimer levels, which would also have biased our results.
In conclusion, our data indicate pre- and post-chemotherapy D-dimer levels are correlated with OS in patients with metastatic osteosarcoma. Moreover, the D2 is a robust predictor of survival. The D2 and ΔD were strongly associated with tumor response. These results indicate that D-dimer levels could be used to predict prognosis and treatment response in patients with metastatic osteosarcoma. Additional prospective studies are necessary to validate these findings.
MATERIALS AND METHODS
Patients
We retrospectively reviewed the medical records of 32 patients with osteosarcoma who were treated in our department between January 2006 and June 2015. The inclusion criteria for the primary studies were the following: (i) patients with histologically confirmed osteosarcoma; (ii) patients who received second-line chemotherapy and had available D-dimer measurements pre- and post-chemotherapy. Patients were excluded from the final analysis for the following reasons: (i) acute illness such as infection within the 2 weeks preceding D-dimer measurement; (ii) use of anticoagulants at the start of second-line chemotherapy; (iii) other primary malignancy; and (iv) incomplete data. The study was approved by the Medical Ethics Committee of the Shanghai Jiaotong University Affiliated Sixth People’s Hospital.
Data collection
Clinical data including sex, age, KPS score, tumor location, histologic type, plasma levels of alkaline phosphatase and lactate dehydrogenase, pathological fracture, response to second-line chemotherapy, and survival duration were collected. D-dimer levels were measured before and after second-line chemotherapy and the change in levels reported.
Treatment response was typically evaluated by computed tomography/magnetic resonance imaging according to the Response Evaluation Criteria in Solid Tumors [39]. Treatment responses were classified as complete response (CR), partial response (PR), PD, and SD. Only patients with SD, PR, and CR continued chemotherapy.
Statistical analysis
All statistical analyses were performed using the SPSS statistical software (Version 19.0, IBM Corp.). D-dimer levels were presented as the mean ± standard deviation and compared using Wilcoxon signed-rank tests. OS was defined as the time from the date of treatment with second-line chemotherapy to the date of the last follow-up or death from any cause. The optimal cut-off values for the D1, D2, and ΔD were determined by ROC analysis using OS as the end-point. Kaplan-Meier analysis was performed to generate survival curves. To identify independent prognostic factors, univariable and multivariable analyses were performed using Cox regression models. The AUC was calculated and compared to evaluate the abilities of the D1, D2, and ΔD in discriminating the response to second-line chemotherapy. P values were two-sided, and a P < 0.05 was considered statistically significant.
CONFLICTS OF INTEREST
The authors declare that there are no conflicts of interest.
GRANT SUPPORT
The study was supported by grants from the National Natural Science Foundation of China (No. 81001191) and Science and Technology Commission of Shanghai, China (No. 10PJ1408300).
REFERENCES
1. Bielack SS, Kempf-Bielack B, Delling G, Exner GU, Flege S, Helmke K, Kotz R, Salzer-Kuntschik M, Werner M, Winkelmann W, Zoubek A, Jurgens H, Winkler K. Prognostic factors in high-grade osteosarcoma of the extremities or trunk: an analysis of 1,702 patients treated on neoadjuvant cooperative osteosarcoma study group protocols. J Clin Oncol. 2002; 20: 776-90.
2. Duong LM, Richardson LC. Descriptive epidemiology of malignant primary osteosarcoma using population-based registries, United States, 1999-2008. J Registry Manag. 2013; 40: 59-64.
3. Longhi A, Errani C, De Paolis M, Mercuri M, Bacci G. Primary bone osteosarcoma in the pediatric age: state of the art. Cancer Treat Rev. 2006; 32: 423-36. doi: 10.1016/j.ctrv.2006.05.005.
4. Mirabello L, Troisi RJ, Savage SA. Osteosarcoma incidence and survival rates from 1973 to 2004: data from the Surveillance, Epidemiology, and End Results Program. Cancer. 2009; 115: 1531-43. doi: 10.1002/cncr.24121.
5. Briccoli A, Rocca M, Salone M, Guzzardella GA, Balladelli A, Bacci G. High grade osteosarcoma of the extremities metastatic to the lung: long-term results in 323 patients treated combining surgery and chemotherapy, 1985-2005. Surg Oncol. 2010; 19: 193-9. doi: 10.1016/j.suronc.2009.05.002.
6. Chen F, Miyahara R, Bando T, Okubo K, Watanabe K, Nakayama T, Toguchida J, Date H. Repeat resection of pulmonary metastasis is beneficial for patients with osteosarcoma of the extremities. Interact Cardiovasc Thorac Surg. 2009; 9: 649-53. doi: 10.1510/icvts.2009.212498.
7. Bone sarcomas: ESMO Clinical Practice Guidelines for diagnosis, treatment and follow-up. Ann Oncol. 2014; 25 Suppl 3: iii113-23. doi: 10.1093/annonc/mdu256.
8. Wojtukiewicz MZ, Sierko E, Klement P, Rak J. The hemostatic system and angiogenesis in malignancy. Neoplasia. 2001; 3: 371-84.
9. Ruf W, Yokota N, Schaffner F. Tissue factor in cancer progression and angiogenesis. Thromb Res. 2010; 125 Suppl 2: S36-8. doi: 10.1016/S0049-3848(10)70010-4.
10. Tripodi A. D-dimer testing in laboratory practice. Clin Chem. 2011; 57: 1256-62. doi: 10.1373/clinchem.2011.166249.
11. Batschauer AP, Figueiredo CP, Bueno EC, Ribeiro MA, Dusse LM, Fernandes AP, Gomes KB, Carvalho MG. D-dimer as a possible prognostic marker of operable hormone receptor-negative breast cancer. Ann Oncol. 2010; 21: 1267-72. doi: 10.1093/annonc/mdp474.
12. Oya M, Akiyama Y, Okuyama T, Ishikawa H. High preoperative plasma D-dimer level is associated with advanced tumor stage and short survival after curative resection in patients with colorectal cancer. Jpn J Clin Oncol. 2001; 31: 388-94.
13. Diao D, Zhu K, Wang Z, Cheng Y, Li K, Pei L, Dang C. Prognostic value of the D-dimer test in oesophageal cancer during the perioperative period. J Surg Oncol. 2013; 108: 34-41. doi: 10.1002/jso.23339.
14. Zhang PP, Sun JW, Wang XY, Liu XM, Li K. Preoperative plasma D-dimer levels predict survival in patients with operable non-small cell lung cancer independently of venous thromboembolism. Eur J Surg Oncol. 2013; 39: 951-6. doi: 10.1016/j.ejso.2013.06.008.
15. Sun W, Ren H, Gao CT, Ma WD, Luo L, Liu Y, Jin P, Hao JH. Clinical and Prognostic Significance of Coagulation Assays in Pancreatic Cancer Patients With Absence of Venous Thromboembolism. Am J Clin Oncol. 2015; 38: 550-6. doi: 10.1097/01.coc.0000436088.69084.22.
16. Sakurai M, Satoh T, Matsumoto K, Michikami H, Nakamura Y, Nakao S, Ochi H, Onuki M, Minaguchi T, Yoshikawa H. High Pretreatment Plasma D-dimer Levels Are Associated With Poor Prognosis in Patients With Ovarian Cancer Independently of Venous Thromboembolism and Tumor Extension. Int J Gynecol Cancer. 2015; 25: 593-8. doi: 10.1097/IGC.0000000000000415.
17. Go SI, Lee MJ, Lee WS, Choi HJ, Lee US, Kim RB, Kang MH, Kim HG, Lee GW, Kang JH, Lee JH, Kim SJ. D-Dimer Can Serve as a Prognostic and Predictive Biomarker for Metastatic Gastric Cancer Treated by Chemotherapy. Medicine (Baltimore). 2015; 94: e951. doi: 10.1097/md.0000000000000951.
18. Ge LP, Li J, Bao QL, Chen P, Jiang Q, Zhu LR. Prognostic and predictive value of plasma D-dimer in advanced non-small cell lung cancer patients undergoing first-line chemotherapy. Clin Transl Oncol. 2015; 17: 57-64. doi: 10.1007/s12094-014-1198-2.
19. Inanc M, Er O, Karaca H, Berk V, Ozkan M, Dikilitas M, Elmali F. D-dimer is a marker of response to chemotherapy in patients with metastatic colorectal cancer. J buon. 2013; 18: 391-7.
20. Liu P, Wang Y, Tong L, Xu Y, Zhang W, Guo Z, Ni H. Elevated preoperative plasma D-dimer level is a useful predictor of chemoresistance and poor disease outcome for serous ovarian cancer patients. Cancer Chemother Pharmacol. 2015; 76: 1163-71. doi: 10.1007/s00280-015-2900-y.
21. Brown DM, Ruoslahti E. Metadherin, a cell surface protein in breast tumors that mediates lung metastasis. Cancer Cell. 2004; 5: 365-74.
22. Kvolik S, Jukic M, Matijevic M, Marjanovic K, Glavas-Obrovac L. An overview of coagulation disorders in cancer patients. Surg Oncol. 2010; 19: e33-46. doi: 10.1016/j.suronc.2009.03.008.
23. Falanga A, Panova-Noeva M, Russo L. Procoagulant mechanisms in tumour cells. Best Pract Res Clin Haematol. 2009; 22: 49-60. doi: 10.1016/j.beha.2008.12.009.
24. Palumbo JS, Talmage KE, Massari JV, La Jeunesse CM, Flick MJ, Kombrinck KW, Jirouskova M, Degen JL. Platelets and fibrin(ogen) increase metastatic potential by impeding natural killer cell-mediated elimination of tumor cells. Blood. 2005; 105: 178-85. doi: 10.1182/blood-2004-06-2272.
25. Maragoudakis ME, Tsopanoglou NE, Andriopoulou P. Mechanism of thrombin-induced angiogenesis. Biochem Soc Trans. 2002; 30: 173-7. doi: 10.1042/.
26. Chiarug V, Ruggiero M, Magnelli L. Angiogenesis and the unique nature of tumor matrix. Mol Biotechnol. 2002; 21: 85-90.
27. Palumbo JS, Kombrinck KW, Drew AF, Grimes TS, Kiser JH, Degen JL, Bugge TH. Fibrinogen is an important determinant of the metastatic potential of circulating tumor cells. Blood. 2000; 96: 3302-9.
28. Palumbo JS, Potter JM, Kaplan LS, Talmage K, Jackson DG, Degen JL. Spontaneous hematogenous and lymphatic metastasis, but not primary tumor growth or angiogenesis, is diminished in fibrinogen-deficient mice. Cancer Res. 2002; 62: 6966-72.
29. Bugge TH, Kombrinck KW, Xiao Q, Holmback K, Daugherty CC, Witte DP, Degen JL. Growth and dissemination of Lewis lung carcinoma in plasminogen-deficient mice. Blood. 1997; 90: 4522-31.
30. Righini M, Perrier A, De Moerloose P, Bounameaux H. D-Dimer for venous thromboembolism diagnosis: 20 years later. J Thromb Haemost. 2008; 6: 1059-71. doi: 10.1111/j.1538-7836.2008.02981.x.
31. Crippa L, D’Angelo SV, Tomassini L, Rizzi B, D’Alessandro G, D’Angelo A. The utility and cost-effectiveness of D-dimer measurements in the diagnosis of deep vein thrombosis. Haematologica. 1997; 82: 446-51.
32. Zacharski LR, Wojtukiewicz MZ, Costantini V, Ornstein DL, Memoli VA. Pathways of coagulation/fibrinolysis activation in malignancy. Semin Thromb Hemost. 1992; 18: 104-16. doi: 10.1055/s-2007-1002415.
33. Cui L, Sun YH, Chen J, Wang L, Liu JJ, Zhou XR, Ding J, Liu XX, Huang XE. Analysis of Prethrombotic States in Patients with Malignant Tumors. Asian Pac J Cancer Prev. 2015; 16: 5477-82.
34. Verheul HM, Hoekman K, Lupu F, Broxterman HJ, van der Valk P, Kakkar AK, Pinedo HM. Platelet and coagulation activation with vascular endothelial growth factor generation in soft tissue sarcomas. Clin Cancer Res. 2000; 6: 166-71.
35. Nakashima J, Tachibana M, Ueno M, Baba S, Tazaki H. Tumor necrosis factor and coagulopathy in patients with prostate cancer. Cancer Res. 1995; 55: 4881-5.
36. Kim HK, Song KS, Lee KR, Kang YH, Lee YJ, Lee ES. Comparison of plasma D-dimer and thrombus precursor protein in patients with operable breast cancer as a potential predictor of lymph node metastasis. Blood Coagul Fibrinolysis. 2004; 15: 9-13.
37. Pectasides D, Tsavdaridis D, Aggouridaki C, Tsavdaridou V, Visvikis A, Tsatalas K, Fountzilas G. Effects on blood coagulation of adjuvant CNF (cyclophosphamide, novantrone, 5-fluorouracil) chemotherapy in stage II breast cancer patients. Anticancer Res. 1999; 19: 3521-6.
38. Kumar A, Chaturvedi P, Gupta YN. Combination chemotherapy for breast carcinoma using a combination of cyclophosphamide, methotrexate and 5-fluorouracil (CMF) causes a platelet aggregation defect. Int J Cancer. 1996; 66: 159-61. doi: 10.1002/(SICI)1097-0215(19960410)66:2<159::AID-IJC3>3.0.CO;2-1.
39. Therasse P, Arbuck SG, Eisenhauer EA, Wanders J, Kaplan RS, Rubinstein L, Verweij J, Van Glabbeke M, van Oosterom AT, Christian MC, Gwyther SG. New guidelines to evaluate the response to treatment in solid tumors. European Organization for Research and Treatment of Cancer, National Cancer Institute of the United States, National Cancer Institute of Canada. J Natl Cancer Inst. 2000; 92: 205-16.