
INTRODUCTION
In recent years, a field of research came to the fore that aims at correlating different genetic imprints of glioblastoma multiforme (GBM) with certain imaging traits in Magnetic Resonance (MR) imaging. Diehn et al. described different “radiogenomic” MR imaging traits corresponding to specific gene expression patterns [1]. For example, contrast enhancement correlated with genes belonging to a hypoxia gene set, containing genes such as VEGF, Serpine, ADM or PLAUR. Tumors with an increased expression of genes associated with proliferation had a severe mass effect. Two subtypes were identified to have a specific clinical impact: patients with an infiltrative imaging pattern had a worse outcome in comparison to patients with an edematous appearance. Between both groups, typically mesenchymal and proneural genes (OLIG1, OLIG2, SOX6) were differently expressed. Furthermore, an enrichment of gene sets of CNS development and developmental functions were described in the infiltrative subtype. These findings suggest a higher fraction of stem cells in the infiltrative subgroup.
Jamshidi et al. 2010 used the same radiogenomic features for an extended molecular analysis, and added expression datasets and copy number variants to find specific pathway correlations [2]. LTBP1 and RUNX3 were identified in the contrast-enhancing subtype and CHI3L1 was significantly higher expressed in a subgroup associated with a subventricular zone involvement. Two recently published studies showed a connection between hyper-perfusion of GBM and EGFR expression or EGFRvIII mutation [3, 4]. By using MR perfusion weighted imaging, an increased cerebral blood volume (CBV) was reported in tumors with EGFR amplification, PTEN deletion, and normal unmethylated O-6-methylguanine-DNA methyltransferase (MGMT) [5]. Jain et al. showed an impaired overall survival in GBM with increased CBV. The utilization of the molecular sub-classification of Verhaak [6] improved this connection, but a difference of CBV between the molecular subclasses could not be found [7]. The CBV is calculated from dynamic susceptibility contrast imaging (DSC). An extension of this method allows calculating the size of the capillaries within a range of 10 – 150 μm [8]. Kellner et al. described a strong correlation between histological vessel size in biopsy specimen and vessel size perfusion imaging [9]. Kickingereder et al. identified a decrease of CBV in IDH-mutated patients [10]. In a set of 73 patients with low grade and anaplastic gliomas, the IDH-mutations status could be correctly predicted by CBV in 88%. This study was based only on CBV data and IDH sequencing of 73 patients, whereas an expression analysis without CBV estimation had been performed on 288 patients from the cancer genome atlas (TCGA) [10]. A study by Barajas et al. revealed a different genetic clustering of contrast and non contrast-enhancing tumor by CBV-guided biopsies in a set of 13 GBM [11]. So many genetic observations there are about CBV, so few can be found on the vascular marker “vessel size” (VS). Thus, the purpose of this study was to identify specific genetic profiles and corresponding pathway activation or deactivation associated with the perfusion parameters VS and CBV by an integrative analysis of genetic and perfusion data. The identified genes were to be applied on 484 TCGA data sets for validation.
RESULTS
In Figure 1, MR images and perfusion maps of two patients with low and high perfusion parameters are given. Detailed data on the patients is given in Table 1.
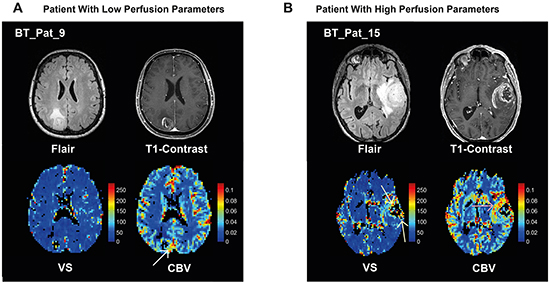
Figure 1: Examples of MR imaging. A. 63 year-old female patient with a GBM in the right parietal lobe. A FLAIR hyperintense tumor with perifocal edema (top left) with rim-like contrast enhancement and a small central necrosis (top right) is present. The map of vessel size, VS, (bottom left) does not show any increased vessel size. On the CBV map (bottom right) only a shadowy increase of the CBV can be depicted at the rim of the tumor (whitw arrow). B. 76 year-old male patient with a GBM in the left temporal lobe. There is a FLAIR hyperintense tumor with perifocal edema (top left) with a thick area of contrast enhancement and a central necrosis (top right). The map of VS (bottom left) reveals increased vessel sizes on the anterior and posterior edges of the tumor (yellow arrows). On the CBV map (bottom right) a strong increase of CBV can be depicted predominantly at the anterior and medial rim of the tumor (red arrow). Both examples show that the VS and CBV calculations result in different non-concordant values in different tumor regions supporting the assumption that both parameters reflect different phenomena of tumor vascularization. The color-bars indicate CBV [ml/100ml tissue] or VS [μm].
Table 1: Summarized data of all included patients
Sample |
IDH1-R132H |
VS [μm] |
CBV [%] |
Expression Subgroup |
Age |
Sex |
|---|---|---|---|---|---|---|
BT_Pat_1 |
wt |
103 |
9 |
Proneural |
65 |
male |
BT_Pat_2 |
wt |
46 |
2 |
Proneural |
47 |
female |
BT_Pat_3 |
wt |
80 |
6 |
Proneural |
41 |
female |
BT_Pat_4 |
wt |
80 |
6 |
Mesenchymal |
55 |
female |
BT_Pat_5 |
wt |
77 |
6 |
Proneural |
84 |
female |
BT_Pat_6 |
wt |
91 |
11 |
Mesenchymal |
65 |
female |
BT_Pat_7 |
wt |
76 |
6 |
Classical |
74 |
female |
BT_Pat_8 |
wt |
102 |
8 |
Classical |
47 |
female |
BT_Pat_9 |
wt |
52 |
6 |
Proneural |
63 |
female |
BT_Pat_10 |
wt |
83 |
5.5 |
Neural |
75 |
male |
BT_Pat_11 |
wt |
99 |
10 |
Mesenchymal |
78 |
male |
BT_Pat_12 |
wt |
108 |
8 |
Mesenchymal |
76 |
male |
BT_Pat_13 |
mut |
43 |
4 |
Proneural |
66 |
male |
BT_Pat_14 |
wt |
58 |
4 |
Proneural |
79 |
male |
BT_Pat_15 |
wt |
117 |
7 |
Mesenchymal |
76 |
male |
BT_Pat_16 |
mut |
90 |
6 |
Proneural |
66 |
male |
BT_Pat_17 |
wt |
72 |
7 |
Proneural |
61 |
female |
BT_Pat_18 |
wt |
74 |
5 |
Proneural |
64 |
male |
BT_Pat_19 |
wt |
110 |
11 |
Mesenchymal |
69 |
female |
BT_Pat_20 |
mut |
103 |
9 |
Proneural |
77 |
male |
BT_Pat_21 |
wt |
96 |
7 |
Mesenchymal |
42 |
male |
Genetics of the study samples
Weighted Gene Co-Expression Network Analysis (WGCNA) of the whole array dataset identified 36 modules. A cluster of cluster analysis of these modules is shown in Figure 2. VS and CBV, although thought to be both dependent on tumor vascularization, were surprisingly clustered in different branches. The difference between the molecular backgrounds of both perfusion parameters was subject of further analysis.
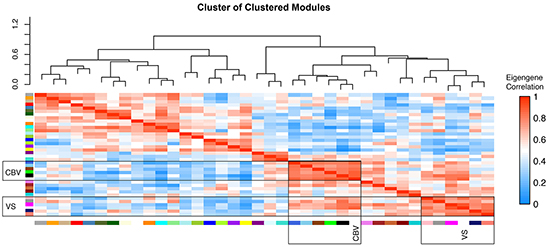
Figure 2: WGCNA cluster of clusters. cluster of clusters analysis of modules generated by weighted gene co-expression analysis of genome wide expression analysis. High correlation values are indicated by red, negative correlations by blue colour. CBV and VS associated modules are clustered in differed branches.
Five modules could be identified as being significantly correlated with CBV and VS, respectively, Supplementary Figure S1. Those modules with the most exclusive and highest correlation coefficient for each parameter were taken into further consideration. A module called “royal blue” for CBV had a correlation coefficient of r = 0.78, p = 6E-50, another one called “pink” for VS had a correlation coefficient of r = 0.57, p = 2.3 E-51. To characterize these modules, a pre-ranked permutation based GSEA was performed, Figure 3A-3D.
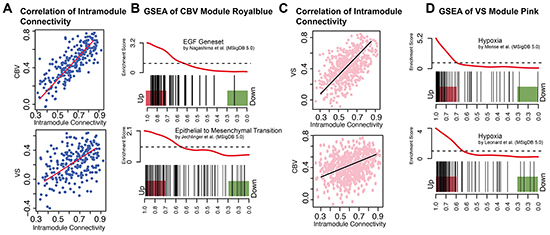
Figure 3: CBV and VS Specific modules. A. Scatter plot of intramodule connectivity (module royal blue) correlated with CBV (top) and VS (bottom) vectors. B. Enrichment plot (GSEA) of module royal blue. EGF-Pathway and Epithelial-to-Mesenchymal Transition are enriched in royal blue hub-genes. C. Scatter plot of intramodule connectivity (module pink) correlated with VS (top) and CBV (bottom) vectors. D. Enrichment plot (GSEA) of module pink and different hypoxia gene sets. Hub-genes of the pink module are highly enriched in different hypoxia genesets.
As shown in Figure 3A, module royal blue was highly correlated to CBV, whereas the correlation with VS was less pronounced (r = 0.53, p = 1.2E-18). The royal blue module showed its strongest association to EGF and EMT pathways in the GSEA (Supplementary Table S1). Gene sets of EGF up-regulation [12] and EMT [13] were enriched with a pFWER< 0.01, Figure 3B.
The pink module was strongly correlated to VS (r = 0.57, p = 2.3E-51), but not to CBV (r = 0.25, p = 9.9E-10). The pink module showed its strongest association with hypoxia pathways in the GSEA, Figure 3C. Nine hypoxia gene sets were enriched with a pFWER < 0.01, Figure 3D.
In the royal blue module, ARAF and TRAF were identified as hub-genes, Figure 4A. ARAF takes part of the RAS-MAPK pathway being activated by EGF/EGFR activation and supporting invasiveness of gliomas [14, 15]. The TRAF-family also activate the MAPK-pathway and takes part in angiogenesis [16]. For the pink module, HIF1A and BNIP3L could be identified as hub-genes, Figure 4B. HIF1A is a well-known regulator of hypoxia related pathways [17]. BNIP3L has been described as a regulator of hypoxia in conditions of DNA damage [18]. This transcription factor is regulated by methylation and interacts with the MEPK/ERK pathway [19].
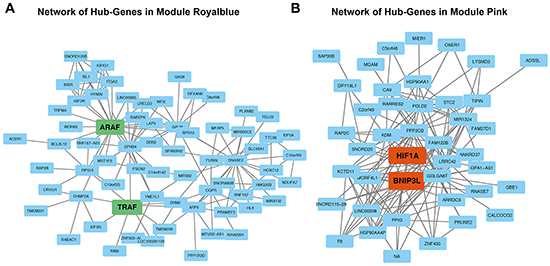
Figure 4: Network analysis. A. Network analysis of module royal blue. Genes marked in green display module-hub-genes. B. Network analysis of module pink. Genes marked in orange display module-hub-genes.
Unsupervised clustering of the CBV correlated genes revealed a separation into two clusters (heatmap in the upper row, Figure 5A). In the first (blue) cluster, mean CBV was 8.7 ± 1.4 [ml/100ml tissue], in the second (brown) cluster CBV was 5.1 ± 1.2 [ml/100ml tissue], pcorr<0.01. In the cluster with high CBV, predominantly patients of the mesenchymal GBM subgroup were present, whereas in the cluster with low CBV, except for one case, only patients of the proneural GBM subgroup could be identified. Additionally, a Wilcoxon model confirmed a significant connection of high CBV values and the mesenchymal subgroup (p<0.05). The heatmap in the lower row displays the enrichment of angiogenesis pathway activation in each patient (Single Sample Gene Set Enrichment Analysis, ssGSEA). Angiogenesis genes were strongly enriched in the high CBV cluster.
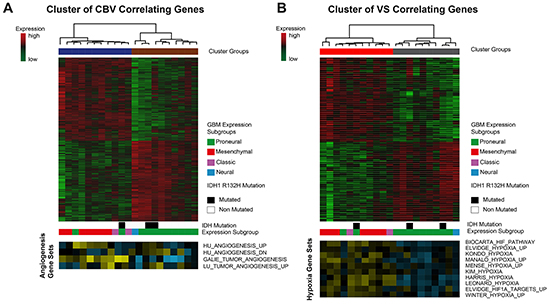
Figure 5: Cluster analysis of CBV and VS correlated genes. A. CBV-associated genes are clustered by Spearman’s rank correlation into two clusters. Bars below the heatmap describe IDH1-status and expression subgroup of each patient. The heatmap at the bottom shows different angiogenesis pathways and their enrichment in each patient. (yellow: high enrichment, blue: low enrichment) B. VS-associated genes are clustered by Spearman’s rank correlation into two clusters. Bars below the heatmap describe IDH1-status and expression subgroup of each patient. The heatmap at the bottom shows different hypoxia pathways and their enrichment in each patient. (yellow: high enrichment, blue: low enrichment).
Applying the same procedure for the VS correlated genes also resulted in two clusters (heatmap of the upper row, Figure 5B). In the first (red) cluster mean VS was 101.9 ± 7.98 [μm] in the second (gray) cluster VS was 67.36 ± 9.33 [μm], pcorr<0.01. The cluster with high VS contained predominantly patients of the mesenchymal GBM subgroup, the one with low VS those of the proneural GBM subgroup. This effect was statistically significant (p<0.05). Three patients with IDH 1 mutation were distributed over all clusters. ssGSEA scores of hypoxia pathway enrichment is shown in the bottom row. Patients belonging to the high VS cluster exhibited a strong enrichment of hypoxia pathway genes.
Comparison with the TCGA validation group
Modules royal blue and pink were validated in the TCGA database to confirm the findings described above. Hierarchical clustering of genes contained in the CBV related module royal blue showed five different cluster-groups. One out of five was significantly associated with the proneural-, another with the mesenchymal-subgroup, Figure 6A. Survival analysis of both groups showed no significant differences, Figure 6B. Hierarchical clustering of genes contained in the VS related module pink showed three different cluster-groups, Figure 6C. Cluster-group I contained patients with mesenchymal tumors, while cluster-group II was associated to a proneural signature and IDH mutation. Survival analysis of both cluster-groups showed a significantly superior overall-survival (Cluster I: 294 days CI-95% 270-350, Cluster I: 384 days CI-95% 221-737, p=0.023) for patients with low expression of VS related genes, Figure 6D. In addition, a validation of CBV and VS correlated genes (Figure 5) is given in the supplementary description.
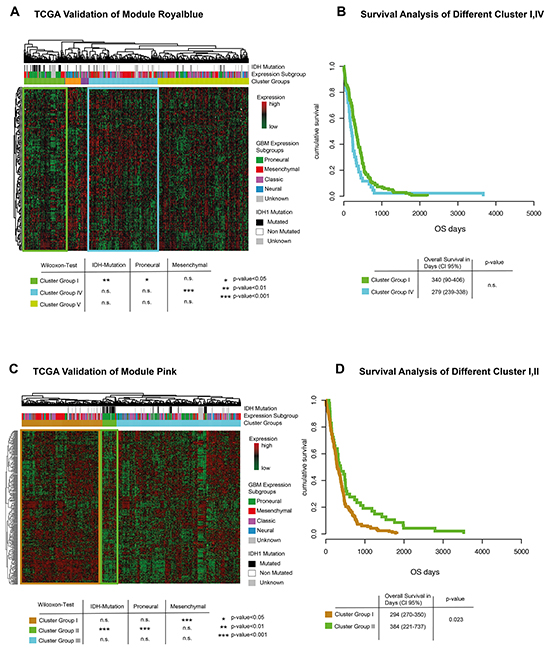
Figure 6: TCGA validation. A. Genes of module royal blue are extracted and clustered in an unsupervised way. Bars above the heatmap describe IDH1-mutation status and expression subgroup of each patient. Significance values for each cluster and associated genetic subgroups are given in a table below. B. Kaplan-Meier plot of cluster-group I and IV. No significant difference could be detected. C. Genes of module pink are extracted and clustered in an unsupervised way. Bars above the heatmap describe IDH1-mutation status and expression subgroup of each patient. Significance values for each cluster and associated genetic subgroups are given in a table below. Interestingly, patients with IDH mutation are predominantly found in the clusters with low expression levels. E. Kaplan-Meier plot of cluster-group I and II. Cluster-group II showed a significantly better survival.
DISCUSSION
This study aimed for a direct genetic description of specific expression profiles and pathways being related to CBV and VS, which has only been performed by indirect analysis in the literature so far [10]. A further aim was to identify gene modules being exclusively correlated to CBV or VS. Both parameters derive from MR perfusion imaging and are thought to reflect the vascularization of brain tumors. An integrative analysis of transcriptome profiling and imaging parameters was used to identify differences. The gene sets found for both parameters were applied on 484 TCGA samples for further validation.
Cerebral blood volume
CBV was highly correlated to modules showing a significant enrichment of the EGF pathway. In a further network analysis ARAF/TRAF were identified as hub-genes of the highest correlating module (royal blue). ARAF is a part of the RAS-MAPK pathway. The RAS-MAPK activation in different cancers is a well-known pathway that supports tumor proliferation, migration and invasiveness [20–23]. TRAF belongs to the TNF-signal-cascade and affects EGF pathway by NFkB [16]. In a recent study, Kickingereder et al, 2015 [10] described a strong association between CBV and IDH mutation. IDH mutated tumors had significant lower CBV values than IDH wild-type tumors. On consecutive TCGA analysis, IDH wild type tumors showed higher enrichment for hypoxia, angiogenesis and vasculogenesis gene sets than IDH mutant tumors. This lead to the hypothesis, that CBV mirrors this genetic connection, even though transcriptome profiling data of patients with estimated CBV were not available. Our results on direct transcriptome profiling data, however, could show that higher CBV values were more associated to EGF signaling, a RAF/RAS pathway activation and epithelial to mesenchymal transition genes than to hypoxia.
Vessel-size
VS correlated genes showed a significant enrichment of hypoxia related genes. HIF1A and BNIP3L were identified as hub-genes in the highest correlating module (pink). HIF1A, the hypoxia-inducing factor, is a transcription factor up-regulated under hypoxic conditions. HIF1A binds to hypoxia responsive elements (HRE) and activates several genes like VGFR. This activation leads to abnormal vascular proliferation in gliomas [17, 24, 25]. So the vessel size (VS) estimated by MR perfusion imaging seems to represent the microvascular environment and abnormal vascular proliferation induced by HIF1A activity. The other identified gene was BNIP3L, known to be up-regulated in conditions of hypoxia and simultaneous DNA damage [18, 26]. A hallmark of high-grade gliomas is the presence of genetic alterations, including gene mutations and DNA damage [27]. So, these results of the network analysis are in line with typical glioma associated pathways. Unsupervised clustering confirmed the association found between VS and hypoxia related genes.
Comparison with TCGA data
The replication of the CBV and VS derived clusters on the TCGA database corroborates our results. As shown on our own cohort, an assignment into mesenchymal and proneural signature was possible according to both measures of vascularization. These results are in-line with the findings of Jain et al., who could show a trend to a higher CBV in the classical and mesenchymal subclass than in the neural and proneural subclass [7, 28].
The IDH-mutation, another genetic factor, was predominantly present in one of three patient clusters of VS-correlated genes, which is to say hypoxia-associated genes. This is a finding that was also postulated by Kickingereder et al. [10]. The missing replication of this finding in our own cohort is most probably due to the low number of cases (only three IDH mutant tumors).
Limitations
The main limitation of this study is the small number of cases. This is the reason, why TCGA data was taken for further validation. Moreover, conservative statistical methods with corrections for multiple testing at each level of analysis were applied. Only family wise error corrected values are reported for the sake of robustness. The wide field of genetic and radiophenomic heterogeneity within GBM tumors was not addressed in this study, as only single tumor biopsies were taken in specific regions based on perfusion imaging. Therefore, findings of this study were to be construed as local radiogenomic results.
In conclusion, this study realized a radiogenomic mapping of glioblastoma multiforme by perfusion imaging parameters (CBV and VS) and genome-wide expression profiling. CBV is a better method to show angiogenesis and EGF pathway activation, whereas VS is more sensitive to detect hypoxia in GBM.
MATERIALS AND METHODS
Patients
Twenty-one patients (median age 66 years, range 41 – 84 years, 9 females) with primary glioblastoma multiforme were prospectively included into this study. They underwent surgery at the Department of Neurosurgery between 2012 and 2014. The local ethics committee approved data evaluation, imaging procedures and experimental design (protocol 100020/09 and 5565/15). The methods were carried out in accordance with the approved guidelines. Written informed consent was obtained from all patients.
Inclusion criteria were: (1) age older than 18 years, (2) preoperative MRI with perfusion imaging, (3) intraoperative MRI-guided sampling of tumor tissue from contrast-enhancing tumor, (4) histopathological confirmation of a glioblastoma multiforme (WHO criteria).
Validation dataset of TCGA data
Publicly available Level 3 TCGA (https://tcga-data.nci.nih.gov/tcga/) data was used for analysis. Data was downloaded at the UCSC Cancer Genome Browser. Only patients with full datasets were included. Expression analyses were based on Agilent array data (TCGA GBM G4502A) for high-grade glioma. Expression data was normalized and log2 transformed. Clustering and further analysis were performed in R-software designed pipeline as described in the WGCNA section.
Tissue collection and histology
Tumor tissue was sampled from contrast enhancing regions identified by intraoperative neuronavigation (Cranial Map Neuronavigation Cart 2, Stryker, Freiburg, Germany) during resection. The tissue was snap-frozen in liquid nitrogen immediately and processed for further genetic analysis. Tissue samples were fixed using 4% phosphate buffered formaldehyde and paraffin-embedded with standard procedures. H&E staining was performed on 4 μm paraffin sections using standard protocols. Immunohistochemistry was applied using an autostainer (Dako) after heat-induced epitope retrieval in citrate buffer. IDH1 mutation was assessed by immunohistochemistry using an anti-IDH1-R123H antibody (1:20, Dianova).
MR-imaging
MR imaging was performed on a 3T system (Magnetom TIM TRIO, Siemens, Erlangen, Germany) using a 12-channel head coil. The imaging protocol consisted of a 3D T2-weighted fluid attenuated sequence (repetition time (TR), 5,000ms; effective echo time (TEeff), 388ms; inversion time (TI), 1,800 ms; flip angle, variable; pixel size; 1mm3), a 3D T1-weighted magnetization prepared rapid gradient echo sequence (TR, 1390ms; TE, 2.15ms; TI, 800ms; flip angle, 15°; pixel size; 1mm3) was acquired before and after perfusion imaging with application of 17 ml 0.5 M Gadobenate Dimeglumin (Multihance ®, Bracco, Konstanz, Germany), followed by a chaser of 60 ml NaCl 0.9% solution for perfusion imaging, flow rate 3ml/s. Perfusion imaging consisted of 2D serial, single shot, double-echo readout echo planar imaging (EPI) sequences (TR, 2,000ms; TEGE, 21ms; TESE, 94ms, pixel size 2.5 x 2.5 x 5mm3) during bolus passage [9].
MRI post-processing
Perfusion data was processed by T1 leakage correction, estimation of the AIF, and calculation of the vessel size and the cerebral blood volume (CBV) as described by Kellner et al. and by the literature cited in there [11]. CBV was normalized to a whole brain median value of 3.2%, equal to the works of Jain et al. [7, 28].
Genome-wide expression analysis
RNA was prepared using the RNAeasy kit (Qiagen). An amount of 1.5 μg RNA was obtained for expression arrays analysis. Arrays were performed by human genome 2.0 chip (Affymetrix). Raw data was processed, normalized and controlled by R software and the Affymetrix R-package. Different expression analysis and statistical testing (pairwise t-test) were performed by limma R-package.
Weighted gene co-expression network analysis (WGCNA) and gene set enrichment analysis (GSEA)
WGCNA uses the topological overlapping measurement to identify corresponding modules. The WGCNA analysis is a robust tool for integrative network analysis and was used in several recent studies [29–31]. For the analysis, a signed network analysis with the power of 14 was used to fulfill all criteria of scaled free topology as described by Peter Langfelder. In addition, the branch-cutting algorithm (PAM) with a deep split of two was applied to the analysis. Each identified module was ordered in a “cluster of clusters”-analysis by unsupervised hierarchical clustering. Modules were characterized by their module eigengenes and intramodule connectivity. The intramodule connectivity was correlated to a VS and CBV vector, each. To characterize the correlating modules, a pre-ranked permutation based GSEA [32] was performed (full GSEA data are available in the Supplementary Table S1). Pre-ranked GSEA were performed with 1000 permutations. P-values were calculated by familywise error rate (FWER) [33] which is a robust method for multiples testing. The Molecular Signatures Database version 5.0 was used including pathways gene sets (C2) (http://www.broadinstitute.org/gsea) as input database for this analysis. GSEA plots were visualized by limma R-package (barcodeplot function).
Networks were exported to Cytoscape 2.0 [34] for further visualization. The WGCNA integrated function (exportNetworkToCytoscape) was used to calculate a weighted network by its individual gene connectivity. This analysis identified specific networks for the pink and royal blue module as presented in Figure 4A and 4B. Hallmark genes of each module were characterized by their intramodule connectivity. These potentially important genes were defined as “hub-genes”. In addition a detailed description of WGCNA is given in Heiland et al., 2016 [35].
Statistical analysis
For non-parametric testing a Wilcoxon model was performed. The significance level was determined with a p-value< 0.05 and a power of 90%. The Kaplan-Meier method was used to provide median point estimates and time-specific rates. The Hazard-Ratio (HR) was calculated by Cox-Regression tests. Statistical tests were performed in R including affiliated packages.
CONFLICTS OF INTEREST
The authors state no conflicts of interest.
REFERENCES
1. Diehn M, Nardini C, Wang DS, McGovern S, Jayaraman M, Liang Y, Aldape K, Cha S, Kuo MD. Identification of noninvasive imaging surrogates for brain tumor gene-expression modules. Proc Natl Acad Sci U S A. 2008; 105: 5213–8. doi: 10.1073/pnas.0801279105.
2. Jamshidi N, Diehn M, Bredel M, Kuo MD. Illuminating radiogenomic characteristics of glioblastoma multiforme through integration of MR imaging, messenger RNA expression, and DNA copy number variation. Radiology. 2014; 270: 1–2. doi: 10.1148/radiol.13130078.
3. Gupta a, Young RJ, Shah a D, Schweitzer a D, Graber JJ, Shi W, Zhang Z, Huse J, Omuro a MP. Pretreatment Dynamic Susceptibility Contrast MRI Perfusion in Glioblastoma: Prediction of EGFR Gene Amplification. Clin Neuroradiol. 2014; : 1–8. doi: 10.1007/s00062-014-0289-3.
4. Qiao XJ, Ellingson BM, Kim HJ, Wang DJJ, Salamon N, Linetsky M, Sepahdari AR, Jiang B, Tian JJ, Esswein SR, Cloughesy TF, Lai A, Nghiemphu L, et al. Arterial spin-labeling perfusion MRI stratifies progression-free survival and correlates with epidermal growth factor receptor status in glioblastoma. AJNR Am J Neuroradiol. 2015; 36: 672–7. doi: 10.3174/ajnr.A4196.
5. Ryoo I, Choi SH, Kim J-H, Sohn C-H, Kim SC, Shin HS, Yeom JA, Jung SC, Lee AL, Yun TJ, Park C-K, Park S-H. Cerebral blood volume calculated by dynamic susceptibility contrast-enhanced perfusion MR imaging: preliminary correlation study with glioblastoma genetic profiles. PLoS One. 2013; 8: e71704. doi: 10.1371/journal.pone.0071704.
6. Verhaak RGW, Hoadley K a, Purdom E, Wang V, Qi Y, Wilkerson MD, Miller CR, Ding L, Golub T, Mesirov JP, Alexe G, Lawrence M, O'Kelly M, et al. Integrated genomic analysis identifies clinically relevant subtypes of glioblastoma characterized by abnormalities in PDGFRA, IDH1, EGFR, and NF1. Cancer Cell. Elsevier Ltd; 2010; 17: 98–110. doi: 10.1016/j.ccr.2009.12.020.
7. Jain R, Poisson L, Narang J, Gutman D, Scarpace L, Hwang SN, Holder C, Wintermark M, Colen RR, Kirby J, Freymann J, Brat DJ, Jaffe C, et al. Genomic mapping and survival prediction in glioblastoma: molecular subclassification strengthened by hemodynamic imaging biomarkers. Radiology. 2013; 267: 212–20. doi: 10.1148/radiol.12120846.
8. Kiselev VG, Strecker R, Ziyeh S, Speck O, Hennig J. Vessel size imaging in humans. Magn Reson Med. 2005; 53: 553–63. doi: 10.1002/mrm.20383.
9. Kellner E, Breyer T, Gall P, Müller K, Trippel M, Staszewski O, Stein F, Saborowski O, Dyakova O, Urbach H, Kiselev VG, Mader I. MR evaluation of vessel size imaging of human gliomas: Validation by histopathology. J Magn Reson Imaging. 2015; 42: 1117–25. doi: 10.1002/jmri.24864.
10. Kickingereder P, Sahm F, Radbruch A, Wick W, Heiland S, Deimling A von, Bendszus M, Wiestler B. IDH mutation status is associated with a distinct hypoxia/angiogenesis transcriptome signature which is non-invasively predictable with rCBV imaging in human glioma. Sci Rep. 2015; 5: 16238. doi: 10.1038/srep16238.
11. Barajas RF, Phillips JJ, Vandenberg SR, McDermott MW, Berger MS, Dillon WP, Cha S. Pro-angiogenic cellular and genomic expression patterns within glioblastoma influences dynamic susceptibility weighted perfusion MRI. Clin Radiol. 2015; 70: 1087–95. doi: 10.1016/j.crad.2015.03.006.
12. Nagashima T, Shimodaira H, Ide K, Nakakuki T, Tani Y, Takahashi K, Yumoto N, Hatakeyama M. Quantitative transcriptional control of ErbB receptor signaling undergoes graded to biphasic response for cell differentiation. J Biol Chem. 2007; 282: 4045–56. doi: 10.1074/jbc.M608653200.
13. Jechlinger M, Grunert S, Tamir IH, Janda E, Lüdemann S, Waerner T, Seither P, Weith A, Beug H, Kraut N. Expression profiling of epithelial plasticity in tumor progression. Oncogene. 2003; 22: 7155–69. doi: 10.1038/sj.onc.1206887.
14. Walker F, Kato A, Gonez LJ, Hibbs ML, Pouliot N, Levitzki A, Burgess AW. Activation of the Ras/mitogen-activated protein kinase pathway by kinase-defective epidermal growth factor receptors results in cell survival but not proliferation. Mol Cell Biol. 1998; 18: 7192–204.
15. Vitucci M, Karpinich NO, Bash RE, Werneke AM, Schmid RS, White KK, McNeill RS, Huff B, Wang S, Van Dyke T, Miller CR. Cooperativity between MAPK and PI3K signaling activation is required for glioblastoma pathogenesis. Neuro Oncol. 2013; 15: 1317–29. doi: 10.1093/neuonc/not084.
16. Zhang J, Peng B. In vitro angiogenesis and expression of nuclear factor kappaB and VEGF in high and low metastasis cell lines of salivary gland Adenoid Cystic Carcinoma. BMC Cancer. 2007; 7: 95. doi: 10.1186/1471-2407-7-95.
17. Kaur B, Khwaja FW, Severson EA, Matheny SL, Brat DJ, Van Meir EG. Hypoxia and the hypoxia-inducible-factor pathway in glioma growth and angiogenesis. Neuro Oncol. 2005; 7: 134–53. doi: 10.1215/S1152851704001115.
18. Fei P, Wang W, Kim SH, Wang S, Burns TF, Sax JK, Buzzai M, Dicker DT, McKenna WG, Bernhard EJ, El-Deiry WS. Bnip3L is induced by p53 under hypoxia, and its knockdown promotes tumor growth. Cancer Cell. 2004; 6: 597–609. doi: 10.1016/j.ccr.2004.10.012.
19. An H-J, Lee H, Paik S-G. Silencing of BNIP3 results from promoter methylation by DNA methyltransferase 1 induced by the mitogen-activated protein kinase pathway. Mol Cells. 2011; 31: 579–83. doi: 10.1007/s10059-011-0065-z.
20. Penman CL, Faulkner C, Lowis SP, Kurian KM. Current Understanding of BRAF Alterations in Diagnosis, Prognosis, and Therapeutic Targeting in Pediatric Low-Grade Gliomas. Front Oncol. 2015; 5: 54. doi: 10.3389/fonc.2015.00054.
21. Hussain MRM, Baig M, Mohamoud HSA, Ulhaq Z, Hoessli DC, Khogeer GS, Al-Sayed RR, Al-Aama JY. BRAF gene: From human cancers to developmental syndromes. Saudi J Biol Sci. 2015; 22: 359–73. doi: 10.1016/j.sjbs.2014.10.002.
22. Das G, Shiras A, Shanmuganandam K, Shastry P. Rictor regulates MMP-9 activity and invasion through Raf-1-MEK-ERK signaling pathway in glioma cells. Mol Carcinog. 2011; 50: 412–23. doi: 10.1002/mc.20723.
23. Bhattacharya D, Chaudhuri S, Singh MK, Chaudhuri S. T11TS inhibits Angiopoietin-1/Tie-2 signaling, EGFR activation and Raf/MEK/ERK pathway in brain endothelial cells restraining angiogenesis in glioma model. Exp Mol Pathol. 2015; 98: 455–66. doi: 10.1016/j.yexmp.2015.03.026.
24. Joseph J V, Conroy S, Pavlov K, Sontakke P, Tomar T, Eggens-Meijer E, Balasubramaniyan V, Wagemakers M, den Dunnen WFA, Kruyt FAE. Hypoxia enhances migration and invasion in glioblastoma by promoting a mesenchymal shift mediated by the HIF1?-ZEB1 axis. Cancer Lett. 2015; 359: 107–16. doi: 10.1016/j.canlet.2015.01.010.
25. Harris AL. Hypoxia--a key regulatory factor in tumour growth. Nat Rev Cancer. 2002; 2: 38–47. doi: 10.1038/nrc704.
26. Bellot G, Garcia-Medina R, Gounon P, Chiche J, Roux D, Pouysségur J, Mazure NM. Hypoxia-induced autophagy is mediated through hypoxia-inducible factor induction of BNIP3 and BNIP3L via their BH3 domains. Mol Cell Biol. 2009; 29: 2570–81. doi: 10.1128/MCB.00166-09.
27. Van Meir EG, Hadjipanayis CG, Norden AD, Shu H-K, Wen PY, Olson JJ. Exciting New Advances in Neuro-Oncology. CA Cancer J Clin. 2010; 60: 166–93. doi: 10.3322/caac.20069.
28. Jain R, Poisson LM, Gutman D, Scarpace L, Hwang SN, Holder CA, Wintermark M, Rao A, Colen RR, Kirby J, Freymann J, Jaffe CC, Mikkelsen T, et al. Outcome prediction in patients with glioblastoma by using imaging, clinical, and genomic biomarkers: focus on the nonenhancing component of the tumor. Radiology. 2014; 272: 484–93. doi: 10.1148/radiol.14131691.
29. Langfelder P, Horvath S. WGCNA: an R package for weighted correlation network analysis. BMC Bioinformatics. 2008; 9: 559. doi: 10.1186/1471-2105-9-559.
30. Holtman IR, Raj DD, Miller JA, Schaafsma W, Yin Z, Brouwer N, Wes PD, Möller T, Orre M, Kamphuis W, Hol EM, Boddeke EWGM, Eggen BJL. Induction of a common microglia gene expression signature by aging and neurodegenerative conditions: a co-expression meta-analysis. Acta Neuropathol Commun. 2015; 3: 31. doi: 10.1186/s40478-015-0203-5.
31. Iancu OD, Colville A, Oberbeck D, Darakjian P, McWeeney SK, Hitzemann R. Cosplicing network analysis of mammalian brain RNA-Seq data utilizing WGCNA and Mantel correlations. Front Genet. 2015; 6: 174. doi: 10.3389/fgene.2015.00174.
32. Subramanian A, Tamayo P, Mootha VK, Mukherjee S, Ebert BL, Gillette MA, Paulovich A, Pomeroy SL, Golub TR, Lander ES, Mesirov JP. Gene set enrichment analysis: a knowledge-based approach for interpreting genome-wide expression profiles. Proc Natl Acad Sci U S A. 2005; 102: 15545–50. doi: 10.1073/pnas.0506580102.
33. Benjamini Y, Hochberg Y. Controlling the false discovery rate: a practical and powerful approach to multiple testing. Journal of the Royal Statistical Society. 1995. p. 289–300. doi: 10.2307/2346101.
34. Shannon P, Markiel A, Ozier O, Baliga NS, Wang JT, Ramage D, Amin N, Schwikowski B, Ideker T. Cytoscape: a software environment for integrated models of biomolecular interaction networks. Genome Res. 2003; 13: 2498–504. doi: 10.1101/gr.1239303.
35. Heiland DH, Mader I, Schlosser P, Pfeifer D, Carro MS, Lange T, Schwarzwald R, Vasilikos I, Urbach H, Weyerbrock A. Integrative Network-based Analysis of Magnetic Resonance Spectroscopy and Genome Wide Expression in Glioblastoma multiforme. Sci Rep. 2016; 6: 29052. doi: 10.1038/srep29052.