
INTRODUCTION
Hepatitis C virus (HCV) affects 180 million people worldwide and is the major cause of liver cirrhosis [1]. Approximately 1%–4% of cirrhotic patients may progress to the development of hepatocellular carcinoma [2]. There are six HCV genotypes and more than 50 subtypes worldwide [3]. The most common HCV genotypes in Taiwan are genotypes 1b, 2a, 2b and 3a [4]. Combined peginterferon (pegIFN) and ribavirin therapy results in a suboptimal sustained virologic response (SVR) and intolerable adverse effects [5]. Administration of a 48-week pegIFN/ribavirin regimen can achieve a sustained virologic response (SVR) rate of 40%–70% in HCV-1 infected patients. In contrast, the SVR rate is approximately 90% for HCV-2 or HCV-3 infected patients treated with pegIFN/ribavirin therapy for 24 weeks [6]. New generation direct acting antiviral agents (DAAs) have fewer side effects and substantially improve the SVR rates up to 90% for HCV-1 [7–9]. However, the high cost of DAAs limits their clinical application. Thus, the pegIFN/ribavirin regimen remains a mainstay of HCV therapy in developing countries.
Many viral and host factors are responsible for the pathogenesis of HCV infection [10, 11]. HCV genotypes [12], viral loads [13], IL-28B polymorphisms [14], and a rapid virologic response (RVR) [15] have been proposed as important predictors for the treatment outcome of pegIFN/ribavirin. However, the reason why a substantial proportion of patients fail PegIFN/ribavirin therapy remains unclear. Although HCV primarily replicates in hepatocytes, there is evidence that peripheral blood mononuclear cells (PBMCs) can serve as a suitable site for HCV extrahepatic replication [16, 17]. PBMCs are also potent producers of interferon to defend against virus invasion [18]. Therefore, we hypothesized that responders and non-responders might have different PBMC gene expression patterns during pegIFN/ribavirin therapy.
Understanding the molecular basis of the pegIFN/ribavirin therapy response for HCV infection is essential for personalized medicine. We explored the dynamic gene expression profiles of PBMCs collected from HCV-1-infected patients undergoing pegIFN/ribavirin therapy. We aimed to establish a genetic model to predict the treatment response to pegIFN/ribavirin therapy. Furthermore, we examined the possible molecular mechanisms underlying interferon therapy.
RESULTS
Baseline characteristics
The demographic characteristics of the study subjects were shown in Table 1. A total of 27 HCV-1 patients (screening dataset n = 7; validation dataset n = 20) treated with 48 weeks of pegIFN/ribavirin were recruited in this study. Four (57.1%) patients in the screening study and 12 (60.0%) patients in the validation study achieved a sustained virologic response (SVR). The frequency of the favorable IL28B rs8099917 TT genotype in the overall cases was 83.3%. All patients carrying the unfavorable IL28B rs8099917 GT genotype (n = 4) failed to achieve SVR. There was no significant difference in the gender, age, GOT, GPT, viral load and IL28B rs8099917 genotype in the screening and validation datasets. The baseline demographic characteristics were comparable between the screening and validation datasets.
Table 1: Baseline demographics of HCV-1 patients
Screening |
Validation |
Screening vs. Validation p-value |
||||||
|---|---|---|---|---|---|---|---|---|
SVR |
non-SVR |
p-value |
SVR |
non-SVR |
p-value |
SVR |
non-SVR |
|
n |
4 |
3 |
12 |
8 |
- |
- |
||
Age (years, mean ± SD) |
49.0 ± 17.6 |
49.7 ± 8.6 |
0.955 |
42.4 ± 10.6 |
42.8 ± 12.8 |
0.950 |
0.516 |
0.416 |
Sex (M/F) |
4/0 |
2/1 |
0.429 |
8/4 |
7/1 |
0.603 |
0.376 |
0.491 |
GOT (IU/L, mean ± SD ) |
144.8 ± 178.2 |
127.0 ± 36.5 |
0.875 |
68.0 ± 36.8 |
62.1 ± 48.5 |
0.762 |
0.454 |
0.067 |
GPT (IU/L, mean ± SD ) |
74.5 ± 25.2 |
171.7 ± 92.8 |
0.207 |
120.4 ± 86.1 |
97.8 ± 67.2 |
0.539 |
0.320 |
0.172 |
HCV RNA (log IU/ml) |
5.33 ± 1.34 |
6.44 ± 0.75 |
0.259 |
5.03 ± 1.02 |
5.69 ± 0.90 |
0.154 |
0.218 |
0.147 |
IL28B rs8099917 TT |
4 (100.0%) |
2 (66.7%) |
0.429 |
10 (100.0%) |
4 (57.1%) |
0.051 |
- |
1.000 |
GT |
0 (0.0%) |
1 (33.3%) |
0 (0.0%) |
3 (42.9%) |
||||
p.s. SVR: sustained virologic response; non-SVR: non-sustained virologic response.
Microarray analysis
Forty-three differentially expressed genes were obtained from the microarray profiling of the PBMC samples (SVR n = 4; non-SVR n = 3) during pegIFN/ribavirin therapy (Supplementary Table S1). Among the 43 differentially expressed genes, 16 genes at week 1 and 23 genes at week 4 were significantly upregulated in the SVR group compared with the non-SVR group. In contrast, four genes at week 4 were significantly downregulated in the SVR group compared with the non-SVR group. A total of 43 genes were candidates for real-time PCR validation.
The gene ontology (GO) analysis showed the functional classification of these 43 differentially expressed genes. Catalytic (32.6%) and binding activity (30.2%) were the represented biological functions. Among the genes with catalytic activity, 7 genes (38.9%) had hydrolase activity, 6 genes (33.3%) had transferase activity, and 2 genes (11.1%) had ligase activity. Among the genes with binding activity, 7 genes (53.8%) had nucleic acid binding activity and 6 genes (46.2%) had protein binding activity (Supplementary Figure S1).
Real-time PCR validation
The PBMC gene expression signature at baseline was not significantly different between the responders and non-responders. Thirteen genes at week 1 (Supplementary Figure S2) and 24 genes at week 4 (Supplementary Figure S3) were significantly upregulated in the SVR group compared with the non-SVR group (Supplementary Table S2). Twenty-five genes at week 1 and 27 genes at week 4 were significantly upregulated in the cEVR group compared to the non-cEVR group (Supplementary Table S3). None of the significantly downregulated genes at baseline, week 1 and week 4 were confirmed by quantitative PCR.
Gene scores
We attempted to establish a genetic model to predict the treatment outcome of pegIFN/ribavirin for HCV-1 patients. We speculated that the genes correlated with the treatment response might be persistently expressed during pegIFN/ribavirin therapy. The target genes of the predictive model met the following criteria: (1) the differentially expressed genes between the SVR and non-SVR groups (fold change > 1.7 and p-value < 0.05) were present at both weeks 1 and 4. (2) The minimal number of target genes was favored under the premise of the precise prediction of the treatment outcome. We selected 8 target genes (RSAD2, LOC26010, HERC5, HERC6, IFI44, SERPING1, IFITM3, and DDX60) that were expressed at both weeks 1 and 4 as the major components of the predictive model. The cellular locations and functions of these target genes were listed in Table 2. The gene score was defined as the cumulative fold change of the candidate genes [i.e., gene score = sum of fold change (RSAD2 + LOC26010 + HERC5 + HERC6 + IFI44 + SERPING1 + IFITM3 + DDX60)]. The expression of the candidate genes was normalized to the GADPH endogenous control. The relative expression of the candidate genes was compared with the mean dCT of the non-SVR group.
Table 2: List of gene panel
Symbol |
Chr. |
Location |
Gene name |
Function |
|---|---|---|---|---|
LOC26010 |
2q33.1 |
Nucleus |
viral DNA polymerase-transactivated protein 6 |
Involved in ribosome biogenesis and translational control in response to oxidative stress. |
IFI44 |
1p31.1 |
Cytoplasm |
interferon-induced protein 44 |
This protein aggregates to form microtubular structures |
RSAD2 |
2p25.2 |
Cytoplasm |
radical S-adenosyl methionine domain containing 2 |
Involved in antiviral defense. May impair virus budding by disrupting lipid rafts at the plasma membrane. |
HERC5 |
4q22.1 |
Cytoplasm |
hect domain and RLD 5 |
Major E3 ligase for ISG15 conjugation. |
HERC6 |
4q22.1 |
Cytoplasm |
hect domain and RLD 6 |
E3 ubiquitin-protein ligase |
DDX60 |
4q32.3 |
Cytoplasm |
DEAD (Asp-Glu-Ala-Asp) box polypeptide 60 |
ATP and RNA binding |
IFITM3 |
11p15.5 |
Plasma Membrane |
interferon induced transmembrane protein 3 (1-8U) |
IFN-induced antiviral protein that mediates cellular innate immunity by inhibiting the early steps of replication. |
SERPING1 |
11q12-q13.1 |
Extracellular Space |
serpin peptidase inhibitor, clade G (C1 inhibitor), member 1, (angioedema, hereditary) |
Activation of the C1 complex is under control of the C1-inhibitor. |
The association between the gene score and the pegIFN/RBV treatment response
Overall study population
To evaluate the association between this scoring method and the pegIFN/ribavirin treatment response, we divided the subjects into high and low gene score groups. By performing a ROC analysis, we established a cut-off value of 8 for the gene score at week 1. Patients with a high gene score (≥ 8) had significantly greater SVR rates than those with a low gene score (< 8) (83.3% vs. 20.0%, OR = 4.8, 95% C.I = 1.56–14.74, p = 0.017). Similarly, the patients with low gene scores had significantly higher risk of failing to achieve cEVR compared with those with high gene scores (80.0% vs. 16.7%, OR = 4.8, 95% C.I = 1.56–14.74, p = 0.017) (Supplementary Table S5).
The important predictors for pegIFN/ribavirin therapy treatment outcomes include the RVR, viral load and IL28B genotype. RVR is well-known as the single best predictor for SVR [19]. We compared the predictive performance among this scoring method and the traditional predictors in the overall cases by calculating the area under the ROC curve (AUC). The AUC of week 1 gene score (AUC = 0.89, p = 0.0074) was substantially higher than that of RVR (AUC = 0.81, p = 0.032) for the prediction of SVR. The AUC value of week 1 gene score for the prediction of cEVR (AUC = 0.95, p = 0.003) was also substantially higher than that of RVR (AUC = 0.90, p = 0.0088). However, both of the differences did not reach statistical significance. (RVR vs. gene score: p = 0.2998 for SVR; p = 0.4384 for cEVR). (Figure 1 and Table 3).
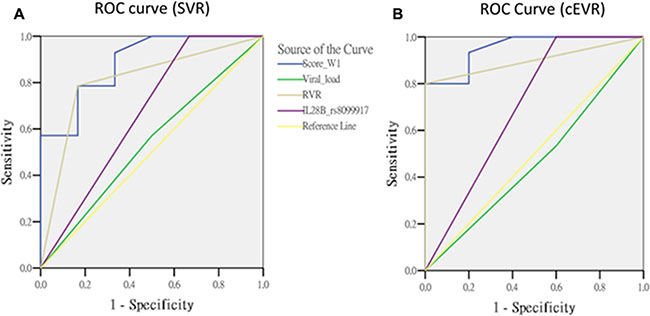
Figure 1: The comparisons of predictors in overall cases.
Table 3: The area under the ROC curve in overall cases
Variable |
SVR |
cEVR |
||||||
|---|---|---|---|---|---|---|---|---|
AUC |
95% C.I |
p-value |
Predictor vs. gene score p-value |
AUC |
95% C.I |
p-value |
Predictor vs. gene score p-value |
|
Gene score (W1) |
0.89 |
(0.73 ~ 1.04) |
0.0074 |
Reference |
0.95 |
(0.86 ~ 1.05) |
0.0030 |
Reference |
Viral load |
0.54 |
(0.25 ~ 0.82) |
0.8046 |
0.0525 |
0.47 |
(0.17 ~ 0.76) |
0.8273 |
0.0013 |
RVR |
0.81 |
(0.59 ~ 1.03) |
0.0320 |
0.2998 |
0.90 |
(0.76 ~ 1.04) |
0.0088 |
0.4384 |
IL28B rs8099917 |
0.67 |
(0.38 ~ 0.96) |
0.2482 |
0.1072 |
0.70 |
(0.39 ~ 1.01) |
0.1904 |
0.1032 |
p.s. AUC: area under the ROC curve.
Subpopulation with IL28B TT genotypes
Because the IL28B rs8099917 TT genotype was a favorable predictor for SVR, we stratified the study population in terms of the IL28B genotypes. We analyzed the association of the week 1 gene score and treatment response among the IL28B TT subpopulation. The SVR rate was significantly elevated in the high week 1 score group compared with the low week 1 score group in patients carrying the TT genotype (92.9% vs. 25.0%, OR = 10.5, 95% C.I = 1.46–75.4, p = 0.019). Furthermore, the patients with a high week 1 score had a significantly greater cEVR rate compared with those with a low week 1 score among the IL28B TT subpopulation (100% vs. 25%, p = 0.005) (Supplementary Table S6).
We evaluated the predictive performance between this scoring method and other predictors among the patients carrying the IL28B TT genotype. The AUC value of week 1 gene score (AUC = 0.89, p = 0.0195) to predict SVR was significantly higher than that of RVR (AUC = 0.77, p = 0.1112) (RVR vs. gene score: p = 0.0413). The week 1 gene score had an excellent predictive performance for cEVR (AUC = 1.00, p = 0.0077) that was superior to the RVR with borderline significance (AUC = 0.90, p = 0.0330) (RVR vs. gene score: p = 0.0614) (Figure 2 and Table 4).
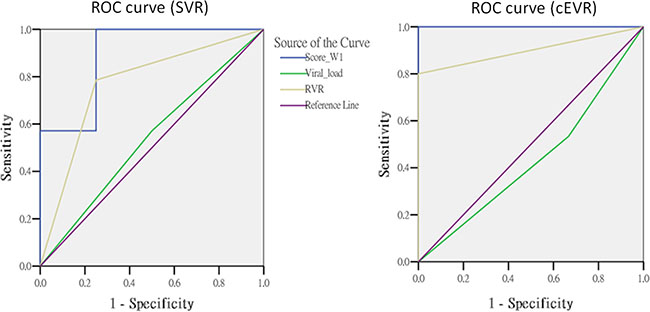
Figure 2: The comparisons of predictors in subjects with TT genotype.
Table 4: The area under the ROC curve in subjects with IL28B rs8099917 TT genotype
Variable |
SVR |
cEVR |
||||||
|---|---|---|---|---|---|---|---|---|
AUC |
95% C.I |
p-value |
Predictor vs. gene score p-value |
AUC |
95% C.I |
p-value |
Predictor vs. gene score p-value |
|
Gene score (W1) |
0.89 |
(0.69 ~ 1.09) |
0.0195 |
Reference |
1.00 |
(1.00~ 1.00) |
0.0077 |
Reference |
Viral load |
0.54 |
(0.21 ~ 0.87) |
0.8318 |
0.1294 |
0.43 |
(0.08 ~ 0.79) |
0.7223 |
0.0158 |
RVR |
0.77 |
(0.49 ~ 1.05) |
0.1112 |
0.0413 |
0.90 |
(0.75 ~ 1.05) |
0.0330 |
0.0614 |
p.s. AUC: area under the ROC curve.
Model fitness analysis
We analyzed the model fitness using the Akaike information criterion (AIC), Schwarz Bayesian information criterion (BIC) and likelihood ratio test. In the overall cases, the AIC and BIC values were comparable between the week 1 gene score and RVR. The model with a single parameter (gene score or RVR) effectively predicted the SVR. In patients carrying the IL28B TT genotype, all indicators of model fitness showed that the week 1 gene score was the best predictive model for SVR (Table 5).
Table 5: Regression models and measurement of model fitness by AIC and BIC for SVR
Predictors |
Overall cases |
IL28B TT genotype |
||||
|---|---|---|---|---|---|---|
AIC |
BIC |
Likelihood ratio test p-value |
AIC |
BIC |
Likelihood ratio test p-value |
|
Gene score (W1) |
8.597 |
10.868 |
0.008 |
7.653 |
9.434 |
0.007 |
RVR |
8.522 |
10.793 |
0.002 |
8.241 |
10.021 |
0.049 |
Viral load |
9.531 |
11.802 |
0.554 |
8.728 |
10.508 |
0.800 |
Viral load + W1 score |
15.942 |
19.348 |
0.018 |
12.722 |
15.393 |
0.025 |
Viral load + RVR |
15.251 |
18.657 |
0.007 |
15.443 |
18.115 |
0.130 |
p.s. (1) Overall cases: SVR n = 16, non-SVR n = 7; (2) Patients carrying IL28B rs8099917 TT genotype: SVR n = 14, non-SVR n = 4; (3) Model fitting information was assessed by Akaike information criterion (AIC) and the Schwarz Bayesian information criterion (BIC).
Network analysis
Figure 3 showed the molecular network of 43 differentially expressed genes analyzed by the ingenuity pathway analysis (IPA). We explored the gene expression signature in PBMCs during pegIFN/ribavirin therapy for HCV-1. Unsurprisingly, these genes were involved in the interferon-α, interferon-β, T-cell receptor (TCR) and NF-κB signaling pathways. Notably, histone H3, which is an important epigenetic protein, played a role in this network. Histone H3 can regulate gene expression by post-translational modifications via methylation or acetylation [20].
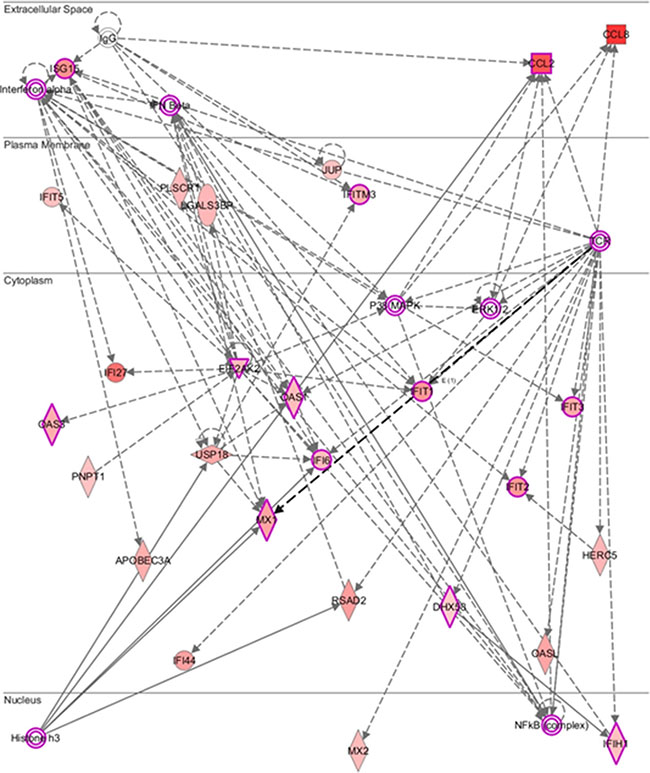
Figure 3: Molecular network predicted by core analysis in Ingenuity pathway analysis (IPA) p.s. The scheme showed the molecular network of 43 differentially expressed genes analyzed by the ingenuity pathway analysis (IPA). The color gradient in the network indicates the strength of expression denoted by fold change. (→) indicates direct interaction between the transcript products; (--->) indicates indirect interaction between the transcript products.
DISCUSSION
In this study, we analyzed the dynamic gene expression profiles of peripheral blood mononuclear cells from HCV-1 patients in response to pegIFN/ribavirin therapy. We established a molecular predictive model for the early stratification of the responders and non-responders to pegIFN/ribavirin therapy, especially among patients carrying the favorable IL28B rs8099917 TT genotype. RVR was known to be the single best predictor for SVR [19]. The performance of this genetic model was better than the traditional predictors, such as the RVR, viral load and IL28B genotype. This model advanced the predictive time for SVR by one week of pegIFN/ribavirin therapy compared with the RVR. It could help clinicians adopt appropriate strategies for HCV-1-infected patients at an earlier time point.
This scoring method reliably identified HCV-1 patients with an expected null response to pegIFN/ribavirin therapy using a cut-off value of less than 8. In the overall cases, the sensitivity, specificity, positive predictive value (PPV) and negative predictive value (NPV) for the prediction of both SVR and cEVR were 93.8%, 57.1%, 83.3% and 80.0%, respectively. In subpopulation of IL28B rs8099917 TT genotypes, the sensitivity, specificity, PPV and NPV for SVR prediction were 92.9%, 75.0%, 92.9%, and 75.0%, respectively. Among the patients carrying the IL28B TT genotype, the sensitivity, specificity, PPV and NPV for cEVR prediction were 93.3%, 100%, 100%, and 75.0%, respectively. Using the ROC curve analysis, the predictive performance of this scoring method was superior to the traditional predictors, such as the RVR, viral load and IL28B genotype.
In HCV-1 patients, a 48 week-peginterferon plus standard dose of ribavirin regimen has an SVR rate that ranges from 44%–79% [19, 21, 22]. Less than 1.6% of HCV-1 patients without cEVR have the opportunity to achieve a SVR [19, 23, 24]. Even extending the treatment duration from 48 weeks to 72 weeks, the SVR rate was only 38% for HCV-1 patients with partial EVR and 5% for those without cEVR [25]. The current treatment guidelines recommend the HCV-1 patients who fail to achieve an EVR at week 12 should stop pegIFN/ribavirin therapy [26]. This scoring method has reliable accuracy to predict SVR and cEVR, especially among patients carrying the IL28B rs8099917 TT genotype. Patients who are predicted to be non-cEVR based on the week 1 score should stop pegIFN/ribavirin therapy and wait for DAAs. Guided by this predictive model, clinicians could tailor individual treatment strategies as soon as possible. This method offers a cost-effective solution for the predicament of HCV-1 therapy and avoids the unnecessary adverse effects of the interferon-based regimen.
The pathway analysis showed that the most differentially expressed genes participated in the interferon-α, interferon-β, and NF-κB inflammatory signaling pathways. Previous studies showed that elevated interferon stimulated gene (ISG) expression in chronic HCV infected patients resulted in a poor response to peginterferon-based therapy [27, 28]. In this study, we identified constitutively expressed ISGs (e.g., RSAD2, IFI44, IFITM3…) that were overexpressed in the patients with a SVR. Understanding the gene expression signature in response to interferon could shed light on the molecular mechanism of HCV infection. Moreover, chronic HCV infection is characterized by the presence of phenotypically and functionally altered NK and T cells that fail to clear the virus [29, 30]. The pathway analysis showed some molecules (e.g., IFIT1, IFIT2, and IFIT3) that were indirectly involved in the T cell receptor (TCR)-mediated signaling pathway. Interestingly, Histone H3 was predicted to be the upstream regulator of RSAD2, MX1, and APOBEC3A. Histones can regulate DNA repair, replication and transcription [31] and are subject to a variety of posttranslational modifications, including acetylation, methylation, phosphorylation, and ubiquitylation [32]. Active genes typically carry high levels of lysine acetylation on their H3 tails [33], although the trimethylation of H3 lysine 9 (H3K9me3) and lysine 27 (H3K27me3) may repress gene expression [34]. The role of these differentially expressed genes in response to pegIFN/RBV therapy remains a mystery. However, the pathway analysis provided a clue for further functional studies.
There are several limitations in this pilot study. In this predictive model, we used the mean dCT of the non-SVR group as the reference dCT to calculate the fold change of individual gene expression. Due to the limited sample size, the mean dCT of the non-SVR group may not be sufficiently stable to serve as a standard reference. Therefore, a larger study population is needed to standardize the level of the reference dCT. Additionally, the appropriate cut-off value of the gene score to predict SVR most likely varies among different races. Another concern is that the specificity of this scoring method is not satisfactory to fit anyone. It is more suitable for patients with the favorable IL28B rs8099917 TT genotype. Because the frequency of the IL28B rs8099917 TT genotype was 83.3% in this study population, this predictive model could be applied for most HCV-1 patients. Moreover, some components of this predictive model were ISGs. The mediators that elicit the interferon signaling pathway may also interfere with the gene expression of ISGs. The interpretation of this predictive model should be approached with caution for patients co-infected with other viruses, inflammatory diseases and malignancies. This predictive model requires more studies to confirm the value of clinical application.
MATERIALS AND METHODS
Subjects
A total of 27 treatment naïve chronic hepatitis C patients were enrolled from Kaohsiung Medical University Hospital. The inclusion criteria were as follows: (a) adults aged more than 18 years with anti-HCV and detectable serum HCV RNA for more than 6 months; (b) infection with HCV genotype 1; and (c) serum ALT (alanine aminotransferase) increased by more than 1.5-fold over the normal range. The exclusion criteria were as follows: coinfection with hepatitis B, hepatitis D or human immunodeficiency virus and the presence of decompensated liver cirrhosis, primary biliary cirrhosis, autoimmune hepatitis, sclerosing cholangitis, α1-antitrypsin deficiency, Wilson disease, psychiatric conditions, current or past history of alcohol abuse (≥ 20 g daily), previous liver transplantation, or the presence of hepatocellular carcinoma or other malignancies. This study was approved by the Kaohsiung Medical University Hospital Institutional Review Board according to the guidelines of the Declaration of Helsinki and the principles of good clinical practice. Written informed consent was obtained from all participants.
Assessment of treatment efficacy
All participants were subcutaneously treated with peginterferon α-2a (180 μg/week) plus weight-based ribavirin (1000 mg/day for weights < 75 kg and 1200 mg/day for weights ≥ 75 kg) for 48 weeks. All of the patients achieved an 80/80/80 treatment adherence of 48-week peginterferon/ribavirin, defined as receiving > 80% of peginterferon, > 80% of ribavirin and > 80% of treatment duration. A sustained virologic response (SVR) was defined as undetectable HCV RNA throughout the 24 weeks after the completion of therapy. A complete early virologic response (cEVR) was defined as undetectable HCV RNA at week 12. A partial early virologic response (pEVR) was defined as a more than 2 log10 IU/ml decline in the HCV RNA from baseline at week 12. A rapid virologic response (RVR) was defined as seronegativity for HCV RNA after 4 weeks of therapy. The non-SVR cohort included patients with either relapse or nonresponse.
Cell preparation and RNA extraction
Peripheral blood was collected from the study participants at baseline and during the 1st and 4th weeks. Peripheral blood mononuclear cells (PBMCs) were isolated from white blood cells by the standard Ficoll-Hypaque Plus (Amersham Biosciences, Uppsala, Sweden) density gradient separation technique. RNA was purified from the PBMCs using the RiboPure™ Kit (Ambion, Applied Biosystems, Foster City, CA, USA) following the manufacturer’s instructions. The RNA integrity was assessed by agarose electrophoresis. RNA samples with an A260:280 ratio > 1.8 were selected for the microarray. The isolated RNA was used as the template for one round of reverse transcription to generate cDNA with the ThermoScript RT-PCR System.
Detection of HCV
Hepatitis C virus antibodies (anti-HCV) were detected using a third-generation commercially available enzyme-linked immunosorbent assay kit (Abbott Laboratories, Chicago, IL, USA). Serum HCV RNA was quantified using a real-time polymerase chain reaction assay [35] (RealTime HCV; Abbott Molecular, Des Plaines IL, USA; detection limit: 50 IU/ml). HCV genotypes were identified using the method proposed by Okamoto et al.[36].
SNP genotyping
The IL28B rs8099917 genotype was significantly linked with the treatment response to PegIFN/ribavirin therapy by a genome-wide association study and replication studies in Asian cohorts [37–39]. The rs80999917 genotypes were identified using the ABI TaqMan® SNP genotyping assays (Applied Biosystems, CA, USA) with the pre-designed primer and probe (ABI Assay ID: C_11710096_10) in accordance with the manufacturer›s recommendations.
Microarray data analysis
Complementary RNA was prepared from the total RNA and hybridized to the Affymetrix Human gene 1.0 ST arrays (28869 probe sets) following the manufacturer’s protocols (Affymetrix, Santa Clara, CA, USA). The hybridized arrays were scanned on an Affymetrix GeneChip® scanner 3000. The initial quantification of the array images was performed by utilizing the Affymetrix GeneChip® Operating Software (GCOS). Then, the data were analyzed by the R package (http://www.r-project.org) [40], which performed normalization, calculated gene expression levels, and determined the statistical significance. The threshold for significance in expression changes was set at a fold change ≥ 2 and false discovery rate (FDR) < 0.05 using the Benjamini-Hochberg procedure [41].
Quantitative polymerase chain reaction
Differentially expressed genes obtained from the microarray data were validated by quantitative PCR. mRNA samples were used for cDNA synthesis and processed using TaqMan Gene Expression Assays (Applied Biosystems). Primer and probe sets purchased from Life Technologies were pre-designed for the respective genes (Supplementary Table S1). The reaction was executed by applying the TaqMan® Gene Expression Master Mix (Applied Biosystems) on a 7500 Real-Time PCR System (Applied Biosystems). The standard thermal condition was 10 minutes at 95°C for polymerase activation, followed by 40 cycles of 95°C for 15 seconds and 60°C for 60 seconds. The expression of candidate genes was normalized to the endogenous GADPH. Relative gene expression was calculated using the ΔΔCt method.
Bioinformatics analysis
Gene ontology (GO) analysis was performed using Protein Analysis Through Evolutionary Relationship (PANTHER, http://www.pantherdb.org) [42]. Molecular pathways and interaction networks were analyzed by Ingenuity Pathway Analysis (IPA®, Ingenuity Systems Inc., Redwood City, CA, USA).
Statistical analysis
Student’s t test was performed to analyze continuous variables. The Chi-square (X2) test or Fisher’s exact test was used to assess categorical variables. The area under the curve (AUC) was calculated using receiver-operating characteristics (ROC) analysis and used to assess the capability of the predictive models. The optimum cut-off value to divide the risk strata was calculated by the Yauden index. The significance of AUC values between two predictive models was compared by the Hanley and McNeil method [43]. Model fitting analysis was evaluated by the Akaike information criterion (AIC) [44] and the Schwarz Bayesian information criterion (BIC) [45], both of which were based on the maximum likelihood estimation of the model parameters. Lower AIC and BIC values indicated a better model fit. The likelihood ratio test was used to compare the goodness-of-fit between the two models. A two-tailed p-value < 0.05 was considered statistically significant. All of the statistical analyses were performed using the Statistic Packages for Social Science Program (SPSS version 13.0 for windows, SPSS Inc., Chicago, IL, USA).
CONCLUSIONS
In conclusion, this gene scoring method can reliably identify HCV-1-infected responders and non-responders to pegIFN/ribavirin therapy within one week. The performance of this predictive model was superior to traditional predictors, such as the RVR, viral load and IL28B rs8099917 genotype. The model will help clinicians adopt an appropriate strategy for chronic HCV-1 patients at an early time point.
ACKNOWLEDGMENTS AND FUNDING
This study was supported by grants from the Kaohsiung Medical University (KMU-TP104E07, KMU-TP104E08, KMU-TP104E09, and KMU-TP104D12), Kaohsiung Medical University Hospital (KMUH102-2R03 and KMUH102-2R04) and the National Science Council, Taiwan (NSC 96-2314-B-037-044-MY3). The funders had no role in the study design, data collection and analysis, decision to publish, or preparation of the manuscript. We are grateful for the support from the “Center for Infectious Disease and Cancer Research” and “Lipid Science and Aging Research Center” of Kaohsiung Medical University.
CONFLICTS OF INTEREST
None of the authors have potential conflicts of interest related to the manuscript.
Author's contributions
M.Y.L analyzed the data and wrote the manuscript. T.J.H, E.H, and P.C.T confirmed the statistical analysis. Y.S.T and C.C.L performed the experiments. C.I.H, M.Y.H, M.H.H, P.C.L, Y.H.L, N.J.H, M.L.Y, C.F.H, Z.Y.L, S.C.C, J.F.H, and W.L.C collected the clinical data. M.L.Y and C.Y.D designed the study and supervised the manuscript. All authors have reviewed the manuscript.
REFERENCES
1. El-Serag HB. Epidemiology of viral hepatitis and hepatocellular carcinoma. Gastroenterology. 2012; 142:1264–1273 e1261.
2. Lauer GM, Walker BD. Hepatitis C virus infection. N Engl J Med. 2001; 345:41–52.
3. Simmonds P, Bukh J, Combet C, Deleage G, Enomoto N, Feinstone S, Halfon P, Inchauspe G, Kuiken C, Maertens G, Mizokami M, Murphy DG, Okamoto H, et al. Consensus proposals for a unified system of nomenclature of hepatitis C virus genotypes. Hepatology. 2005; 42:962–973.
4. Yu ML, Chuang WL, Chen SC, Dai CY, Hou C, Wang JH, Lu SN, Huang JF, Lin ZY, Hsieh MY, Tsai JF, Wang LY, Chang WY. Changing prevalence of hepatitis C virus genotypes: molecular epidemiology and clinical implications in the hepatitis C virus hyperendemic areas and a tertiary referral center in Taiwan. J Med Virol. 2001; 65:58–65.
5. National Institutes of Health Consensus Development Conference Statement: Management of hepatitis C: 2002-June 10–12, 2002. Hepatology. 2002; 36:S3–20.
6. Yu ML, Chuang WL. Treatment of chronic hepatitis C in Asia: when East meets West. J Gastroenterol Hepatol. 2009; 24:336–345.
7. Feld JJ, Kowdley KV, Coakley E, Sigal S, Nelson DR, Crawford D, Weiland O, Aguilar H, Xiong J, Pilot-Matias T, DaSilva-Tillmann B, Larsen L, Podsadecki T, et al. Treatment of HCV with ABT-450/r-ombitasvir and dasabuvir with ribavirin. N Engl J Med. 2014; 370:1594–1603.
8. Lawitz E, Sulkowski MS, Ghalib R, Rodriguez-Torres M, Younossi ZM, Corregidor A, DeJesus E, Pearlman B, Rabinovitz M, Gitlin N, Lim JK, Pockros PJ, Scott JD, et al. Simeprevir plus sofosbuvir, with or without ribavirin, to treat chronic infection with hepatitis C virus genotype 1 in non-responders to pegylated interferon and ribavirin and treatment-naive patients: the COSMOS randomised study. Lancet. 2014; 384:1756–1765.
9. Sulkowski MS, Gardiner DF, Rodriguez-Torres M, Reddy KR, Hassanein T, Jacobson I, Lawitz E, Lok AS, Hinestrosa F, Thuluvath PJ, Schwartz H, Nelson DR, Everson GT, et al. Daclatasvir plus sofosbuvir for previously treated or untreated chronic HCV infection. N Engl J Med. 2014; 370:211–221.
10. Horner SM, Gale M, Jr. Regulation of hepatic innate immunity by hepatitis C virus. Nat Med. 2013; 19:879–888.
11. Schneider WM, Chevillotte MD, Rice CM. Interferon-stimulated genes: a complex web of host defenses. Annu Rev Immunol. 2014; 32:513–545.
12. Fried MW, Shiffman ML, Reddy KR, Smith C, Marinos G, Goncales FL, Jr., Haussinger D, Diago M, Carosi G, Dhumeaux D, Craxi A, Lin A, et al. Peginterferon alfa-2a plus ribavirin for chronic hepatitis C virus infection. N Engl J Med. 2002; 347:975–982.
13. Moreno C, Deltenre P, Pawlotsky JM, Henrion J, Adler M, Mathurin P. Shortened treatment duration in treatment-naive genotype 1 HCV patients with rapid virological response: a meta-analysis. J Hepatol. 2010; 52:25–31.
14. Ge D, Fellay J, Thompson AJ, Simon JS, Shianna KV, Urban TJ, Heinzen EL, Qiu P, Bertelsen AH, Muir AJ, Sulkowski M, McHutchison JG, Goldstein DB. Genetic variation in IL28B predicts hepatitis C treatment-induced viral clearance. Nature. 2009; 461:399–401.
15. Ferenci P, Fried MW, Shiffman ML, Smith CI, Marinos G, Goncales FL, Jr., Haussinger D, Diago M, Carosi G, Dhumeaux D, Craxi A, Chaneac M, et al. Predicting sustained virological responses in chronic hepatitis C patients treated with peginterferon alfa-2a (40 KD)/ribavirin. J Hepatol. 2005; 43:425–433.
16. Fujiwara K, Allison RD, Wang RY, Bare P, Matsuura K, Schechterly C, Murthy K, Marincola FM, Alter HJ. Investigation of residual hepatitis C virus in presumed recovered subjects. Hepatology. 2013; 57:483–491.
17. Di Lello FA, Culasso AC, Parodi C, Bare P, Campos RH, Garcia G. New evidence of replication of hepatitis C virus in short-term peripheral blood mononuclear cell cultures. Virus Res. 2014; 191:1–9.
18. Yoshio S, Kanto T, Kuroda S, Matsubara T, Higashitani K, Kakita N, Ishida H, Hiramatsu N, Nagano H, Sugiyama M, Murata K, Fukuhara T, Matsuura Y, et al. Human blood dendritic cell antigen 3 (BDCA3)(+) dendritic cells are a potent producer of interferon-lambda in response to hepatitis C virus. Hepatology. 2013; 57:1705–1715.
19. Yu ML, Dai CY, Huang JF, Chiu CF, Yang YH, Hou NJ, Lee LP, Hsieh MY, Lin ZY, Chen SC, Hsieh MY, Wang LY, Chang WY, et al. Rapid virological response and treatment duration for chronic hepatitis C genotype 1 patients: a randomized trial. Hepatology. 2008; 47:1884–1893.
20. Lachner M, O’Carroll D, Rea S, Mechtler K, Jenuwein T. Methylation of histone H3 lysine 9 creates a binding site for HP1 proteins. Nature. 2001; 410:116–120.
21. Yu JW, Wang GQ, Sun LJ, Li XG, Li SC. Predictive value of rapid virological response and early virological response on sustained virological response in HCV patients treated with pegylated interferon alpha-2a and ribavirin. J Gastroenterol Hepatol. 2007; 22:832–836.
22. Kuboki M, Iino S, Okuno T, Omata M, Kiyosawa K, Kumada H, Hayashi N, Sakai T. Peginterferon alpha-2a (40 KD) plus ribavirin for the treatment of chronic hepatitis C in Japanese patients. J Gastroenterol Hepatol. 2007; 22:645–652.
23. Davis GL. Monitoring of viral levels during therapy of hepatitis C. Hepatology. 2002; 36:S145–151.
24. Yu ML, Dai CY, Lin ZY, Lee LP, Hou NJ, Hsieh MY, Chen SC, Hsieh MY, Wang LY, Chang WY, Chuang WL. A randomized trial of 24- vs. 48-week courses of PEG interferon alpha-2b plus ribavirin for genotype-1b-infected chronic hepatitis C patients: a pilot study in Taiwan. Liver Int. 2006; 26:73–81.
25. Pearlman BL, Ehleben C, Saifee S. Treatment extension to 72 weeks of peginterferon and ribavirin in hepatitis c genotype 1-infected slow responders. Hepatology. 2007; 46:1688–1694.
26. Asian Pacific Association for the Study of the Liver Hepatitis CWP, McCaughan GW, Omata M, Amarapurkar D, Bowden S, Chow WC, Chutaputti A, Dore G, Gane E, Guan R, Hamid SS, Hardikar W, Hui CK, et al. Asian Pacific Association for the Study of the Liver consensus statements on the diagnosis, management and treatment of hepatitis C virus infection. J Gastroenterol Hepatol. 2007; 22:615–633.
27. Heim MH, Thimme R. Innate and adaptive immune responses in HCV infections. J Hepatol. 2014; 61:S14–25.
28. Heim MH. 25 years of interferon-based treatment of chronic hepatitis C: an epoch coming to an end. Nat Rev Immunol. 2013; 13:535–542.
29. Nattermann J, Feldmann G, Ahlenstiel G, Langhans B, Sauerbruch T, Spengler U. Surface expression and cytolytic function of natural killer cell receptors is altered in chronic hepatitis C. Gut. 2006; 55:869–877.
30. Grakoui A, Shoukry NH, Woollard DJ, Han JH, Hanson HL, Ghrayeb J, Murthy KK, Rice CM, Walker CM. HCV persistence and immune evasion in the absence of memory T cell help. Science. 2003; 302:659–662.
31. Lawrence M, Daujat S, Schneider R. Lateral Thinking: How Histone Modifications Regulate Gene Expression. Trends Genet. 2016; 32:42–56.
32. Zhang T, Cooper S, Brockdorff N. The interplay of histone modifications - writers that read. EMBO Rep. 2015; 16:1467–1481.
33. Schneider R, Bannister AJ, Myers FA, Thorne AW, Crane-Robinson C, Kouzarides T. Histone H3 lysine 4 methylation patterns in higher eukaryotic genes. Nat Cell Biol. 2004; 6:73–77.
34. Karimi MM, Goyal P, Maksakova IA, Bilenky M, Leung D, Tang JX, Shinkai Y, Mager DL, Jones S, Hirst M, Lorincz MC. DNA methylation and SETDB1/H3K9me3 regulate predominantly distinct sets of genes, retroelements, and chimeric transcripts in mESCs. Cell Stem Cell. 2011; 8:676–687.
35. Vermehren J, Yu ML, Monto A, Yao JD, Anderson C, Bertuzis R, Schneider G, Sarrazin C. Multi-center evaluation of the Abbott RealTime HCV assay for monitoring patients undergoing antiviral therapy for chronic hepatitis C. J Clin Virol. 2011; 52:133–137.
36. Okamoto H, Tokita H, Sakamoto M, Horikita M, Kojima M, Iizuka H, Mishiro S. Characterization of the genomic sequence of type V (or 3a) hepatitis C virus isolates and PCR primers for specific detection. J Gen Virol. 1993; 74:2385–2390.
37. Yu ML, Huang CF, Huang JF, Chang NC, Yang JF, Lin ZY, Chen SC, Hsieh MY, Wang LY, Chang WY, Li YN, Wu MS, Dai CY, et al. Role of interleukin-28B polymorphisms in the treatment of hepatitis C virus genotype 2 infection in Asian patients. Hepatology. 2011; 53:7–13.
38. Huang CF, Huang JF, Yang JF, Hsieh MY, Lin ZY, Chen SC, Wang LY, Juo SH, Chen KC, Chuang WL, Kuo HT, Dai CY, Yu ML. Interleukin-28B genetic variants in identification of hepatitis C virus genotype 1 patients responding to 24 weeks peginterferon/ribavirin. J Hepatol. 2012; 56:34–40.
39. Tanaka Y, Nishida N, Sugiyama M, Kurosaki M, Matsuura K, Sakamoto N, Nakagawa M, Korenaga M, Hino K, Hige S, Ito Y, Mita E, Tanaka E, et al. Genome-wide association of IL28B with response to pegylated interferon-alpha and ribavirin therapy for chronic hepatitis C. Nat Genet. 2009; 41:1105–1109.
40. Irizarry RA, Hobbs B, Collin F, Beazer-Barclay YD, Antonellis KJ, Scherf U, Speed TP. Exploration, normalization, and summaries of high density oligonucleotide array probe level data. Biostatistics. 2003; 4:249–264.
41. Benjamini Y, Hochberg Y. Controlling the false discovery rate: a practical and powerful approach to multiple testing. Journal of the Royal Statistical Society, Series B. 1995; 57:289–300.
42. Mi H, Muruganujan A, Thomas PD. PANTHER in 2013: modeling the evolution of gene function, and other gene attributes, in the context of phylogenetic trees. Nucleic Acids Res. 2013; 41:D377–386.
43. Hanley JA, McNeil BJ. A method of comparing the areas under receiver operating characteristic curves derived from the same cases. Radiology. 1983; 148:839–843.
44. Akaike H. A new look at the statistical model identification. IEEE Transactions on Automatic Control. 1974; 19:716–723.
45. Schwarz GE. Estimating the dimension of a model. Annals of Statistics. 1978; 6:461–464.