
INTRODUCTION
Head and neck squamous cell carcinoma (HNSCC) arising in the oral cavity, oropharynx, larynx and hypopharynx is the sixth most prevalent malignancy worldwide [1–9]. Several miRNAs, including miR-21, miR-31, miR-134 and miR-196, have been found to be oncogenic for HNSCC development [1, 4, 7–9]. It is also well known that miR-31 in other common malignancies, such as lung adenocarcinoma and colorectal carcinoma, is oncogenic [10]. The upregulation of miR-31 expression in HNSCC is the consequence of EGFR oncogenic activation [5]. Furthermore, miR-31 could inhibit FIH in turn activating the hypoxia pathway and upregulating VEGF expression [4]. In addition, miR-31 could also cause an impairment of DNA repair, which leads to an elevated susceptibility of squamous epithelial cells to chemical carcinogenesis [11]. Interestingly, upregulation of miR-31 is also associated with premalignant disorders that precede the cancerous lesions both in human and murine oral squamous cell carcinoma tissues [2, 12]. The clinical analysis further confirmed that serological miR-31 could be biomarkers to differentiate HNSCC from the non-cancerous state [13], while a high level of miR-31 predicted the progression of oral premalignant disorders [14] suggesting that miR-31 is not only crucial for HNSCC pathogenesis but it also serves as a great diagnostic cue for HNSCC.
The SWI/SNF (switch/sucrose non-fermentable) chromatin-remodeling complex has been shown to activate various cellular processes, including differentiation, proliferation, gene transcription, DNA repair and others [15, 16]. The ARID (AT-Rich Interaction Domain), a major component of the SWI/SNF complex, is a helix-turn-helix motif DNA-binding domain belonging to a family containing 15 highly conserved proteins [17]. ARID1A has been shown to drive adenosine triphosphate (ATP)-dependent helicase activity allowing transcriptional activators and repressors to access onto DNA [16]. Recent studies have demonstrated that ARID1A functions as a tumor suppressor by disrupting aberrant p53 and/or PTEN pathways [18–21]. Loss of ARID1A expression is frequently detected in lung, colorectal, breast, gastric and ovarian clear-cell carcinomas [19, 22–26]. ARID1A mutations are found in up to 50% of gynecological tumors, as well as in a broad spectrum of other malignancies [27]. However, the fundamental functions of ARID1A and its downstream effectors during HNSCC have not been fully explored.
Nanog, OCT4, Sox2, KLF4, CD133 and other proteins, which are involved in both protein-protein interaction and transcriptional regulations are factors regulating somatic cell reprogramming [28–30]. Interestingly, SWI/SNF complex has previously been shown to be important to facilitate somatic cell reprogramming [31]. Members of the ARID3 family were found to upregulate the stemness gene expression in human cancers as well as to control pluripotency of hematopoietic stem cells [32–34]. However, the detailed molecular mechanisms involved in regulating the connection between miRNAs, ARID1A and stemness remained to be determined [35, 36]. The present study identifies ARID1A to be a tumor suppressor and a tumor stemness repressor in HNSCC cells. ARID1A trans-inactivates Nanog/OCT4/Sox2 stemness factors as well as Epithelial Cell Adhesion Molecule (EpCAM) [37]. It was also found that the expression profile of the miR-31/ARID1A/stemness factors is able to correlate prognosis of patients with HNSCCs. These findings provide new clues as to how miR-31/ ARID1A enhances oncogenicity and stemness in HNSCC cells.
RESULTS
Decreased ARID1A expression in HNSCC tissues
Our recent report has demonstrated that numbers of oncogenic miRNAs could be induced in 4-Nitroquinoline 1-Oxide (4NQO) treated mice [12]. By taking advantage of this model, it was found that nuclear ARID1A expression was progressively decreased in the tongue epithelium of mice with long-term 4NQO treatment (Figure 1A, Supplementary Figure S1). Furthermore, a significant downregulation of nuclear ARID1A expression was also detected in the neoplastic tongue and esophagus tissues in a previously established K14-EGFP-miR-31 transgenic mouse compared to control mouse tissues [11] (Figure 1B, 1C). We then investigated ARID1A protein expression in HNSCC tissue pairs. ARID1A protein expression was found to be lower in tumor tissue samples compared to paired non-cancerous matched tissues (NCMTs) (Figure 1D). Next we retrieved the expression profiles of 23 oncogenic miRNAs from The Cancer Genome Atlas (TCGA) database for HNSCC and correlated these with ARID1A expression [38]. The results indicated that miR-31 and miR-135b level was negatively correlated with ARID1A expression (Figure 1E, Supplementary Figure S2). Analysis of 58 tissue pairs demonstrated an obvious decrease in ARID1A mRNA in tumors relative to their normal counterparts as ROC curves indicated a predictive power of 0.71 for the separation of non-diseased samples from HNSCC samples (Figure 1F). The quantitative RT-PCR analysis also confirmed a significant upregulation of miR-31 in HNSCC with a ROC value as high as 0.82 when distinguishing benign tissue from malignant tissue (Figure 1G). An inverse correlation between the expression of ARID1A and miR-31 was noted in our study cohort (Figure 1H) revealing a potential relationship between miR-31 level and ARID1A expression in HNSCC tissues.
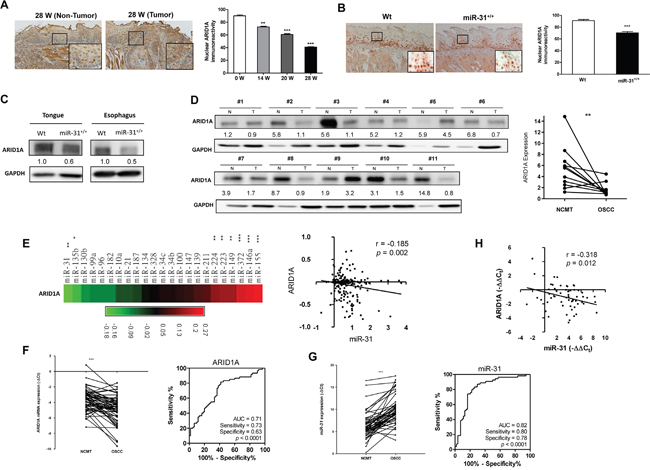
Figure 1: Decreased ARID1A expression in HNSCC. A. Lt, Representative ARID1A immunohistochemical analysis of the non-tumor (Lt) epithelium and tumor samples (Rt) from the tongues in mice following 4NQO induction for 28 weeks. (x100); Indents, higher power views of blocks (x400). Rt, The quantification shows a progressive downregulation of nuclear ARID1A immunoreactivity in the tongue epithelium during 4NQO-induced mouse tongue carcinogenesis. B. Lt, Representative ARID1A immunohistochemistry of the tongue epithelium of Wt (Lt) and miR-31+/+ transgenic mice. (x100); Indents, higher power view of the blocks. (x400). Rt, Quantification of nuclear ARID1A immunoreactivity. Downregulation of nuclear ARID1A expression in the tongue epithelium of miR-31+/+ transgenic mice can be seen. C. Western blot analysis of the tongue and esophageal epithelium stripped from mice. This shows the downregulation of ARID1A in both the tongue and esophageal epithelium of miR-31+/+ transgenic mice relative to Wt mice. D. Lt, Western blot analysis of ARID1A protein expression in 11 human HNSCC tissue pairs. N, NCMT; T, HNSCC. Rt, Quantitation. Numbers below the Western blot pictures are the normalized values. E. Linear regression analysis to correlate ARID1A expression and the expression of oncogenic miRNAs using HNSCC TCGA database. Lt, Algorithm of r values. Rt, An inverse correlation is noted between miR-31 and ARID1A. F. Lt, qRT-PCR analysis of ARID1A mRNA expression in 58 HNSCC/NCMT tissue pairs. Rt, ROC analysis. AUC: area under curve. G. Lt, qRT-PCR analysis of miR-31 expression in tissue pairs. Rt, ROC analysis. H. Linear regression analysis shows an inverse correlation between miR-31 expression and ARID1A mRNA expression in the tissue pairs.
miR-31/ARID1A axis drives HNSCC tumorigenesis
Ten different in silico modules unequivocally predicts that the 3’ untranslated region (3’UTR) of the ARID1A transcript contains a binding site for miR-31 (Supplementary Figure S3). But the direct targeting of miR-135b to ARID1A transcript seems unlikely. We then determined whether miR-31 directly controls ARID1A via post-transcriptional regulation. Upon the treatment of a miR-31 mimic, ARID1A expression was downregulated in most HNSCC cells. qRT-PCR further confirmed that an increased miR-31 expression was associated with a decreased ARID1A mRNA expression in OECM1 cells, but not in SAS cells (Figure 2A). In order to determine whether ARID1A transcript is a direct target of miR-31, we constructed wild-type (Wt) and mutant (Mut) reporter plasmids (Figure 2B) for a reporter assay. The results indicate that miR-31 is able to repress the luciferase activity of the Wt reporter, but not in Mut form, in OECM1 and 293T cells under miR-31 mimic transfection (Figure 2B). This cell-type variance could possibly be explained by a T→C polymorphism at rs12685 within the ARID1A 3’UTR in SAS cells, but not in other cells (Supplementary Figure S4A). To further clarify if this polymorphism reduces the affinity between miR-31 and the potential binding sequence, we generate the single nucleotide polymorphism (SNP) reporter from the Wt reporter in which the T was replaced by C at rs12685. The reporter assay indicated that the miR-31 suppressed Wt reporter activity was abrogated in SNP reporter in both OECM1 and 293T cells (Supplementary Figure S4B). It is worth noting that 32 clinical HNSCC samples were all wild type at rs12685 indicating that the polymorphism found in SAS cells is rather infrequent in human HNSCC tissues. In summary, these findings confirmed that miR-31 directly inhibits ARID1A through its 3’UTR region, and that rs12685 is able to interfere with miR-31 targeting.
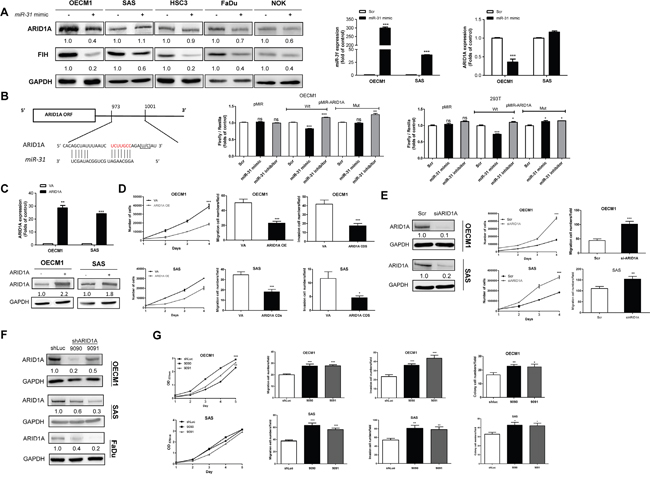
Figure 2: miR-31 inhibits ARID1A in HNSCC. A. Lt, Ectopic miR-31 expression downregulates ARID1A expression in the OECM1, HSC3, FaDu and NOK cell lines, but not in the SAS cell line. Middle and Rt, qRT-PCR analysis targeting miR-31 and ARID1A mRNA expression, respectively, in OECM1 and SAS cell. B. Lt, Similarity between miR-31 and the 3’UTR sequence of the ARID1A. Rt, Reporter assays. Lt, Assays of Wt and Mut reporters after treatment with miR-31 mimic or miR-31 inhibitor in OECM1 and 293T cells. C. Ectopic ARID1A expression in OECM1 and SAS cells. Upper, mRNA expression; Lower, protein expression. D. Phenotypic analysis of the OECM1 (Upper) and SAS (Lower) cells. Lt, proliferation; Middle, migration; Rt, invasion. E. Knockdown of ARID1A protein expression in OECM1 and SAS cells using the siARID1A oligonucleotide. Lt, protein expression; Middle, proliferation; Rt, migration. F. Establishment of OECM1, SAS and FaDu cell subclones with ARID1A knockdown. G. Phenotypic analysis of the OECM1 (Upper) and SAS (Lower) cell subclones. Lt to Rt, proliferation, migration, invasion and AIG. Numbers below the Western blot pictures are the normalized values.
ARID1A suppresses the oncogenicity of HNSCC cells
A number of cellular assays were performed to define the regulatory role of ARID1A for malignancy in HNSCC cells. Overexpression of ARID1A resulted in a decreased proliferation, migration and invasion in OECM1 and SAS cells (Figure 2C, 2D). In contrast, downregulation of ARID1A expression led to an increase in proliferation, migration and colony formation ability in different HNSCC cells compared to control cells in vitro (Figure 2E-2G). However, endogenous expression of miR-31 (Supplementary Figure S5A, Lt) and ARID1A (Supplementary Figure S5A, Rt) were not correlated with migration ability (Supplementary Figure S5B) in HNSCC cell lines tested (Supplementary Figure S5C). In vivo models were thus used to validate the oncogenic enrichment associated with ARID1A downregulation using SAS cell subclones. An enhanced tumor growth associated with ARID1A downregulation was noted in subcutaneous xenograft model (Figure 3A). In orthotopic tongue xenograft model, downregulation of ARID1A expression was found associated with a higher induction of primary tumorigenesis (Figure 3B, 3C), a higher percentage of nodal metastasis (Figure 3B, 3D), and a trend of worse survival of hosted mice (Figure 3E).
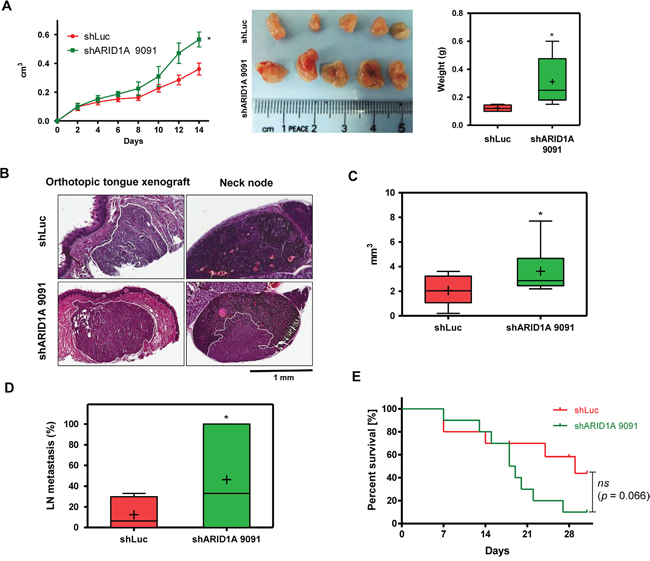
Figure 3: Knockdown of ARID1A expression increases xenografic tumorigenesis and neck metastasis. A. Subcutaneous xenografic tumorigenesis of SAS cell subclones (n = 5). Lt, Growth curve; Middle, tumors harvested; Rt, weight of tumors. B-E. Orthotopic xenografic tumorigenesis of SAS cell subclones (n = 10). (B) H&E-stained tissue sections. Lt, tongue tissues, Rt neck nodes. The primary tumors in tongue and metastatic lesion in neck node are marked with white solid lines. (C) Volume of primary tumors. (D) Percentage of neck metastasis in tumors < 6 mm3 in size. (E) Survival curve of mice. Bar charts, Box and Whiskers plot. Line, medium value; +, mean value.
miR-31 upregulate stemness markers through ARID1A inhibition
To explore potential stemness associated effectors controlled by the miR-31/ARID1A pathway, sphere cell population of OECM1 cell was analyzed to show conspicuous increase of miR-31 expression (Figure 4A). In addition, the correlation of 22 stemness genes with miR-31 expression was analyzed using the TCGA database to show that thirteen genes were positively correlated with miR-31 expression (Supplementary Figure S6) and six genes were negatively correlated with ARID1A (Supplementary Figure S7). Among them, five genes were overlapped. Using a Genomatrix analytical module, an appropriate AT-rich site was found in the promoter regions of genes Nanog, OCT4, Sox2 and EpCAM (Supplementary Figure S8), suggesting that these genes could possibly be miR-31-ARID1A downstream genes (Figure 4B). To further validate the role of miR-31 in modulating the stemness properties of HNSCC cells, the Nanog/OCT4/Sox2 protein expression was determined in OECM1 and FaDu cells treated with miR-31 mimic or miR-31 inhibitor. The results showed that miR-31 downregulated ARID1A expression and upregulated Nanog/OCT4/Sox2 mRNA and protein expression in both cells (Figure 4C, 4D). On the contrary, miR-31 inhibition upregulated ARID1A expression and downregulated Nanog/OCT4/Sox2 mRNA and protein expression (Figure 4E, 4F). These finding suggested a potential interplay between miR-31 and ARID1A to induce HNSCC stemness related genes expression.
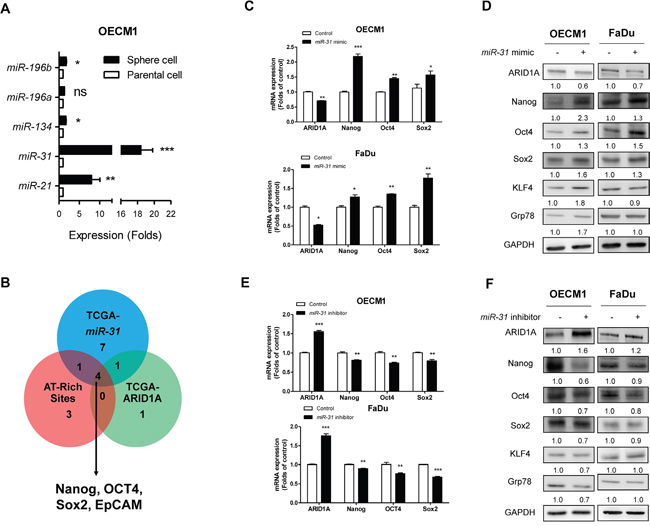
Figure 4: miR-31 downregulates ARID1A and upregulates pluripotency genes. A. qRT-PCR analysis of miR-21, miR-31, miR-134, miR-196a and miR-196b in OECM1 parental cells and OECM1 sphere cells. A significant increase in miR-31 expression which is much greater than other miRNAs, is found in the sphere cells. B. Bioinformatics analysis indicates that expression levels of Nanog, OCT4, Sox2 and EpCAM genes are positively correlated with the level of miR-31 expression, but are negatively correlated with the level of ARID1A expression; this is identified using the HNSCC-TCGA database. These genes contain predicted AT-rich sites in their promoters. C, D. Treatment of OECM1 and FaDu cells with miR-31 mimic. This downregulates ARID1A protein expression and upregulates Nanog/OCT4/Sox2 protein expression (in C). The treatment also downregulates ARID1A mRNA expression and upregulates Nanog/OCT4/Sox2 mRNA expression (in D) in both OECM1 and FaDu cells. E, F. Treatment with miR-31 inhibitor. This upregulates ARID1A and downregulates Nanog/OCT4/Sox2 in protein expression (in E) and mRNA expression (in F) in both OECM1 and FaDu cells. It should be noted that the protein expression levels of KLF4 and Grp78 are upregulated by miR-31 mimic and downregulated by miR-31 inhibitor in OECM1 cells. Numbers below Western blot pictures are the normalized values.
ARID1A represses pluripotency genes and suppresses stemness properties
HNSCC cells with exogenous ARID1A expression were shown to have lower level of Nanog/OCT4/Sox2 mRNA and protein expression (Figure 5A, Upper, Figure 5B, Lt). In contrast, Nanog/OCT4/Sox2 expression was found to be increased in the ARID1A deficient cells (Figure 5A, Lower; Figure 5B, Rt). Aldehyde dehydrogenase (ALDH1+) expression was reported to be a putative stemness maker in various cancers [39]. A decrease in ALDH1+ activity was shown in HNSCC cells with ARID1A overexpression compared to control ones; ARID1A deficiency, in contrast, led to a higher percentage of ALDH1+ HNSCC cells (Figure 5C, Supplementary Figure S9). The spheroid-forming capability in HNSCC cells with ARID1A knockdowned cells was also examined. The results showed that ARID1A expression could possibly inhibit sphere formation in HNSCC cells (Figure 5D). Interestingly, a drastic increase of Nanog/OCT4/Sox2/EpCAM expression was noted in SAS sphere cells (Figure 5E). Collectively, these results suggest that ARID1A inhibits oncogenesis and stemness properties in HNSCC cells by downregulating stemness factors.
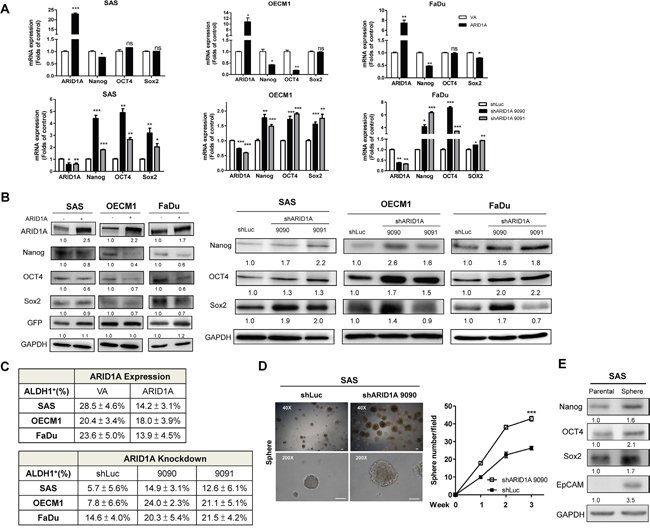
Figure 5: ARID1A downregulates pluripotency genes and stemness. A. qRT-PCR analysis and B. Western blot analysis of ARID1A, Nanog, OCT4 and Sox2 expression in the SAS, OECM1 and FaDu cell subclones with ARID1A overexpression (A, Upper; B, Lt) and knockdown (A, Lower; B, Rt). C. Summary of ALDH1+ cell population of ARID1A overexpression or knockdown in HNSCC cells. D. Spheroid formation assay by SAS cells. Lt, Images at the 3rd week; Rt, Quantification of spheres greater than 100 μm in size at week 1-3. Bars, 100 μm. The shARID1A 9090 SAS cell subclone shows a higher capability for sphere formation relative to the control. E. Western blot analysis. This shows that there is upregulation of Nanog/OCT4/Sox2/EpCAM in spheres derived from SAS cells compared to parental SAS cell. Numbers below the Western blot pictures are the normalized values.
ARID1A repressed EpCAM expression
To ascertain whether miR-31-ARID1A-EpCAM also involved in oncogenicity and stemness, we expressed or knocked down ARID1A in OECM1 and FaDu cells. An inverse correlation between the expression of ARID1A and the expression of EpCAM at both the protein level (Figure 6A, 6C) and mRNA level (Figure 6B, 6D) was noted. In addition, miR-31 inhibition was able to upregulate ARID1A, but downregulated EpCAM in both types of cells (Figure 6E). Knockdown of EpCAM using siRNA decreased the oncogenic phenotypes (Figure 6F; Figure 6G, Upper) of OECM1 cells. EpCAM knockdown in FaDu cells significantly decreased the growth and migration of these cells, but only slightly decreased invasion by these cells (Figure 6F; Figure 6G, Lower). EpCAM knockdown in FaDu cells also decreased the ALDH1+ (Figure 6H, Lt) and CD44+ (Figure 6H, Rt) cell populations.
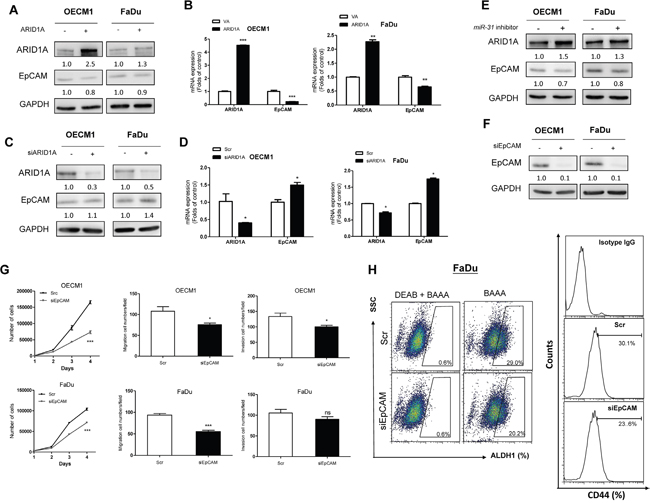
Figure 6: ARID1A-EpCAM is involved in oncogenicity and stemness of HNSCC cells. A-G. OECM1 and FaDu cells. (A, B) Ectopic ARID1A expression, (C, D) Knockdown of ARID1A expression. (A, C) Western blot analysis. (B, D) qRT-PCR analysis. An inverse relationship between the expression level of ARID1A and EpCAM should be noted. (E) Ectopic miR-31 expression. This results in ARID1A upregulation and EpCAM downregulation. (F) Treatment with siEpCAM oligonucleotide. This downregulates EpCAM protein expression. (G) Upper, OECM1 cell; Lower, FaDu cell. Analysis of proliferation (Lt), migration (Middle) and invasion (Rt). H. FaDu cell. Knockdown of EpCAM decreases the ALDH1+ (Lt) and CD44+ (Rt) cell populations. The numbers below the Western blot pictures are the normalized values.
ARID1A trans-inactivates Nanog/OCT4/Sox2/EpCAM and rescues miR-31 functions
Figure 7A and Supplementary Figure S10 illustrate the predicted AT-sites in the proximal promoter regions of Nanog/OCT4/Sox2/EpCAM. To clarify whether ARID1A directly downregulated expression of these genes, promoter-driven luciferase reporter constructs, either containing a wild type full-length promoter sequence (designated WT), or containing a deleted promoter sequence with truncation at the AT-rich site (designated Del) were created. In the OECM1 shLuc cell subclone, the WT promoters and Del promoter had higher activities compared to the VA control. In addition, the activity of Del was higher than that of WT in Nanog and OCT4 promoters. The activity levels of the WT promoters in shARID1A 9090 cell subclone were much higher than those of the shLuc cell subclone. However, the activity of Del promoter between shARID1A 9090 cell subclone and shLuc cell subclone was not different (Figure 7B). A chromatin immunoprecipitation (ChIP) assay was performed to detect the binding of ARID1A to the AT-rich sites of the Nanog/OCT4/Sox2/EpCAM promoters using the OECM1 cell subclones. Amplification of the immunoprecipitates created by the anti-ARID1A antibody showed that the presence of the Nanog/OCT4/Sox2/EpCAM fragments that contained the AT-rich sites using the shLuc cell subclone. The intensity of the PCR products was found to be reduced in the OECM1 shARID1A cell subclone (Figure 7C, Lt). Quantitation showed drastic enhancement of ARID1A binding at the AT-rich site of the Nanog/OCT4/Sox2/EpCAM promoter regions compared to the IgG control (Figure 7C, Rt). This binding was attenuated by knockdown of ARID1A. These findings demonstrate that ARID1A represses Nanog/OCT4/Sox2/EpCAM expression directly by binding to their AT-rich sites, which are found within the proximal promoter region.
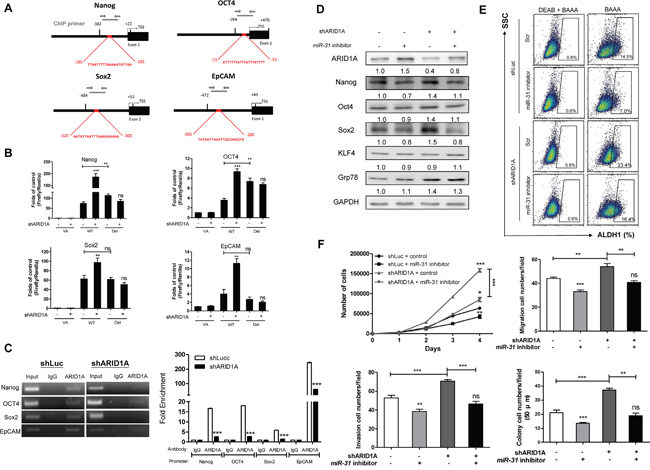
Figure 7: miR-31 inhibits ARID1A to transactivate pluripotency genes and oncogenicity. A. Schematic diagrams designate AT-rich sites (Red boxes) in the proximal regions of the Nanog, OCT4, Sox2 and EpCAM promoters. TSS, transcription start site; Thin black bars, the termini of AT-rich sites. Thick black bars define the segments for reporter assay in B. Grey lines define the segments for ChIP assay in C. (B) Promoter activity. Knockdown of ARID1A increases the activity of the WT promoter reporters of each gene, while it does not alter the activity of the Del promoter reporters. Deletion of the AT-rich sites increases the promoter reporter activity of Nanog and OCT4, but it does not alter the promoter reporter activity of Sox2 and EpCAM. (C) Lt, ChIP assays of ARID1A in Nanog/OCT4/Sox2/EpCAM promoter regions. Knockdown of ARID1A reduces the PCR products amplified from the DNA fragments that had been immunoprecipitated by anti-ARID1A antibody. Rt, ChIP qPCR analysis. Input, 2% of total lysate. D-F. Rescue of oncogenicity and stemness in the OECM1 shARID1A 9091 cell subclone and control. (D) Upregulation of Nanog, OCT4 and Sox2, induced by ARID1A knockdown, is reversed by miR-31 inhibition. This does not occur with KLF4 or Grp78. (E) An increase in the ALDH1+ cell population induced by ARID1A knockdown is also reversed by miR-31 inhibition. (F) The proliferation (Upper Lt), migration (Upper Rt), invasion (Lower Lt) and AIG (Lower Rt) are induced by ARID1A knockdown and this is rescued by miR-31 inhibition. Numbers below the Western blot pictures are the normalized values.
The repression of Nanog/OCT4/Sox2 expression results from miR-31 inhibition was rescued by the knockdown of ARID1A in OECM1 cells (Figure 7D). The reduction in the ALDH1+ cell population meditated by miR-31 inhibition was ameliorated by the knockdown of ARID1A (Figure 7E). The suppression of oncogenicity as a result of miR-31 inhibition was also rescued by the knockdown of ARID1A expression (Figure 7F). The miR-31-ARID1A axis controls HNSCC stemness and oncogenicity.
Inverse expression relationship between miR-31 and ARID1A in human HNSCC tissue samples
In situ hybridization (ISH) and immunohistochemistry (IHC) analyses were performed on an HNSCC tissue microarray (TMA) containing 60 tumors and some NCMT tissue cores. miR-31 staining (blue pixels) along with ARID1A immunoreactivity (nuclear percentage) and Nanog/OCT4/Sox2/EpCAM immunoreactivities (brown pixels) were scored (Figure 8A). An increase in miR-31 expression and a decrease in nuclear ARID1A expression from NCMT to HNSCC was noted (Figure 8B). Higher Nanog/Sox2/EpCAM expression in tumors was also noted. A significant inverse correlation between miR-31 expression and ARID1A expression was found using the HNSCC tumor samples (Figure 8C). Moreover, Nanog and Sox2 expression was positively correlated with miR-31 expression, and Nanog, OCT4 and EpCAM expression was inversely correlated with ARID1A expression (Figure 8D). The staining was classified from low to high using the median values of percentages or the pixel scores as the cutoff. Kaplan-Meier analysis indicated an association between a lower level of ARID1A expression and a poorer disease-free survival by the patient (Figure 8E, Upper Lt). Tumors that had a high level of miR-31 expression and a low level of ARID1A expression exhibited a much worse patient prognosis than tumors carrying the other possible expression profiles (Figure 8E, Upper Rt). Tumors with a higher expression level of individual pluripotency gene, with a higher co-expression level of all pluripotency genes (Supplementary Figure S11) or with a higher expression level of miR-31 (Figure 8E, Upper Lt) did not display a lower survival. However, tumors carrying a higher level of expression of pluripotency genes together with a higher level of expression of miR-31 were found to have a poorer prognosis than the other patterns (Figure 8E, Lower Lt). Finally, tumors carrying a high level of expression of miR-31, a higher level of expression of pluripotency genes and lower level of ARID1A expression were found to have a very poor survival (Figure 8E, Lower Rt). In summary, this study specifies the miR-31- ARID1A-stemness genes regulatory axis in HNSCC pathogenesis (Figure 8F).
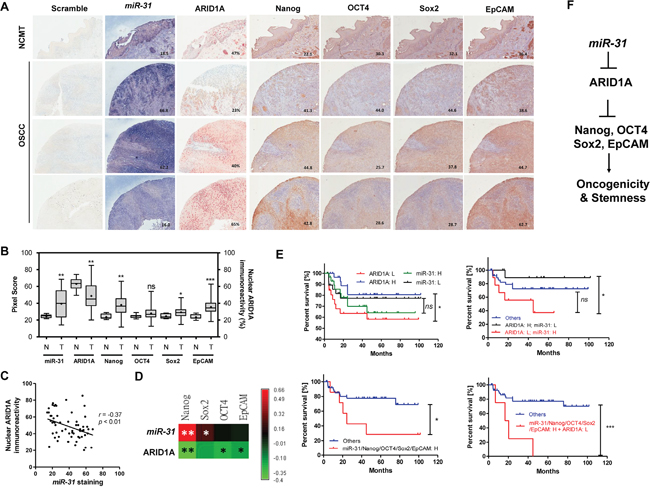
Figure 8: ISH and IHC analysis using HNSCC TMA tissue samples. A. NCMT (Upper most) and 3 representative HNSCC TMA tissue cores. (x100). B. Quantification of miR-31, nuclear ARID1A, Nanog, OCT4, Sox2 and EpCAM immunoreactivities in NCMT and HNSCC tissue cores. C. An inverse correlation can be seen between miR-31 staining and nuclear ARID1A immunoreactivity. D. The algorithm of r values demonstrates a positive correlation between miR-31 staining and the expression of stemness factors together with an inverse correlation between ARID1A expression and the expression of stemness factors. E. Kaplan-Meier survival analysis used to assess the disease free survival of HNSCC patients. H, high expression; L, low expression. F. Illustration of miR-31-ARID1A-Nanog/OCT4/Sox2/EpCAM axis.
DISCUSSION
miR-31 is significantly upregulated during HNSCC and this miRNA induces hypoxia and epithelial-mesenchymal transition, and disrupts gene repair by inhibiting FIH, Ku80, Parp1 and various other targets during tumorigenesis [2, 4, 11]. Moreover, miR-31 is upregulated by EGF and this occurs early in HNSCC tumorigenesis [2, 5, 12, 14]. This study has further indicated that miR-31 inhibits ARID1A in HNSCC [36]. Previous studies have reported that miR-200c, miR-34, Let7 and Lin28 are involved in cancer stemness [32, 33, 40, 41]. This study provides a new line of evidence showing that miR-31 upregulates various pluripotency genes and increases the stem cell population in HNSCC [42]. Since ARID1A also represses stemness, the suppressor activity of ARID1A relative to other miR-31 targets is being investigated.
We have identified in the present study that a low nuclear expression of ARID1A predicts a worse HNSCC patient survival. Mice carrying xenografic tumors with low ARID1A expression have more extensive metastasis and worse survival. Despite the fact that ARID1A is known to affect p53-p21 and AKT in order to suppress oncogenicity [18-20, 43], this study further shows that ARID1A trans-inactivates the Nanog/OCT4/Sox2 stemness genes; these are known, together with EpCAM tumor antigen, to be involved in the repression of both oncogenesis and stemness in HNSCC. As the ARID3 family complex also promotes the stemness properties of HNSCC [32, 33], the regulation of the various subunits that form the SWI/SNF complex and drive tumor stemness needs to be further investigated.
Since an inverse association in expression between miR-31 expression and ARID1A expression was found to occur both in our study cohort and via the TCGA database, high expression of miR-31 could be a crucial mechanism with respect to ARID1A downregulation in HNSCC. It is thus likely that miR-31 overexpression, in addition to deletion, mutation or epigenetic disruption of this gene, may underlie ARID1A downregulation in both lung and colorectal carcinomas [24, 26]. Our preliminary findings also suggest that a T→C polymorphism at rs12685, which is adjacent to the miR-31 binding site within the 3’UTR of ARID1A, is able to confound the binding of miR-31 onto ARID1A. However, due to the low frequency of occurrence of this polymorphism in the human population, the importance of this to the interaction of miR-31-ARID1A during cancer is likely to be limited.
This study indicates that ARID1A transcriptionally represses Nanog/OCT4/Sox2 concomitantly by binding to the AT-rich sites present in their promoters. ARID1A knockdown increases wild-type promoter activity, while in parallel experiments ARIDIA is unable to alter the activity of promoters lacking the appropriate AT-rich sites. However, since the truncation of the AT-rich sites in Sox2 and EpCAM does not increase the endogenous activity of the reporter genes, it seems that such truncation may still show a potential for repression via a new alignment of sequences created by the deletion. Although studies have shown the prognostic implications of Nanog/OCT4/Sox2 to HNSCC [30, 44, 45], this study only identified a trend towards worse survival among HNSCC patients when they had high expression of these stemness factors.
The EpCAM membranous molecule is a tumor marker widely used to capture circulatory tumor cells [46]. It is also a potential marker for tumor stemness in hepatocellular carcinoma [47]. This study provides clues indicating the modulation of EpCAM and the effect this has on oncogenicity and stemness may be important during HNSCC. Since miR-31-ARID1A upregulates the expression of Nanog/OCT4/Sox2/EpCAM, together with the fact that the activation of this axis creates a worst HNSCC prognosis, a strategy that reduces the effects of this axis may be a useful therapeutic approach when trying to address HNSCC.
MATERIALS AND METHODS
Tissue samples
The surgical specimens consisted of primary tumors along with paired NCMTs and were collected for qRT-PCR analysis and Western blot analysis (Supplementary Table S1). In addition, HNSCC TMAs consisting of HNSCC tumor cores and some paired HNSCC/NCMT cores (Supplementary Table S2) were also investigated [5]. This study was approved by the Institutional Review Board (approval number 13MMHIS274). Archival murine tongue, esophagus, and tumor tissues were obtained during our previous studies [11, 12].
Quantitative (q)RT-PCR
Total RNAs were reversely transcribed into cDNA. The levels of expression of various genes were analyzed using the TaqMan Assay system according to the manufacturer’s instructions (Applied Biosystems, Foster City, CA); RNU6B or GAPDH were used as internal controls. The threshold cycle (Ct) method was used to quantitate the changes of expression [5].
Western blot analysis
The Western blot analysis and the quantification of protein expression followed protocols that have been previously described [5]. The primary antibodies are listed in Supplementary Table S3. The anti-rabbit, anti-mouse and anti-goat secondary antibodies were obtained from Chemicon Int. (Billerica, MA).
Cell culture
SAS, OECM1, FaDu and HSC3 HNSCC cells, 293T cell as well as a hTERT immortalized normal oral keratinocyte (NOK) cells, were cultivated according to previous protocols [4, 5]. miR-31 mimic and inhibitor along with appropriate controls were purchased from Applied Biosystems. The siARID1A (L-017263-00-0005) and siEpCAM (L-004568-01-0005) oligonucleotides, together with scramble controls, were purchased from Dharmacon (Lafayette, CO). The optimized dose for both siARID1A and siEpCAM was identified as 60 nM for 48 h, and this was used during all experiments. Other chemicals were purchased from Sigma-Aldrich (St. Louise, MO).
Plasmids
The pcDNA6-ARID1A vector was purchased from Addgene (Cambridge, MA). A vector carrying green fluorescence gene (GFP) was used to measure transfection efficiency [48]. The short hairpin shARID1A constructs (Supplementary Table S4) packed in lentiviruses were purchased from the RNA Interference Consortium (Academia Sinica, Taipei, Taiwan). After selection, cell subclones exhibiting knockdown of ARID1A were identified and designated as shARID1A 9090 and 9091. These were then used in the experiments together with shLuc subclone as a control.
Phenotypic analysis
The phenotypes of the various cell lines, including proliferation, migration, invasion, anchorage-independent growth (AIG), ALDEFLUOR assay, sorted CD44+ cell population and spheroid formation assay followed protocols previously published [4, 30, 44]. SAS cells were injected subcutaneously into the flank (106 cells) orthotopically into the central part of the tongue (1.5 × 10⁵ cells) of BALB/c athymic mice [4, 8]. After sacrifice of animal, the subcutaneous xenografts, the resected tongues and the dissected neck tissues were subjected to image analysis, processing and histopathological evaluation. The animal studies were performed according to the guidelines from the Institutional Animal Care and Use Committee (IACUC) of National Yang-Ming University and had approval No. 1021257.
Reporter constructs and activity assay
The full-length of the 3’UTR sequence of the ARID1A gene was cloned into the pMIR-REPORTER plasmid (Applied Biosystems) in order to generate the pMIR-ARID1A-Wt construct. A mutant reporter construct (pMIR-ARID1A-Mut) was obtained from the Wt construct by replacing the original CUUGCC sequence at the target site with GAGCUC in order to create a new Sac I restriction enzyme digestion site; this was done using a PCR-based strategy (Supplementary Table S5). A SNP reporter was generated from Wt reporter by carrying out a change at nucleotide 999 from T→C.
The genomic regions flanking the promoter region of human Nanog (-382 ~ +22 to ATG), OCT4 (-264 ~ +470 to ATG), Sox2 (-484 ~ +52 to ATG) and EpCAM (-472 ~ +49 to ATG) were amplified by PCR (Supplementary Table S5) and inserted into the KpnI/HindIII sites of pGL3 vector (Promega, Madison, WI); this generated a series of wild type promoter reporter constructs, which were designated a WT promoters. Next, promoter constructs containing truncations of the various AT-rich sites, designated Del, were generated from the WT promoters by site-directed mutagenesis (Supplementary Table S5). The plasmid pRL-TL, which expresses the renilla luciferase gene, was co-transfected with the plasmids used in the experiments as a control for the transfection efficiency.
Prediction of AT-Rich binding sites
Genomatix (https://www.genomatix.de/), an open-access prediction system [49], was used to predict AT-Rich binding sites in the promoter regions of various genes.
ChIP assay
ChIP experiments were carried out using methods that we have established previously [50]. Sonicated chromatin was immunoprecipitated using anti-ARID1A antibody (Supplementary Table S3). The PCR reaction generated 168-bp, 239-bp, 154-bp and 234-bp amplicons of the proximal regions of the promoters of Nanog, OCT4, Sox2 and EpCAM containing AT-rich sites, respectively (Supplementary Table S5). The amplicons were separated on an agarose gel and then visualized. SYBR® Green quantitative (q)PCR analysis was also performed.
ISH analysis
The hsa-miR-31, the scrambled oligonucleotide control and various other reagents were purchased from Exiqon (Copenhagen, Denmark). Tissue sections from the HNSCC TMA were fixed and subjected to ISH analysis using the protocols that we have described previously [5]. The staining was captured by Image-Pro software (Media Cybernetic, Rockville, MD) and quantified using Photoshop software (Adobe; San Jose, CA) [5].
IHC analysis
Tissue sections from the HNSCC TMA were processed for IHC using the protocols we have described previously [5]. The antibodies used are described in Supplementary Table S3. The immunoreactivity levels were captured and analyzed using the same methods as those used for ISH. Nuclear ARID1A immunoreactivity was scored based on the percentage of ARID1A positive nuclei as a proportion of the total cells counted.
Statistical analysis
The data are shown as Means ± S.E. Mann-Whitney tests, t-tests, two-way ANOVAs, linear regression and Kaplan-Meier survival analysis were used to compare the differences between variants. The diagnostic power was analyzed by Receiver Operating Characteristic (ROC) curve. ns, not significant; *, p < 0.05; **, p<0.01; ***, p<0.001.
ACKNOWLEDGMENTS
This study was supported by grants MOST102-2628-B-010-011-MY3 and MOST103-2314-B-010-020-MY3 from Ministry of Science and Technology and Welfare Surcharge on tobacco products grant number MOHW105-TDU-B-211-134-003 from Ministry of Health and Welfare for Excellence for Cancer Research.
CONFLICTS OF INTEREST
The authors declare no conflicts of interest.
REFERENCES
1. Bourguignon LY, Earle C, Wong G, Spevak CC, Krueger K. Stem cell marker (Nanog) and Stat-3 signaling promote MicroRNA-21 expression and chemoresistance in hyaluronan/CD44-activated head and neck squamous cell carcinoma cells. Oncogene. 2012; 31:149-160.
2. Hung PS, Tu HF, Kao SY, Yang CC, Liu CJ, Huang TY, Chang KW, Lin SC. miR-31 is upregulated in oral premalignant epithelium and contributes to the immortalization of normal oral keratinocytes. Carcinogenesis. 2014; 35:1162-1171.
3. Jones A. The molecular cell biology of head and neck cancer with clinical applications. Section 1: Fundamental biology and the basis of cancer. Clin Otolaryngol Allied Sci. 2004; 29:475-491.
4. Liu CJ, Tsai MM, Hung PS, Kao SY, Liu TY, Wu KJ, Chiou SH, Lin SC, Chang KW. miR-31 ablates expression of the HIF regulatory factor FIH to activate the HIF pathway in head and neck carcinoma. Cancer Res. 2010; 70:1635-1644.
5. Lu WC, Kao SY, Yang CC, Tu HF, Wu CH, Chang KW, Lin SC. EGF up-regulates miR-31 through the C/EBPbeta signal cascade in oral carcinoma. PLoS One. 2014; 9:e108049.
6. Tu HF, Lin SC, Chang KW. MicroRNA aberrances in head and neck cancer: pathogenetic and clinical significance. Curr Opin Otolaryngol Head Neck Surg. 2013; 21:104-111.
7. Liu CJ, Tsai MM, Tu HF, Lui MT, Cheng HW, Lin SC. miR-196a overexpression and miR-196a2 gene polymorphism are prognostic predictors of oral carcinomas. Ann Surg Oncol. 2013; 20:S406-414.
8. Liu CJ, Shen WG, Peng SY, Cheng HW, Kao SY, Lin SC, Chang KW. miR-134 induces oncogenicity and metastasis in head and neck carcinoma through targeting WWOX gene. Int J Cancer. 2014; 134:811-821.
9. Mydlarz W, Uemura M, Ahn S, Hennessey P, Chang S, Demokan S, Sun W, Shao C, Bishop J, Krosting J, Mambo E, Westra W, Ha P, Sidransky D, Califano J. Clusterin is a gene-specific target of microRNA-21 in head and neck squamous cell carcinoma. Clin Cancer Res. 2014; 20:868-877.
10. Edmonds MD, Boyd KL, Moyo T, Mitra R, Duszynski R, Arrate MP, Chen X, Zhao Z, Blackwell TS, Andl T, Eischen CM. MicroRNA-31 initiates lung tumorigenesis and promotes mutant KRAS-driven lung cancer. J Clin Invest. 2016; 126:349-364.
11. Tseng SH, Yang CC, Yu EH, Chang C, Lee YS, Liu CJ, Chang KW, Lin SC. K14-EGFP-miR-31 transgenic mice have high susceptibility to chemical-induced squamous cell tumorigenesis that is associating with Ku80 repression. Int J Cancer. 2015; 136:1263-1275.
12. Kao YY, Tu HF, Kao SY, Chang KW, Lin SC. The increase of oncogenic miRNA expression in tongue carcinogenesis of a mouse model. Oral Oncol. 2015; 51:1103-1112.
13. Liu CJ, Kao SY, Tu HF, Tsai MM, Chang KW, Lin SC. Increase of microRNA miR-31 level in plasma could be a potential marker of oral cancer. Oral Dis. 2010; 16:360-364.
14. Hung KF, Liu CJ, Chiu PC, Lin JS, Chang KW, Shih WY, Kao SY, Tu HF. MicroRNA-31 upregulation predicts increased risk of progression of oral potentially malignant disorder. Oral Oncol. 2016; 53:42-47.
15. Weissman B, Knudsen KE. Hijacking the chromatin remodeling machinery: impact of SWI/SNF perturbations in cancer. Cancer Res. 2009; 69:8223-8230.
16. Wilson BG, Roberts CW. SWI/SNF nucleosome remodellers and cancer. Nat Rev Cancer. 2011; 11:481-492.
17. Li XS, Trojer P, Matsumura T, Treisman JE, Tanese N. Mammalian SWI/SNF—a subunit BAF250/ARID1 is an E3 ubiquitin ligase that targets histone H2B. Mol Cell Biol. 2010; 30:1673-1688.
18. Guan B, Wang TL, Shih Ie M. ARID1A, a factor that promotes formation of SWI/SNF-mediated chromatin remodeling, is a tumor suppressor in gynecologic cancers. Cancer Res. 2011; 71:6718-6727.
19. Mamo A, Cavallone L, Tuzmen S, Chabot C, Ferrario C, Hassan S, Edgren H, Kallioniemi O, Aleynikova O, Przybytkowski E, Malcolm K, Mousses S, Tonin PN, Basik M. An integrated genomic approach identifies ARID1A as a candidate tumor-suppressor gene in breast cancer. Oncogene. 2012; 31:2090-2100.
20. Streppel MM, Lata S, DelaBastide M, Montgomery EA, Wang JS, Canto MI, Macgregor-Das AM, Pai S, Morsink FH, Offerhaus GJ, Antoniou E, Maitra A, McCombie WR. Next-generation sequencing of endoscopic biopsies identifies ARID1A as a tumor-suppressor gene in Barrett’s esophagus. Oncogene. 2014; 33:347-357.
21. Guan B, Rahmanto YS, Wu RC, Wang Y, Wang Z, Wang TL, Shih Ie M. Roles of deletion of Arid1a, a tumor suppressor, in mouse ovarian tumorigenesis. J Natl Cancer Inst. 2014; 106.
22. Abe H, Maeda D, Hino R, Otake Y, Isogai M, Ushiku AS, Matsusaka K, Kunita A, Ushiku T, Uozaki H, Tateishi Y, Hishima T, Iwasaki Y, Ishikawa S, Fukayama M. ARID1A expression loss in gastric cancer: pathway-dependent roles with and without Epstein-Barr virus infection and microsatellite instability. Virchows Arch. 2012; 461:367-377.
23. Ayhan A, Mao TL, Seckin T, Wu CH, Guan B, Ogawa H, Futagami M, Mizukami H, Yokoyama Y, Kurman RJ, Shih Ie M. Loss of ARID1A expression is an early molecular event in tumor progression from ovarian endometriotic cyst to clear cell and endometrioid carcinoma. Int J Gynecol Cancer. 2012; 22:1310-1315.
24. Ye J, Zhou Y, Weiser MR, Gonen M, Zhang L, Samdani T, Bacares R, DeLair D, Ivelja S, Vakiani E, Klimstra DS, Soslow RA, Shia J. Immunohistochemical detection of ARID1A in colorectal carcinoma: loss of staining is associated with sporadic microsatellite unstable tumors with medullary histology and high TNM stage. Hum Pathol. 2014; 45:2430-2436.
25. Zhang X, Zhang Y, Yang Y, Niu M, Sun S, Ji H, Ma Y, Yao G, Jiang Y, Shan M, Zhang G, Pang D. Frequent low expression of chromatin remodeling gene ARID1A in breast cancer and its clinical significance. Cancer Epidemiol. 2012; 36:288-293.
26. Zhang Y, Xu X, Zhang M, Bai X, Li H, Kan L, Niu H, He P. ARID1A is downregulated in non-small cell lung cancer and regulates cell proliferation and apoptosis. Tumour Biol. 2014; 35:5701-5707.
27. Wu JN, Roberts CW. ARID1A mutations in cancer: another epigenetic tumor suppressor? Cancer Discov. 2013; 3:35-43.
28. Ding J, Xu H, Faiola F, Ma’ayan A, Wang J. Oct4 links multiple epigenetic pathways to the pluripotency network. Cell Res. 2012; 22:155-167.
29. Takahashi K, Yamanaka S. Induction of pluripotent stem cells from mouse embryonic and adult fibroblast cultures by defined factors. Cell. 2006; 126:663-676.
30. Chiou SH, Yu CC, Huang CY, Lin SC, Liu CJ, Tsai TH, Chou SH, Chien CS, Ku HH, Lo JF. Positive correlations of Oct-4 and Nanog in oral cancer stem-like cells and high-grade oral squamous cell carcinoma. Clin Cancer Res. 2008; 14:4085-4095.
31. Singhal N, Graumann J, Wu G, Arauzo-Bravo MJ, Han DW, Greber B, Gentile L, Mann M, Scholer HR. Chromatin-Remodeling Components of the BAF Complex Facilitate Reprogramming. Cell. 2010; 141:943-955.
32. Chien CS, Wang ML, Chu PY, Chang YL, Liu WH, Yu CC, Lan YT, Huang PI, Lee YY, Chen YW, Lo WL, Chiou SH. Lin28B/Let-7 regulates expression of Oct4 and Sox2 and reprograms oral squamous cell carcinoma cells to a stem-like state. Cancer Res. 2015; 75:2553-2565.
33. Liao TT, Hsu WH, Ho CH, Hwang WL, Lan HY, Lo T, Chang CC, Tai SK, Yang MH. let-7 modulates chromatin configuration and target gene repression through regulation of the ARID3B complex. Cell Rep. 2016; 14:520-533.
34. Webb CF, Bryant J, Popowski M, Allred L, Kim D, Harriss J, Schmidt C, Miner CA, Rose K, Cheng HL, Griffin C, Tucker PW. The ARID family transcription factor bright is required for both hematopoietic stem cell and B lineage development. Mol Cell Biol. 2011; 31:1041-1053.
35. Liu C, Tang DG. MicroRNA regulation of cancer stem cells. Cancer Res. 2011; 71:5950-5954.
36. Wang N, Zhou Y, Zheng L, Li H. MiR-31 is an independent prognostic factor and functions as an oncomir in cervical cancer via targeting ARID1A. Gynecol Oncol. 2014; 134:129-137.
37. Sen S, Carnelio S. Expression of Epithelial Cell Adhesion Molecule (EpCAM) in oral squamous cell carcinoma. Histopathology. 2015; In press.
38. Comprehensive genomic characterization of head and neck squamous cell carcinomas. Nature. 2015; 517:576-582.
39. Chen YC, Chen YW, Hsu HS, Tseng LM, Huang PI, Lu KH, Chen DT, Tai LK, Yung MC, Chang SC, Ku HH, Chiou SH, Lo WL. Aldehyde dehydrogenase 1 is a putative marker for cancer stem cells in head and neck squamous cancer. Biochem Biophys Res Commun. 2009; 385:307-313.
40. Ji Q, Hao X, Zhang M, Tang W, Yang M, Li L, Xiang D, Desano JT, Bommer GT, Fan D, Fearon ER, Lawrence TS, Xu L. MicroRNA miR-34 inhibits human pancreatic cancer tumor-initiating cells. PLoS One. 2009; 4:e6816.
41. Shimono Y, Zabala M, Cho RW, Lobo N, Dalerba P, Qian D, Diehn M, Liu H, Panula SP, Chiao E, Dirbas FM, Somlo G, Pera RA, Lao K, Clarke MF. Downregulation of miRNA-200c links breast cancer stem cells with normal stem cells. Cell. 2009; 138:592-603.
42. Xie Q, Wang Z, Bi X, Zhou H, Wang Y, Gu P, Fan X. Effects of miR-31 on the osteogenesis of human mesenchymal stem cells. Biochem Biophys Res Commun. 2014; 446:98-104.
43. Wu RC, Wang TL, Shih Ie M. The emerging roles of ARID1A in tumor suppression. Cancer Biol Ther. 2014; 15:655-664.
44. Chou MY, Hu FW, Yu CH, Yu CC. Sox2 expression involvement in the oncogenicity and radiochemoresistance of oral cancer stem cells. Oral Oncol. 2015; 51:31-39.
45. Fu TY, Hsieh IC, Cheng JT, Tsai MH, Hou YY, Lee JH, Liou HH, Huang SF, Chen HC, Yen LM, Tseng HH, Ger LP. Association of OCT4, SOX2, and NANOG expression with oral squamous cell carcinoma progression. J Oral Pathol Med. 2016; 45:89-95.
46. Bozec A, Ilie M, Dassonville O, Long E, Poissonnet G, Santini J, Chamorey E, Ettaiche M, Chauviere D, Peyrade F, Hebert C, Benezery K, Sudaka A, Haudebourg J, Selva E, Hofman P. Significance of circulating tumor cell detection using the CellSearch system in patients with locally advanced head and neck squamous cell carcinoma. Eur Arch Otorhinolaryngol. 2013; 270:2745-2749.
47. Yamashita T, Ji J, Budhu A, Forgues M, Yang W, Wang HY, Jia H, Ye Q, Qin LX, Wauthier E, Reid LM, Minato H, Honda M, Kaneko S, Tang ZY, Wang XW. EpCAM-positive hepatocellular carcinoma cells are tumor-initiating cells with stem/progenitor cell features. Gastroenterology. 2009; 136:1012-1024.
48. Hung PS, Liu CJ, Chou CS, Kao SY, Yang CC, Chang KW, Chiu TH, Lin SC. miR-146a enhances the oncogenicity of oral carcinoma by concomitant targeting of the IRAK1, TRAF6 and NUMB genes. PLoS One. 2013; 8:e79926.
49. Weigelt K, Moehle C, Stempfl T, Weber B, Langmann T. An integrated workflow for analysis of ChIP-chip data. Biotechniques. 2008; 45:131-132, 134, 136 passim.
50. Chang KW, Hung PS, Lin IY, Hou CP, Chen LK, Tsai YM, Lin SC. Curcumin upregulates insulin-like growth factor binding protein-5 (IGFBP-5) and C/EBPalpha during oral cancer suppression. Int J Cancer. 2010; 127:9-20.