
INTRODUCTION
Nitrate and nitrite from food and water are precursors of endogenously formed N-nitroso compounds (NOCs). Results from animal studies and mechanisms describing DNA damage suggest that these compounds are carcinogenic in humans [1, 2]. Ingested nitrate is reduced to nitrite by the bacterial flora in the mouth and digestive tract. In turn, nitrite reacts with amines, amides and other nitrosation precursors in the gastrointestinal tract to form NOCs. Endogenous nitrosation is estimated to account for 45-75% of total NOCs exposure [3]. Acceptable daily intake values have been set for baby foods because high exposure of nitrate would cause methemoglobinemia in infants [4]. However, the regulatory limits for nitrate/nitrite in food have not been extensively studied in relation to other health outcomes. Dietary intake of nitrate and nitrite may be an important cancer risk factor but the research continues to be monitored.
Literature of dietary nitrate/nitrite and cancer risk has been growing but results have been inconsistent. The discrepancy might be partly due to differences in study populations and design, and partly due to the insufficient statistical power of individual studies. Therefore, we conducted a meta-analysis of all observational studies published between the dates of database inception and April 30th, 2016 to summarize available evidence on the association between both dietary nitrate and nitrite intake and cancer risk.
RESULTS
Literature search
Figure 1 illustrates the flow diagram of the literature search and study selection. We identified 3058 potentially relevant articles from search of PubMed databases. Of these, 2804 and 167 articles were excluded based on titles and abstracts using general criteria respectively, leaving 87 articles for full-text review. Seven articles were identified by hand searching of the references list of these articles. A total of 94 articles went on full-text review. During this review, 3 articles was excluded because of duplicate reports from the same study population, 12 articles were excluded because they did not report usable or enough data of risk estimates and 13 articles were excluded because of mortality or survival data, 4 articles were excluded because they report combined association of nitrate and nitrite. The remaining 62 articles were included in this meta-analysis.
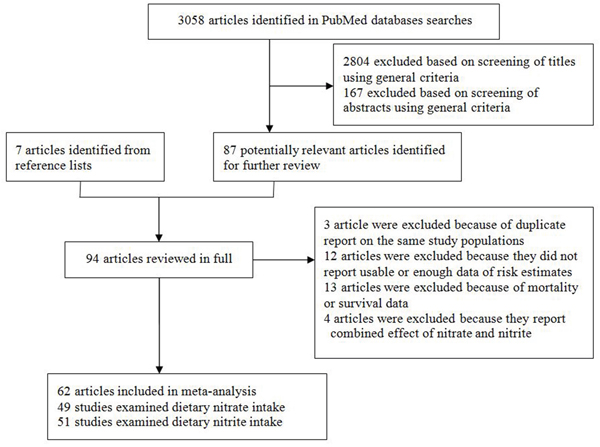
Figure 1: Selection of studies for inclusion in the meta-analysis.
Characteristics of the studies
Characteristics of the 62 included articles are shown in Table 1. The included articles, which reported the combined 60,627 cases and 4,730,572 non-cases, were published between 1985 and 2016 and consist of 24 prospective studies [5–28] and 38 case-control studies [29–66].
Table 1: Characteristics of studies included in the meta-analysis§
|
|
Study design |
Area |
Sex* |
|
||||||
|---|---|---|---|---|---|---|---|---|---|---|---|
Cancer site |
No. of studies |
Cohort |
C–C |
Europe |
North America |
Asia |
Others/mixed |
M |
F |
M+F |
Adjusted estimates† |
Nitrate |
|
|
|
|
|
|
|
|
|
|
|
Adult glioma |
5 |
2 |
3 |
1 |
3 |
- |
1 |
1 |
1 |
4 |
2 |
Bladder |
6 |
3 |
3 |
1 |
5 |
- |
- |
1 |
1 |
4 |
3 |
Breast |
3 |
2 |
1 |
- |
2 |
1 |
- |
- |
3 |
- |
2 |
Colorectal |
6 |
4 |
2 |
1 |
4 |
1 |
- |
- |
2 |
4 |
6 |
Endometrial |
1 |
- |
1 |
- |
1 |
- |
- |
- |
1 |
- |
1 |
Esophageal |
4 |
2 |
2 |
1 |
3 |
- |
- |
1 |
1 |
3 |
4 |
Gastric |
15 |
6 |
9 |
8 |
5 |
1 |
1 |
1 |
1 |
14 |
8 |
Head and neck |
1 |
1 |
- |
1 |
- |
- |
- |
- |
- |
1 |
1 |
Hepatocellular carcinoma |
1 |
1 |
- |
- |
1 |
- |
- |
- |
- |
1 |
1 |
Larynx |
1 |
- |
1 |
- |
1 |
- |
- |
- |
- |
1 |
1 |
Leukemia |
1 |
1 |
- |
- |
1 |
- |
- |
- |
- |
1 |
1 |
Lung and bronchus |
1 |
1 |
- |
- |
1 |
- |
- |
- |
- |
1 |
1 |
Non-Hodgkin lymphoma |
4 |
1 |
3 |
- |
4 |
- |
- |
- |
2 |
2 |
4 |
Ovarian |
3 |
3 |
- |
- |
3 |
- |
- |
- |
3 |
- |
3 |
Oral cavity |
1 |
- |
1 |
- |
1 |
- |
- |
- |
- |
1 |
1 |
Pancreatic |
3 |
2 |
1 |
- |
3 |
- |
- |
1 |
2 |
1 |
1 |
Prostate |
1 |
1 |
- |
- |
1 |
- |
- |
1 |
- |
- |
1 |
Renal cell |
3 |
2 |
1 |
- |
3 |
- |
- |
- |
1 |
2 |
3 |
Skin (Melanoma) |
1 |
1 |
- |
- |
1 |
- |
- |
- |
- |
1 |
1 |
Thyroid |
3 |
3 |
- |
- |
2 |
1 |
- |
- |
2 |
1 |
3 |
Uterine corpus |
1 |
1 |
- |
- |
1 |
- |
- |
- |
- |
1 |
1 |
Nitrite |
|
|
|
|
|
|
|
|
|
|
|
Adult glioma |
6 |
2 |
4 |
1 |
4 |
- |
1 |
1 |
1 |
5 |
3 |
Bladder |
4 |
1 |
3 |
- |
4 |
1 |
- |
2 |
2 |
2 |
2 |
Breast |
4 |
3 |
1 |
1 |
3 |
- |
- |
1 |
3 |
- |
4 |
Colorectal |
6 |
4 |
2 |
2 |
3 |
1 |
- |
- |
1 |
5 |
5 |
Esophageal |
7 |
3 |
4 |
2 |
5 |
- |
- |
1 |
1 |
6 |
7 |
Gastric |
19 |
5 |
14 |
10 |
6 |
- |
3 |
1 |
1 |
18 |
13 |
Head and neck |
1 |
1 |
- |
1 |
- |
- |
- |
- |
- |
1 |
1 |
Hepatocellular carcinoma |
1 |
1 |
- |
- |
1 |
- |
- |
- |
- |
1 |
1 |
Larynx |
1 |
1 |
- |
- |
1 |
- |
- |
- |
- |
1 |
1 |
Lung and bronchus |
1 |
1 |
- |
1 |
- |
- |
- |
- |
- |
1 |
1 |
Nasopharyngeal |
1 |
1 |
- |
- |
- |
1 |
- |
- |
- |
1 |
- |
Non-Hodgkin lymphoma |
4 |
- |
4 |
- |
4 |
- |
- |
1 |
- |
3 |
3 |
Ovarian |
3 |
3 |
- |
1 |
2 |
- |
- |
- |
3 |
- |
3 |
Oral cavity |
1 |
1 |
- |
- |
1 |
- |
- |
- |
- |
1 |
1 |
Pancreatic |
2 |
1 |
1 |
- |
2 |
- |
- |
1 |
1 |
1 |
2 |
Prostate |
2 |
2 |
- |
1 |
1 |
- |
- |
2 |
- |
- |
2 |
Renal cell |
2 |
1 |
1 |
- |
2 |
- |
- |
- |
- |
2 |
2 |
Thyroid |
2 |
2 |
- |
- |
1 |
1 |
- |
- |
1 |
1 |
2 |
*Studies that reported gender-specific estimates were counted twice (in both M and W columns).
†The site-specific list of main confounders considered is total energy intake.
§C-C=Case-control, M=Male, F=Female.
Among the included prospective studies, one article consisted of 3 cohorts. Therefore, a total of 24 prospective studies included 26 cohorts. Of the 24 prospective studies, 17 studies were conducted in the United States, 4 studies in Europe, 2 studies in China, and one study was conducted in United Kingdom. Cohort sizes ranged from 9,985 to 545,770, and the number of cancer cases varied from 45 to 9,305 cases.
Of 38 case-control studies, 21 studies were conducted in the United States, 7 studies in Europe, 3 studies were conducted in Asia, 2 studies each were conducted in Canada, Mexico, and Uruguay, and one study was conducted in Australia, The number of cases enrolled in these studies ranged from 79 to 1760 cases, and the number of control subjects varied from 128 to 2481 subjects. Control subjects were drawn from the general population in 27 studies, hospitals in 11 studies.
Dietary nitrate intake and site-specific cancer risk
Twenty-two prospective and twenty-eight case-control studies investigated the association between dietary nitrate intake and cancer risk. Among the included studies, 15 studies were on gastric cancer, 6 studies each on colorectal cancer and non-Hodgkin lymphoma, 5 studies each on adult glioma and bladder cancer, 4 studies on esophageal cancer, 3 studies each on breast cancer, pancreatic cancer, renal cell cancer and thyroid cancer and ovarian cancer.
Comparing the highest vs. the lowest levels of dietary nitrate intake, statistically significant inverse association was observed for gastric cancer (RR = 0.78, 95%CI = 0.67-0.91) (Figure 2). No significant associations were found between dietary nitrate intake and adult glioma (RR = 1.02, 95%CI = 0.85-1.22), breast cancer (RR = 0.97, 95%CI = 0.79-1.19), bladder cancer (RR = 0.93, 95%CI = 0.82-1.06), colorectal cancer (RR = 1.07, 95%CI = 0.97-1.17), esophageal cancer (RR = 0.94, 95%CI = 0.74-1.19), non-Hodgkin lymphoma (RR = 0.90, 95%CI = 0.76-1.06), ovarian cancer (RR = 0.90, 95%CI = 0.54-1.52), pancreatic cancer (RR = 0.97, 95%CI = 0.83-1.13), renal cell cancer (RR = 0.78, 95%CI = 0.40-1.54), and thyroid cancer (RR = 1.24, 95%CI = 0.89-1.72) (Figure 2 and Figure 3).
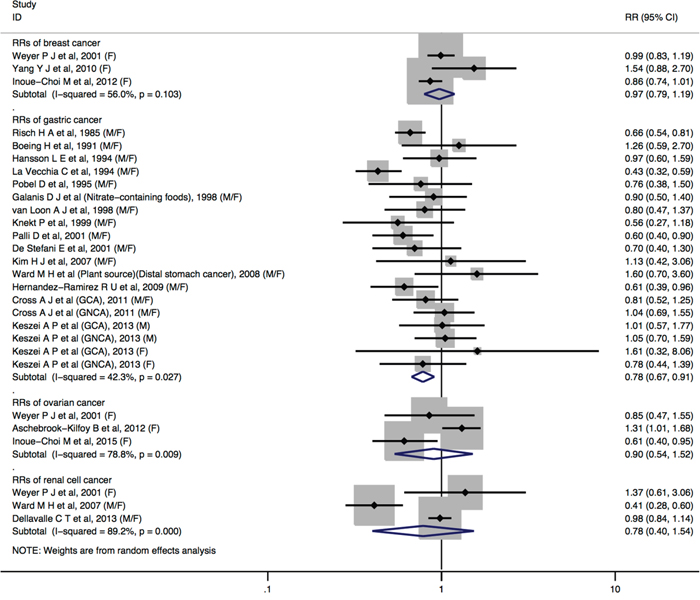
Figure 2: Forest plot (random-effects model) quantifying the relationships between dietary nitrate intake and breast cancer, gastric cancer, ovarian cancer, and renal cell cancer. Squares indicate study-specific RRs (the size of the square reflects the study-specific statistical weight); horizontal lines indicate 95%CIs; the diamond indicates the summary RR estimate with its 95%CI. All statistical tests were two-sided. CI = confidence interval; RR = relative risk; M=Male; F=Female.
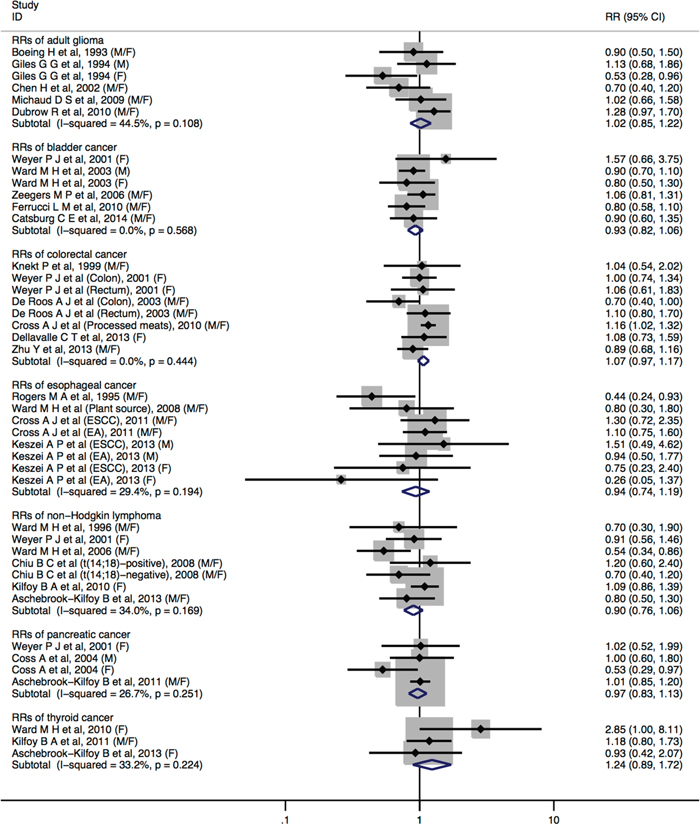
Figure 3: Forest plot (fixed-effects model) quantifying the relationships between dietary nitrate intake and adult glioma, bladder cancer, colorectal cancer, esophageal cancer, non-Hodgkin lymphoma, pancreatic cancer, and thyroid cancer. Squares indicate study-specific RRs (the size of the square reflects the study-specific statistical weight); horizontal lines indicate 95%CIs; the diamond indicates the summary RR estimate with its 95%CI. All statistical tests were two-sided. CI = confidence interval; RR = relative risk; M=Male; F=Female.
No statistically significant heterogeneity across studies was detected for dietary nitrate intake in relation to cancers of adult glioma, bladder cancer, colorectal cancer, esophageal cancer, non-Hodgkin lymphoma, pancreatic cancer, and thyroid cancer. We observed some heterogeneity for studies of dietary nitrate intake and breast cancer (I2 = 56.0%, Pheterogeneity = 0.103), gastric cancer (I2 = 42.3%, Pheterogeneity = 0.027), ovarian cancer (I2 = 78.8%, Pheterogeneity = 0.009), and renal cell cancer (I2 = 89.2%, Pheterogeneity <0.001).
In subgroup analyses of dietary nitrate intake and cancer risk of the colorectal, gastric and esophageal by sex, study design, study population, cancer type, most strata showed similar results, and there was no evidence of significant heterogeneity between-subgroups with meta-regression analyses (Table 2). When stratified by the adjustment for potential confounders, significant associations were observed among studies of gastric cancer without adjustment but not among studies with adjustment. The discrepancies are likely to be due to a small number of studies included in the analysis, especially about vitamin C intake.
Table 2: Summary relative risks (95% confidence intervals) of high vs. low levels of dietary nitrate intake in relation to cancer risk, stratified by selected study characteristics
|
Colorectal cancer |
Gastric cancer |
Esophageal cancer |
|||||||||
|---|---|---|---|---|---|---|---|---|---|---|---|---|
Variable |
Number of RRs |
RR (95%CI) |
Ph* |
Ph† |
Number of RRs |
RR (95%CI) |
Ph* |
Ph† |
Number of RRs |
RR (95%CI) |
Ph* |
Ph† |
Sex |
|
|
|
0.820 |
|
|
|
0.167 |
|
|
|
0.783 |
Male |
- |
- |
- |
|
1 |
1.04(0.74-1.44) |
0.913 |
|
1 |
1.05 (0.61-1.83) |
0.471 |
|
Female |
1 |
1.08 (0.73-1.59) |
- |
|
1 |
0.85(0.49-1.46) |
0.407 |
|
1 |
0.53 (0.20-1.37) |
0.306 |
|
Male and female |
5 |
1.07 (0.97-1.18) |
0.335 |
|
14 |
0.75(0.63-0.88) |
0.030 |
|
3 |
0.95 (0.72-1.25) |
0.080 |
|
Study design |
|
|
|
0.105 |
|
|
|
0.002 |
|
|
|
0.073 |
HC-CS |
- |
- |
- |
|
4 |
0.53(0.42-0.68) |
0.115 |
|
- |
- |
- |
|
PC-CS |
2 |
0.90 (0.74-1.10) |
0.324 |
|
5 |
0.69(0.59-0.81) |
0.144 |
|
2 |
0.55 (0.32-0.94) |
0.297 |
|
CS |
4 |
1.12 (1.01-1.25) |
0.915 |
|
6 |
0.92(0.78-1.09) |
0.866 |
|
2 |
1.06 (0.82-1.39) |
0.533 |
|
Study populations |
|
|
|
0.817 |
|
|
|
0.739 |
|
|
|
0.929 |
Asians |
1 |
1.08 (0.73-1.59) |
- |
|
1 |
1.13(0.42-3.05) |
- |
|
- |
- |
- |
|
Americans |
4 |
1.07 (0.97-1.18) |
0.232 |
|
5 |
0.75(0.65-0.87) |
0.120 |
|
3 |
0.95 (0.72-1.25) |
0.080 |
|
Europeans |
1 |
1.04 (0.54-2.02) |
- |
|
8 |
0.77(0.61-0.98) |
0.018 |
|
1 |
0.89 (0.55-1.43) |
0.379 |
|
Cancer subtypes |
|
|
|
0.310 |
|
|
|
0.710 |
|
|
|
0.539 |
Colon/GCA/EA |
2 |
0.90 (0.70-1.15) |
0.200 |
|
2 |
0.90(0.64-1.27) |
0.644 |
|
2 |
1.00 (0.73-1.38) |
0.244 |
|
Rectum/GNCA/ESCC |
2 |
1.09 (0.80-1.48) |
0.913 |
|
2 |
0.99(0.76-1.28) |
0.672 |
|
2 |
1.22 (0.76-1.97) |
0.656 |
|
Adjustments in models |
|
|
|
|
|
|
|
|
|
|
|
|
Body mass index |
|
|
|
0.578 |
|
|
|
0.780 |
|
|
|
0.854 |
No |
4 |
0.99 (0.84-1.18) |
0.735 |
|
11 |
0.74(0.65-0.86) |
0.413 |
|
1 |
0.80 (0.30-1.80) |
- |
|
Yes |
2 |
1.10 (0.98-1.24) |
0.080 |
|
4 |
0.78(0.59-1.04) |
0.004 |
|
3 |
0.95 (0.74-1.21) |
0.134 |
|
Total energy intake |
|
|
|
0.416 |
|
|
|
0.878 |
|
|
|
- |
No |
1 |
0.92 (0.69-1.23) |
0.135 |
|
7 |
0.73(0.63-0.85) |
0.357 |
|
- |
- |
- |
|
Yes |
5 |
1.09 (0.98-1.20) |
0.629 |
|
8 |
0.79(0.62-0.99) |
0.011 |
|
4 |
0.94 (0.74-1.19) |
0.194 |
|
Cigarette smoking |
|
|
|
0.567 |
|
|
|
0.022 |
|
|
|
|
No |
3 |
0.99 (0.83-1.18) |
0.600 |
|
8 |
0.67(0.54-0.84) |
0.050 |
|
- |
- |
- |
- |
Yes |
3 |
1.10 (0.98-1.24) |
0.213 |
|
7 |
0.91(0.77-1.07) |
0.770 |
|
4 |
0.94 (0.74-1.19) |
0.194 |
|
Alcohol consumption |
|
|
|
0.260 |
|
|
|
0.055 |
|
|
|
|
No |
5 |
1.10 (0.99-1.21) |
0.565 |
|
9 |
0.68(0.55-0.85) |
0.063 |
|
- |
- |
- |
- |
Yes |
1 |
0.89 (0.68-1.16) |
- |
|
6 |
0.89(0.76-1.05) |
0.575 |
|
4 |
0.94 (0.74-1.19) |
0.194 |
|
Vitamin C intake |
|
|
|
0.820 |
|
|
|
0.336 |
|
|
|
0.854 |
No |
5 |
1.07 (0.97-1.18) |
0.335 |
|
13 |
0.76(0.65-0.89) |
0.036 |
|
3 |
0.95 (0.74-1.21) |
0.134 |
|
Yes |
1 |
1.08 (0.73-1.59) |
- |
|
2 |
0.98(0.63-1.54) |
0.165 |
|
1 |
0.80 (0.30-1.80) |
- |
|
Physical activity |
|
|
|
0.412 |
|
|
|
0.061 |
|
|
|
0.073 |
No |
4 |
1.10 (0.99-1.22) |
0.437 |
|
13 |
0.72(0.60-0.86) |
0.052 |
|
2 |
0.55 (0.32-0.94) |
0.297 |
|
Yes |
2 |
0.95 (0.76-1.18) |
0.422 |
|
2 |
|
0.872 |
|
2 |
1.06 (0.82-1.39) |
0.533 |
|
Family history of cancer |
|
|
|
- |
|
|
|
0.033 |
|
|
|
- |
No |
6 |
1.07 (0.97-1.17) |
0.444 |
|
11 |
0.80(0.71-0.90) |
0.340 |
|
4 |
0.94 (0.74-1.19) |
0.194 |
|
Yes |
- |
- |
- |
|
4 |
0.61(0.42-0.87) |
0.087 |
|
- |
- |
- |
|
*P value for heterogeneity within each subgroup.
†P value for heterogeneity between subgroups with meta-regression analysis.
Dietary nitrite intake and site-specific cancer risk
Twenty prospective and thirty-two case-control studies examined the association between dietary nitrite intake and cancer risk. Among all included studies, 19 studies were on gastric cancer, 7 studies on esophageal cancer, 6 studies each on colorectal cancer, adult glioma, 4 studies each on bladder cancer, non-Hodgkin lymphoma, 3 studies on breast cancer, 2 studies each on ovarian cancer, pancreatic cancer, renal cell cancer, thyroid cancer, and prostate cancer.
Individuals with highest nitrites consumption, compared with the lowest, increased the risk of adult glioma (RR= 1.21, 95%CI = 1.03-1.42), thyroid (RR= 1.52, 95%CI = 1.12-2.05) (Figure 4). No statistically significant associations were detected between dietary nitrite intake and bladder cancer (RR = 1.11, 95%CI = 0.97-1.28), breast cancer (RR = 1.09, 95%CI = 0.98-1.20), colorectal cancer (RR = 1.12, 95%CI = 0.97-1.28), esophageal cancer (RR = 1.24, 95%CI = 0.98-1.55), non-Hodgkin lymphoma (RR = 1.54, 95%CI = 0.98-2.41), ovarian cancer (RR = 0.98, 95%CI = 0.66-1.45), pancreatic cancer (RR = 0.96, 95%CI = 0.82-1.12), prostate cancer (RR = 0.98, 95%CI = 0.84-1.14), and renal cell cancer (RR = 1.00, 95%CI = 0.86-1.16). Furthermore, a borderline significant associations were found in gastric cancer (RR = 1.21, 95%CI = 0.99-1.47) (Figure 4 and Figure 5).
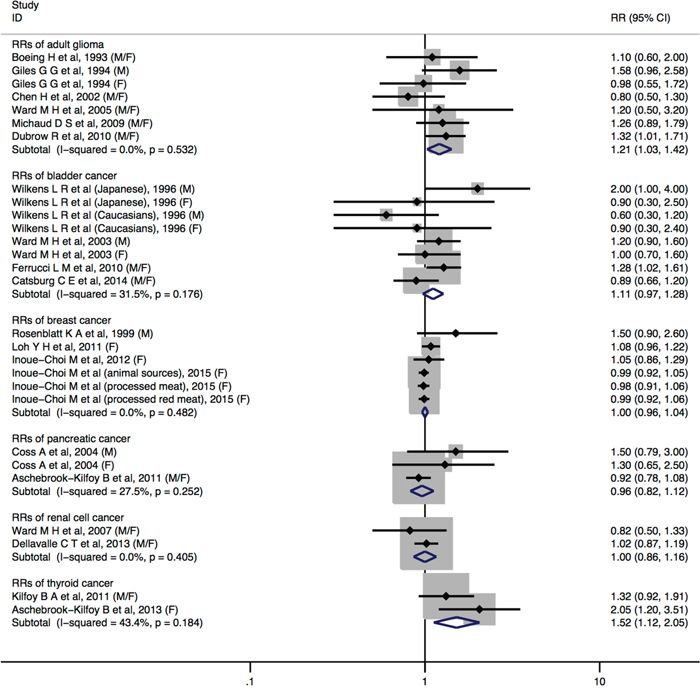
Figure 4: Forest plot (fixed-effects model) quantifying the relationships between dietary nitrite intake and adult glioma, bladder cancer, breast cancer, pancreatic cancer, renal cell cancer, and thyroid cancer. Squares indicate study-specific RRs (the size of the square reflects the study-specific statistical weight); horizontal lines indicate 95%CIs; the diamond indicates the summary RR estimate with its 95%CI. All statistical tests were two-sided. CI = confidence interval; RR = relative risk; M=Male; F=Female.
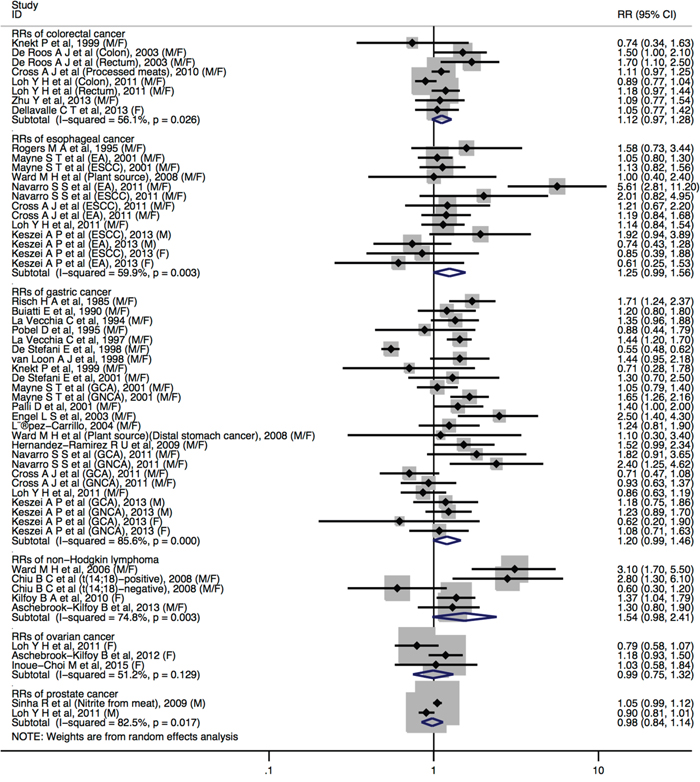
Figure 5: Forest plot (random-effects model) quantifying the relationships between dietary nitrite intake and colorectal cancer, esophageal cancer, gastric cancer, non-Hodgkin lymphoma, ovarian cancer and prostate cancer. Squares indicate study-specific RRs (the size of the square reflects the study-specific statistical weight); horizontal lines indicate 95%CIs; the diamond indicates the summary RR estimate with its 95%CI. All statistical tests were two-sided. CI = confidence interval; RR = relative risk; M=Male; F=Female.
No statistically significant heterogeneity across studies was observed for dietary nitrite intake in relation to cancers of adult glioma, bladder, breast, ovarian cancer, pancreatic, renal cell, and thyroid. We observed heterogeneity for studies of dietary nitrite intake and colorectal cancer (I2 = 56.1%, Pheterogeneity = 0.026), esophageal cancer (I2 = 59.9%, Pheterogeneity = 0.003), gastric cancer (I2 = 85.6%, Pheterogeneity <0.001), non-Hodgkin lymphoma (I2 = 74.8%, Pheterogeneity = 0.003), ovarian cancer (I2 = 51.2%, Pheterogeneity = 0.129) and prostate cancer (I2 = 82.5%, Pheterogeneity = 0.017).
When stratified by subgroup of sex, study design, study population, cancer type of dietary nitrite intake in relation to cancers of the colorectal, gastric and esophageal, most strata showed similar results and no evidence of significant heterogeneity between-subgroups with meta-regression analyses (Table 3). In the adjustment for potential confounders analyses, there did not shown a significant difference between estimates adjusted and those not adjusted for specific factors in colorectal cancer and gastric cancer, except esophageal cancer. Although the deviation from adjustments of esophageal cancer most likely due to a small number of studies.
Table 3: Summary relative risks (95% confidence intervals) of high vs. low levels of dietary nitrite intake in relation to cancer risk, stratified by selected study characteristics
|
Colorectal cancer |
Gastric cancer |
Esophageal cancer |
|||||||||
|---|---|---|---|---|---|---|---|---|---|---|---|---|
Variable |
Number of RRs |
RR (95%CI) |
Ph* |
Ph† |
Number of RRs |
RR (95%CI) |
Ph* |
Ph† |
Number of RRs |
RR (95%CI) |
Ph* |
Ph† |
Sex |
|
|
|
0.766 |
|
|
|
0.775 |
|
|
|
0.423 |
Male |
- |
- |
- |
|
1 |
1.21(0.93-1.58) |
0.884 |
|
1 |
1.16 (0.46-2.95) |
0.037 |
|
Female |
1 |
1.05 (0.77-1.42) |
- |
|
1 |
1.01(0.68-1.49) |
0.365 |
|
1 |
0.74 (0.41-1.34) |
0.588 |
|
Male and female |
5 |
1.13 (0.97-1.32) |
0.014 |
|
18 |
1.23(0.99-1.54) |
0.000 |
|
6 |
1.35 (1.04-1.75) |
0.004 |
|
Study design |
|
|
|
0.092 |
|
|
|
0.616 |
|
|
|
0.214 |
HC-CS |
- |
- |
- |
|
5 |
1.07(0.65-1.74) |
0.000 |
|
- |
- |
- |
|
PC-CS |
2 |
1.37 (1.11-1.70) |
0.227 |
|
8 |
1.52(1.34-1.73) |
0.270 |
|
4 |
1.56 (0.99-2.45) |
<0.001 |
|
CS |
4 |
1.04 (0.96-1.13) |
0.114 |
|
5 |
1.01(0.88-1.17) |
0.267 |
|
3 |
1.10 (0.92-1.32) |
0.341 |
|
Study populations |
|
|
|
0.236 |
|
|
|
0.003 |
|
|
|
0.241 |
Asians/African |
1 |
1.05 (0.77-1.42) |
- |
|
2 |
0.80(0.35-1.84) |
0.009 |
|
- |
- |
- |
|
Americans |
3 |
1.17 (1.05-1.31) |
0.126 |
|
8 |
1.39(1.12-1.73) |
0.003 |
|
5 |
1.41 (1.03-1.94) |
0.002 |
|
Europeans |
2 |
0.99 (0.78-1.26) |
0.065 |
|
9 |
1.25(1.13-1.38) |
0.269 |
|
2 |
1.05 (0.83-1.31) |
0.178 |
|
Cancer subtypes |
|
|
|
0.571 |
|
|
|
0.312 |
|
|
|
0.936 |
Colon/GCA/EA |
2 |
1.12 (0.68-1.87) |
0.011 |
|
4 |
1.04(0.84-1.28) |
0.131 |
|
4 |
1.26 (0.74-2.14) |
<0.001 |
|
Rectum/GNCA/ESCC |
2 |
1.35 (0.96-1.91) |
0.116 |
|
4 |
1.32(1.01-1.73) |
0.040 |
|
4 |
1.17 (0.93-1.46) |
0.348 |
|
Adjustments in models |
|
|
|
|
|
|
|
|
|
|
|
|
Body mass index |
|
|
|
0.252 |
|
|
|
0.335 |
|
|
|
0.015 |
No |
3 |
1.27 (1.04-1.55) |
0.111 |
|
13 |
1.31(0.94-1.83) |
0.000 |
|
2 |
2.32 (0.82-6.52) |
0.009 |
|
Yes |
3 |
1.05 (0.96-1.14) |
0.080 |
|
6 |
1.13(0.96-1.32) |
0.030 |
|
5 |
1.09 (0.95-1.24) |
0.554 |
|
Total energy intake |
|
|
|
0.042 |
|
|
|
0.571 |
|
|
|
- |
No |
1 |
1.59 (1.21-2.09) |
- |
|
6 |
1.35(0.80-2.27) |
0.000 |
|
- |
- |
- |
|
Yes |
5 |
1.04 (0.96-1.13) |
0.186 |
|
13 |
1.19(1.07-1.31) |
0.056 |
|
7 |
1.24 (0.98-1.55) |
0.003 |
|
Cigarette smoking |
|
|
|
0.133 |
|
|
|
0.007 |
|
|
|
0.001 |
No |
2 |
1.32 (1.08-1.62) |
0.131 |
|
10 |
1.47(1.32-1.63) |
0.371 |
|
1 |
3.50 (1.29-9.54) |
- |
|
Yes |
4 |
1.04 (0.96-1.13) |
0.112 |
|
9 |
1.00(0.77-1.31) |
0.000 |
|
6 |
1.09 (0.95-1.24) |
0.644 |
|
Alcohol consumption |
|
|
|
0.318 |
|
|
|
0.016 |
|
|
|
0.001 |
No |
4 |
1.16 (1.04-1.29) |
0.121 |
|
11 |
1.45(1.30-1.61) |
0.285 |
|
1 |
3.50 (1.29-9.54) |
- |
|
Yes |
2 |
1.03 (0.84-1.26) |
0.073 |
|
8 |
1.03(0.78-1.35) |
0.000 |
|
6 |
1.09 (0.95-1.24) |
0.644 |
|
Vitamin C intake |
|
|
|
0.766 |
|
|
|
0.712 |
|
|
|
0.731 |
No |
5 |
1.13 (0.97-1.32) |
0.014 |
|
17 |
1.20(0.98-1.47) |
0.000 |
|
6 |
1.25 (0.99-1.59) |
0.002 |
|
Yes |
1 |
1.05 (0.77-1.42) |
- |
|
2 |
1.40(0.95-2.07) |
0.681 |
|
1 |
1.00 (0.40-2.40) |
- |
|
Physical activity |
|
|
|
0.222 |
|
|
|
0.069 |
|
|
|
0.214 |
No |
3 |
1.17 (1.04-1.31) |
0.076 |
|
16 |
1.33(1.03-1.72) |
0.000 |
|
4 |
1.56 (0.99-2.45) |
<0.001 |
|
Yes |
3 |
1.00 (0.90-1.12) |
0.149 |
|
3 |
0.98(0.84-1.14) |
0.380 |
|
3 |
1.10 (0.92-1.32) |
0.341 |
|
Family history of cancer |
|
|
|
- |
|
|
|
0.447 |
|
|
|
- |
No |
6 |
1.12 (0.98-1.28) |
0.026 |
|
16 |
1.18(0.95-1.47) |
0.000 |
|
7 |
1.24 (0.98-1.55) |
0.003 |
|
Yes |
- |
- |
- |
|
3 |
1.39(1.13-1.71) |
0.971 |
|
- |
- |
- |
|
*P value for heterogeneity within each subgroup.
†P value for heterogeneity between subgroups with meta-regression analysis.
Dose-response analysis between dietary nitrate/nitrite intake and site-specific cancer risk
Limited number of studies available precluded any meaningful subgroup analyses for linear dose-response meta-analyses. Eighteen [6, 9, 15, 22, 23, 34, 35, 42, 43, 45, 46, 48, 50, 52-54, 61, 62] and twelve [5, 6, 9, 34, 42, 43, 45, 46, 48, 50, 52, 53] studies were included in the dose-response analysis for dietary nitrate and nitrite respectively. The summary RR for each increase by 10mg/day for dietary nitrate intake was 0.99 (95%CI = 0.98-1.00) with moderate to high heterogeneity (I2 = 63.4%). Increasing the dosage of dietary nitrite by 0.5mg/day, the pooled RR for cancer risk was 1.04 (95%CI = 0.99-1.08) with moderate heterogeneity (I2 = 70.6%) (data not shown). Publication bias was not detected by using Egger’s test or Begg’s test or by visual inspection of the funnel plot both for nitrate and nitrite intake.
Publication bias and meta-regression
With regards to dietary nitrate intake and gastric cancer, funnel plot and Egger’s regression test (P = 0.018) suggested publication bias, whereas Begg’s rank correlation test (P = 0.208) did not. Adjusting the possible publication bias for nitrates using “trim and fill” method did not influence the pooled RR (RR = 0.65, 95%CI = 0.56-0.77). We did not evaluate publication bias for other cancer sites due to small numbers of studies for those sites.
No publication bias was evident for the relations of dietary nitrite intake to esophageal cancer (Begg’s rank correlation test: P = 0.583; Egger’s regression test: P = 0.349). A significantly publication bias was detected in gastric cancer by Egger’s regression test (P = 0.024), whereas Begg’s rank correlation test did not (P = 0.293). Adjusting the possible publication bias for gastric cancer using “trim and fill” method significantly influenced the conclusion (RR = 0.80, 95%CI = 0.65-0.99). To explore the possible heterogeneity between dietary nitrite and gastric cancer, we further conducted a meta-regression. We found that geographic area was the main source of heterogeneity for nitrites, which interpreted 73.83%(0.049/0.188) of the estimated between-study variance (τ2). We did not evaluate publication bias for other cancer sites due to small numbers of studies for those sites.
DISCUSSION
Overall, the primary finding from our meta-analysis of epidemiologic studies indicated that consumption of food rich in nitrate was inversely associated with gastric cancer risk, but high intake of nitrite may result in an elevated cancer risk of adult glioma and thyroid.
Highest category of dietary nitrate intake had a 22% reduction in gastric cancer risk compared with that for the lowest intake category. We also found a weak increased association of gastric cancer risk among those who reported higher consumption of dietary nitrite. In addition, similar results were found in dose-response analyses between dietary nitrate/nitrite intake and cancer risk.
The association between dietary nitrate intake and cancer risk is tenuous. Some investigators observed an increase in gastric cancer risk with increasing nitrate consumption [49] whereas, others had observed no association [24, 25, 57, 59]; despite this, several biologic mechanisms may mediate the observed inverse association between dietary nitrate intake and gastric cancer risk. First, the reverse association for nitrate may be due to the protective effect of vegetables in the diet. The major sources of dietary nitrate are vegetables, which contain nutrients that inhibit the in vivo N-nitrosation in food, and its protection effect is likely to be reflected by vitamin C and other anti-oxidants [67]. For example, vitamin C and vitamin E have been shown to inhibit the formation of N-nitroso compounds from nitrate in human subjects [68]. Food components, such as vitamins C and E, may exert an inhibitory effect in cancer carcinogenesis by blocking the nitrosation process by quenching free radicals in their anaerobic reaction with nitrite, thus reducing the endogenous synthesis of NOCs [69]. Further studies with large sample size and sufficient statistical power are required to confirm or refute these findings.
In the present study, we observed higher consumption of food rich in nitrite probably increases the risk of adult glioma and thyroid cancer. However, it should be noted that only a few studies were included for each cancer in our meta-analysis. Associations between dietary nitrite intake and cancer risk were reported controversial in many previous studies. Most of the case-control studies [49, 70], but not all [57, 59], showed positive association between nitrite intake and gastric cancer risk, whereas three prospective studies did not support positively association [11, 13, 24]. These contradictory results may due to various sources of dietary nitrite. The main source of dietary nitrite is usually animal products (especially processed meats), which also contain amines and amides, precursors necessary for endogenous nitrosation [71]. As a result, dietary nitrite intake from animal products may result in more substantial exposure to NOCs than consumption from plant source products.
Our systematic review and meta-analysis have a number of important strengths. This meta-analysis included a large sample size of 60,627 cases and 4,730,572 non-cases, uniform criteria was applied for identifying relevant studies and abstracting pertinent information. In addition, our study considered a number of subgroups to explore heterogeneity. Still, consideration should also be given to potential limitations in this meta-analysis. First, this meta-analysis is based on observational studies, including case-control and cohort studies, and therefore, the potential study biases or residual confounder within the individual studies can affect the pooled estimate. Thus, larger studies, especially prospective studies, are warranted in the future. Second, nitrate and nitrite are potential human carcinogens under conditions preferable to endogenous nitrosation (e.g., vitamin C), but not many studies considered these factor; not many studies assessed nitrate and nitrite intake by specific food sources or stratified/adjusted for these factors. Concomitant consumption of dietary nitrite/nitrite and vitamin C is likely to be important for inhibition of endogenous nitrosation [72], but we were not able to assess this because of limited data source. Third, although food frequency questionnaire (FFQ) has been widely used to capture habitual dietary intake, the accuracy of FFQ remains a concern. Due to the lack of uniformity for exposure assessment across studies, measurement error in different studies was inevitable. However, we were unable to rule out variation in the FFQ, as most studies did not show FFQ accuracy and validation. Fourth, dietary nitrate and nitrite intake levels are different by country and region. There was a wide range of nitrates/nitrites intake values between the lowest and highest categories, and the present study including studies in different populations from multiple regions, which might lead to the heterogeneity in the pooled analysis. Nitrate contents in vegetables vary by fertilizer application practice, and nitrite contents in processed meats vary by food additive regulations. Nitrate intake is usually higher in Asian populations than in Western populations because Asian diets are more vegetable-based. Lastly, during the long follow-up for cohort studies, dietary intake level of nitrates, nitrites might have changed due to participants may have changed their dietetic patterns. Meanwhile, food-processing technology has developed as well. Further prospective studies with update dietary information are warranted.
In conclusion, findings from this meta-analysis provided modest evidence that dietary nitrate and nitrite intake were potentially associated with certain type of cancer risk. In the field of nutritional epidemiology, diet is a very complex and potentially modifiable exposure. Because of these limitations and confounding factors, we could not absolutely confirm the reliability of these findings. Future well-designed observational studies are warranted to further clarify the potential nitrate/nitrite and cancer association by subtypes and according to molecular classifications.
MATERIALS AND METHODS
Literature and search strategy
We identified studies through searching from database initiation until April 30th, 2016 using MEDLINE (PubMed; http://www.ncbi.nlm.nih.gov/pubmed) for both case-control and cohort studies that evaluated the association between dietary nitrate or nitrite intake and the risk of cancer. The search was limited to published studies in English and studies of humans by using the following keywords and Medical Subject Headings terms: (nitrate OR nitrite OR N-nitroso compounds) AND (cancer OR neoplasm OR carcinoma OR tumor). In addition, we carried out a manual retrieve of reference lists of included studies to identify other possible eligible articles that were not found in our primary search. We followed standard criteria for conducting and reporting meta-analyses. [73, 74]
Study selection criteria
Published studies were included in the analysis based on the following criteria: (1) investigated the association between dietary nitrate and/or nitrite intake and cancer risk; (2) had a case-control or cohort study design; (3) provided odds ratio (OR), relative risk (RR), or hazard ratio (HR) estimates with its 95%CI or data necessary to calculate them. When multiple publications from the same study were available, we used the publication with the largest number of cases or the most-applicable information. To be eligible for dose-response analysis, the studies had to further provide quantitative measure of dietary nitrate/nitrite intake for at least three categories with the estimates of RRs, corresponding 95%CI, category-specific or total number of cases and category-specific or total number of either person-years or non-cases.
Finally, we identified 62 potentially relevant full-text publications from 3058 articles (Figure 1). In total, 49 publications reported dietary nitrate intake and cancer risk and 51 publications reported dietary nitrite intake and cancer risk. For the dose-response analyses, we included 18 publications for nitrate intake analysis and 12 publications for nitrite intake analysis.
Data abstraction
Two investigators (L X and M M) independently performed the eligibility evaluation with the inclusion criteria and data abstraction. Disagreements were discussed and resolved by consensus or by involving a third reviewer (J Z). The following information was extracted from each eligible study by: (1) name of the first author; (2) year of publication; (3) origin of country; (4) study sample size (number of cases, and controls or cohort size); (5) gender; (6) duration of follow-up for cohort studies; (7) exposure and outcome assessment including dietary nitrate and/or nitrite intake category; (8) cancer type; (9) study-specific adjusted estimates with their 95%CIs for highest compared with lowest dietary nitrate/nitrite intake; (10) factors matched by or adjusted for in data analysis. If multiple estimates of the association were available, we abstracted the estimate that adjusted for most of confounders. If none were adjusted, we included the crude estimate. If no estimate was given, it was calculated with its corresponding 95%CI using raw data presented in the publication.
We did not adopt the Newcastle-Ottawa Scale [75] to assess the methodological quality of all included studies because quality scoring in a meta-analysis of observational studies is controversial, which might bring the analyst's subjective bias to the results and impedes the recognition of key sources of heterogeneity [76, 77]. Instead, we carried out some subgroups and sensitivity analyses.
Statistical analysis
The study-specific adjusted RRs were used as common measure of association across studies. As absolute risk of cancer is relatively low, we assumed that estimates of ORs from case-control studies and risk, rate, or HRs from cohort studies were all valid estimates of the RR. Thus, we reported all results as the RR for simplicity [78]. The possible heterogeneity in results across studies was examined by using Cochran Q and quantified by I2 statistics [79]. In Q statistic analysis, a p-value less than 0.1 were considered statistically significant of heterogeneity. When substantial heterogeneity was detected, the summary estimate based on the random-effects model (DerSimonian and Laird method) was reported [80]. Otherwise, the summary estimate based on the fixed effects model (the inverse variance method) was reported [81]. We used these two effects models to calculate summary RRs and 95%CI for the highest versus lowest categories of dietary nitrate/nitrite intake for the analysis. Also, heterogeneity between subgroups was evaluated by meta-regression. Subgroup analyses were carried out based on the cancer subsites, study design (cohort, hospital-based case-control and population-based case-control studies), geographic area (Europe, America, and Asia), gender (men vs. women). We also stratified the meta-analysis by potentially important confounders (ie, BMI, vitamin C intake, and smoking status).
In a further analysis, we pooled risk estimates related to nitrate/nitrite and risk of cancer according to 10mg/0.5mg per day of dietary intake. We used generalized least squares for trend estimation as described by Orsini et al [82]. In dose-response analyses, for each study, the midpoint of dietary nitrate/nitrite intake in each category was assigned to the corresponding RR. When the lowest category was open-ended, the lower boundary was set to 0. When the highest category was open-ended, the length of the open-ended interval was assumed to be the same as that of the adjacent interval. Publication bias was evaluated using Egger’s linear regression [83] and Begg’s rank correlation methods [84], and funnel plots. A P value of <0.05 for the two aforementioned tests was considered representative of significant statistical publication bias. All data analyses were carried out using Stata software (version 11.0; StataCorp, College Station, TX). P values were 2-sided with a significance level of 0.05.
ACKNOWLEDGMENTS AND AUTHORSHIP
The authors’ responsibilities were as follows—L X, M M, and J Z: conceived and designed the research; L X, M M, and J Z: analyzed data; L X: wrote the paper; L X, M M, H-X J, F L, J Y and J Z: contributed to manuscript revisions; L X: had primary responsibility for the final content of the manuscript; and all authors: read, reviewed, and approved the final manuscript. The authors thank Dr. Qi-Jun Wu and Leon Jia for critical review.
CONFLICTS OF INTEREST
None of the authors have any conflicts of interest to declare.
REFERENCES
1. Bogovski P, Bogovski S. Animal Species in which N-nitroso compounds induce cancer. International Journal of Cancer. 1981; 27:471-474.
2. IARC monographs on the evaluation of the carcinogenic risk of chemicals to humans: some N-nitroso compounds. IARC Monogr Eval Carcinog Risk Chem Man. 1978; 17:1-349.
3. Tricker AR. N-nitroso compounds and man: sources of exposure, endogenous formation and occurrence in body fluids. European Journal of Cancer Prevention. 1997; 6:226-268.
4. Ward MH, DeKok TM, Levallois P, Brender J, Gulis G, Nolan BT, VanDerslice J. Workgroup report: Drinking-water nitrate and health--recent findings and research needs. Environmental Health Perspectives. 2005; 113:1607-1614.
5. Dellavalle CT, Xiao Q, Yang G, Shu XO, Aschebrook-Kilfoy B, Zheng W, Lan LH, Ji BT, Rothman N, Chow WH, Gao YT, Ward MH. Dietary nitrate and nitrite intake and risk of colorectal cancer in the Shanghai Women's Health Study. International Journal of Cancer. 2014; 134:2917-2926.
6. Keszei AP, Goldbohm RA, Schouten LJ, Jakszyn P, van den Brandt PA. Dietary N-nitroso compounds, endogenous nitrosation, and the risk of esophageal and gastric cancer subtypes in the Netherlands Cohort Study. The American Journal of Clinical Nutrition. 2013; 97:135-146.
7. Dellavalle CT, Daniel CR, Aschebrook-Kilfoy B, Hollenbeck AR, Cross AJ, Sinha R, Ward MH. Dietary intake of nitrate and nitrite and risk of renal cell carcinoma in the NIH-AARP Diet and Health Study. British Journal of Cancer. 2013; 108:205-212.
8. Aschebrook-Kilfoy B, Shu XO, Gao YT, Ji BT, Yang G, Li HL, Rothman N, Chow WH, Zheng W, Ward MH. Thyroid cancer risk and dietary nitrate and nitrite intake in the Shanghai women's health study. International Journal of Cancer. 2013; 132:897-904.
9. Inoue-Choi M, Ward MH, Cerhan JR, Weyer PJ, Anderson KE, Robien K. Interaction of nitrate and folate on the risk of breast cancer among postmenopausal women. Nutrition and Cancer. 2012; 64:685-694.
10. Aschebrook-Kilfoy B, Ward MH, Gierach GL, Schatzkin A, Hollenbeck AR, Sinha R, Cross AJ. Epithelial ovarian cancer and exposure to dietary nitrate and nitrite in the NIH-AARP Diet and Health Study. European Journal of Cancer Prevention. 2012; 21:65-72.
11. Loh YH, Jakszyn P, Luben RN, Mulligan AA, Mitrou PN, Khaw KT. N-Nitroso compounds and cancer incidence: the European Prospective Investigation into Cancer and Nutrition (EPIC)-Norfolk Study. The American Journal of Clinical Nutrition. 2011; 93:1053-1061.
12. Kilfoy BA, Zhang Y, Park Y, Holford TR, Schatzkin A, Hollenbeck A, Ward MH. Dietary nitrate and nitrite and the risk of thyroid cancer in the NIH-AARP Diet and Health Study. International Journal of Cancer. 2011; 129:160-172.
13. Cross AJ, Freedman ND, Ren J, Ward MH, Hollenbeck AR, Schatzkin A, Sinha R, Abnet CC. Meat consumption and risk of esophageal and gastric cancer in a large prospective study. The American Journal of Gastroenterology. 2011; 106:432-442.
14. Aschebrook-Kilfoy B, Cross AJ, Stolzenberg-Solomon RZ, Schatzkin A, Hollenbeck AR, Sinha R, Ward MH. Pancreatic cancer and exposure to dietary nitrate and nitrite in the NIH-AARP Diet and Health Study. American Journal of Epidemiology. 2011; 174:305-315.
15. Ward MH, Kilfoy BA, Weyer PJ, Anderson KE, Folsom AR, Cerhan JR. Nitrate intake and the risk of thyroid cancer and thyroid disease. Epidemiology. 2010; 21:389-395.
16. Freedman ND, Cross AJ, McGlynn KA, Abnet CC, Park Y, Hollenbeck AR, Schatzkin A, Everhart JE, Sinha R. Association of meat and fat intake with liver disease and hepatocellular carcinoma in the NIH-AARP cohort. Journal of the National Cancer Institute. 2010; 102:1354-1365.
17. Ferrucci LM, Sinha R, Ward MH, Graubard BI, Hollenbeck AR, Kilfoy BA, Schatzkin A, Michaud DS, Cross AJ. Meat and components of meat and the risk of bladder cancer in the NIH-AARP Diet and Health Study. Cancer. 2010; 116:4345-4353.
18. Dubrow R, Darefsky AS, Park Y, Mayne ST, Moore SC, Kilfoy B, Cross AJ, Sinha R, Hollenbeck AR, Schatzkin A, Ward MH. Dietary components related to N-nitroso compound formation: a prospective study of adult glioma. Cancer Epidemiol Biomarkers Prevention. 2010; 19:1709-1722.
19. Cross AJ, Ferrucci LM, Risch A, Graubard BI, Ward MH, Park Y, Hollenbeck AR, Schatzkin A, Sinha R. A large prospective study of meat consumption and colorectal cancer risk: an investigation of potential mechanisms underlying this association. Cancer Research. 2010; 70:2406-2414.
20. Sinha R, Park Y, Graubard BI, Leitzmann MF, Hollenbeck A, Schatzkin A, Cross AJ. Meat and meat-related compounds and risk of prostate cancer in a large prospective cohort study in the United States. American Journal of Epidemiology. 2009; 170:1165-1177.
21. Michaud DS, Holick CN, Batchelor TT, Giovannucci E, Hunter DJ. Prospective study of meat intake and dietary nitrates, nitrites, and nitrosamines and risk of adult glioma. The American Journal of Clinical Nutrition. 2009; 90:570-577.
22. Zeegers MP, Selen RF, Kleinjans JC, Goldbohm RA, van den Brandt PA. Nitrate intake does not influence bladder cancer risk: the Netherlands cohort study. Environmental Health Perspectives. 2006; 114:1527-1531.
23. Weyer PJ, Cerhan JR, Kross BC, Hallberg GR, Kantamneni J, Breuer G, Jones MP, Zheng W, Lynch CF. Municipal drinking water nitrate level and cancer risk in older women: the Iowa Women's Health Study. Epidemiology. 2001; 12:327-338.
24. Knekt P, Jarvinen R, Dich J, Hakulinen T. Risk of colorectal and other gastro-intestinal cancers after exposure to nitrate, nitrite and N-nitroso compounds: a follow-up study. International Journal of Cancer. 1999; 80:852-856.
25. van Loon AJ, Botterweck AA, Goldbohm RA, Brants HA, van Klaveren JD, van den Brandt PA. Intake of nitrate and nitrite and the risk of gastric cancer: a prospective cohort study. British Journal of Cancer. 1998; 78:129-135.
26. Galanis DJ, Kolonel LN, Lee J, Nomura A. Intakes of selected foods and beverages and the incidence of gastric cancer among the Japanese residents of Hawaii: a prospective study. International Journal of Epidemiology. 1998; 27:173-180.
27. Inoue Choi M, Sinha R, Gierach GL, Ward MH. Red and processed meat, nitrite, and heme iron intakes and postmenopausal breast cancer risk in the NIH-AARP Diet and Health Study. International Journal of Cancer. 2016; 138:1609-1618.
28. Inoue-Choi M, Jones RR, Anderson KE, Cantor KP, Cerhan JR, Krasner S, Robien K, Weyer PJ, Ward MH. Nitrate and nitrite ingestion and risk of ovarian cancer among postmenopausal women in Iowa. International Journal of Cancer. 2015; 137:173-182.
29. Risch HA, Jain M, Choi NW, Fodor JG, Pfeiffer CJ, Howe GR, Harrison LW, Craib KJ, Miller AB. Dietary factors and the incidence of cancer of the stomach. American Journal of Epidemiology. 1985; 122:947-959.
30. Buiatti E, Palli D, Decarli A, Amadori D, Avellini C, Bianchi S, Bonaguri C, Cipriani F, Cocco P, Giacosa A, Et A. A case-control study of gastric cancer and diet in Italy: II. Association with nutrients. International Journal of Cancer. 1990; 45:896-901.
31. Boeing H, Schlehofer B, Blettner M, Wahrendorf J. Dietary carcinogens and the risk for glioma and meningioma in Germany. International Journal of Cancer. 1993; 53:561-565.
32. Giles GG, McNeil JJ, Donnan G, Webley C, Staples MP, Ireland PD, Hurley SF, Salzberg M. Dietary factors and the risk of glioma in adults: results of a case-control study in Melbourne, Australia. International Journal of Cancer. 1994; 59:357-362.
33. Hansson LE, Nyren O, Bergstrom R, Wolk A, Lindgren A, Baron J, Adami HO. Nutrients and gastric cancer risk. A population-based case-control study in Sweden. International Journal of Cancer. 1994; 57:638-644.
34. Rogers MA, Vaughan TL, Davis S, Thomas DB. Consumption of nitrate, nitrite, and nitrosodimethylamine and the risk of upper aerodigestive tract cancer. Cancer Epidemiol Biomarkers Prevention. 1995; 4:29-36.
35. Ward MH, Mark SD, Cantor KP, Weisenburger DD, Correa-Villasenor A, Zahm SH. Drinking water nitrate and the risk of non-Hodgkin's lymphoma. Epidemiology. 1996; 7:465-471.
36. Wilkens LR, Kadir MM, Kolonel LN, Nomura AM, Hankin JH. Risk factors for lower urinary tract cancer: the role of total fluid consumption, nitrites and nitrosamines, and selected foods. Cancer Epidemiol Biomarkers Prevention. 1996; 5:161-166.
37. Rosenblatt KA, Thomas DB, Jimenez LM, Fish B, McTiernan A, Stalsberg H, Stemhagen A, Thompson WD, Curnen MG, Satariano W, Austin DF, Greenberg RS, Key C, Kolonel LN, West DW. The relationship between diet and breast cancer in men (United States). Cancer Causes Control. 1999; 10:107-113.
38. Palli D, Russo A, Decarli A. Dietary patterns, nutrient intake and gastric cancer in a high-risk area of Italy. Cancer Causes Control. 2001; 12:163-172.
39. Mayne ST, Risch HA, Dubrow R, Chow WH, Gammon MD, Vaughan TL, Farrow DC, Schoenberg JB, Stanford JL, Ahsan H, West AB, Rotterdam H, Blot WJ, Fraumeni JJ. Nutrient intake and risk of subtypes of esophageal and gastric cancer. Cancer Epidemiol Biomarkers Prevention. 2001; 10:1055-1062.
40. Chen H, Ward MH, Tucker KL, Graubard BI, McComb RD, Potischman NA, Weisenburger DD, Heineman EF. Diet and risk of adult glioma in eastern Nebraska, United States. Cancer Causes Control. 2002; 13:647-655.
41. Ward MH, Cantor KP, Riley D, Merkle S, Lynch CF. Nitrate in public water supplies and risk of bladder cancer. Epidemiology. 2003; 14:183-190.
42. De Roos AJ, Ward MH, Lynch CF, Cantor KP. Nitrate in public water supplies and the risk of colon and rectum cancers. Epidemiology. 2003; 14:640-649.
43. Coss A, Cantor KP, Reif JS, Lynch CF, Ward MH. Pancreatic cancer and drinking water and dietary sources of nitrate and nitrite. American Journal of Epidemiology. 2004; 159:693-701.
44. Ward MH, Heineman EF, McComb RD, Weisenburger DD. Drinking water and dietary sources of nitrate and nitrite and risk of glioma. Journal of Occupational and Environmental Medicine. 2005; 47:1260-1267.
45. Ward MH, Cerhan JR, Colt JS, Hartge P. Risk of non-Hodgkin lymphoma and nitrate and nitrite from drinking water and diet. Epidemiology. 2006; 17:375-382.
46. Ward MH, Rusiecki JA, Lynch CF, Cantor KP. Nitrate in public water supplies and the risk of renal cell carcinoma. Cancer Causes Control. 2007; 18:1141-1151.
47. Ward MH, Heineman EF, Markin RS, Weisenburger DD. Adenocarcinoma of the stomach and esophagus and drinking water and dietary sources of nitrate and nitrite. International Journal of Occupational and Environmental Health. 2008; 14:193-197.
48. Chiu BC, Dave BJ, Ward MH, Fought AJ, Hou L, Jain S, Gapstur S, Evens AM, Zahm SH, Blair A, Weisenburger DD. Dietary factors and risk of t(14;18)-defined subgroups of non-Hodgkin lymphoma. Cancer Causes Control. 2008; 19:859-867.
49. Hernandez-Ramirez RU, Galvan-Portillo MV, Ward MH, Agudo A, Gonzalez CA, Onate-Ocana LF, Herrera-Goepfert R, Palma-Coca O, Lopez-Carrillo L. Dietary intake of polyphenols, nitrate and nitrite and gastric cancer risk in Mexico City. International Journal of Cancer. 2009; 125:1424-1430.
50. Kilfoy BA, Ward MH, Zheng T, Holford TR, Boyle P, Zhao P, Dai M, Leaderer B, Zhang Y. Risk of non-Hodgkin lymphoma and nitrate and nitrite from the diet in Connecticut women. Cancer Causes Control. 2010; 21:889-896.
51. Navarro SS, Mayne ST, Risch HA, Gammon MD, Vaughan T, Chow WH, Dubin JA, Dubrow R, Schoenberg J, Stanford JL, West AB, Rotterdam H, Blot WJ. Principal component analysis of dietary and lifestyle patterns in relation to risk of subtypes of esophageal and gastric cancer. Annals of Epidemiology. 2011; 21:543-550.
52. Aschebrook-Kilfoy B, Ward MH, Dave BJ, Smith SM, Weisenburger DD, Chiu BC. Dietary nitrate and nitrite intake and risk of non-Hodgkin lymphoma. Leuk Lymphoma. 2013; 54:945-950.
53. Zhu Y, Wang PP, Zhao J, Green R, Sun Z, Roebothan B, Squires J, Buehler S, Dicks E, Zhao J, Cotterchio M, Campbell PT, Jain M, Parfrey PS, Mclaughlin JR. Dietary N-nitroso compounds and risk of colorectal cancer: a case-control study in Newfoundland and Labrador and Ontario, Canada. British Journal of Nutrition. 2014; 111:1109-1117.
54. Catsburg CE, Gago-Dominguez M, Yuan JM, Castelao JE, Cortessis VK, Pike MC, Stern MC. Dietary sources of N-nitroso compounds and bladder cancer risk: findings from the Los Angeles bladder cancer study. International Journal of Cancer. 2014; 134:125-135.
55. Barbone F, Austin H, Partridge EE. Diet and endometrial cancer: a case-control study. American Journal of Epidemiology. 1993; 137:393-403.
56. La Vecchia C, Ferraroni M, D'Avanzo B, Decarli A, Franceschi S. Selected micronutrient intake and the risk of gastric cancer. Cancer Epidemiol Biomarkers Prevention. 1994; 3:393-398.
57. Pobel D, Riboli E, Cornee J, Hemon B, Guyader M. Nitrosamine, nitrate and nitrite in relation to gastric cancer: a case-control study in Marseille, France. European Journal of Epidemiology. 1995; 11:67-73.
58. La Vecchia C, Negri E, Franceschi S, Decarli A. Case-control study on influence of methionine, nitrite, and salt on gastric carcinogenesis in northern Italy. Nutrition and Cancer. 1997; 27:65-68.
59. De Stefani E, Boffetta P, Mendilaharsu M, Carzoglio J, Deneo-Pellegrini H. Dietary nitrosamines, heterocyclic amines, and risk of gastric cancer: a case-control study in Uruguay. Nutrition and Cancer. 1998; 30:158-162.
60. Ward MH, Pan WH, Cheng YJ, Li FH, Brinton LA, Chen CJ, Hsu MM, Chen IH, Levine PH, Yang CS, Hildesheim A. Dietary exposure to nitrite and nitrosamines and risk of nasopharyngeal carcinoma in Taiwan. International Journal of Cancer. 2000; 86:603-609.
61. Kim HJ, Lee SS, Choi BY, Kim MK. Nitrate intake relative to antioxidant vitamin intake affects gastric cancer risk: a case-control study in Korea. Nutrition and Cancer. 2007; 59:185-191.
62. Yang YJ, Hwang SH, Kim HJ, Nam SJ, Kong G, Kim MK. Dietary intake of nitrate relative to antioxidant vitamin in relation to breast cancer risk: a case-control study. Nutrition and Cancer. 2010; 62:555-566.
63. Boeing H, Frentzel Beyme R, Berger M, Berndt V, Göres W, Körner M, Lohmeier R, Menarcher A, Männl H, Meinhardt M. Case-control study on stomach cancer in Germany. International Journal of Cancer. 1991; 47:858-864.
64. De Stefani E, Ronco A, Brennan P, Boffetta P. Meat consumption and risk of stomach cancer in Uruguay: a case-control study. Nutrition and cancer. 2001; 40:103-107.
65. Engel LS, Chow WH, Vaughan TL, Gammon MD, Risch HA, Stanford JL, Schoenberg JB, Mayne ST, Dubrow R, Rotterdam H. Population attributable risks of esophageal and gastric cancers. Journal of the National Cancer Institute. 2003; 95:1404-1413.
66. López-Carrillo L, Torres-López J, Galván-Portillo M, Muñoz L, López-Cervantes M. Helicobacter pylori-CagA seropositivity and nitrite and ascorbic acid food intake as predictors for gastric cancer. European Journal of Cancer. 2004; 40:1752-1759.
67. McKnight GM, Duncan CW, Leifert C, Golden MH. Dietary nitrate in man: friend or foe? British Journal of Nutrition. 1999; 81:349-358.
68. Mirvish SS. Effects of vitamins C and E on N-nitroso compound formation, carcinogenesis, and cancer. Cancer. 1986; 58:1842-1850.
69. Kalus WH, Filby WG. Inhibition of nitrosamine formation by ascorbic acid: participation of free radicals in its anaerobic reaction with nitrite. Experientia. 1980; 36:147-149.
70. International Agency for Research on Cancer. IARC monographs on the evaluation of carcinogenic risks to humans. Ingested nitrate and nitrite, and cyanobacterial peptide toxins. Vol 94. Lyon, France: IARC, 2010.
71. Grosse Y, Baan R, Straif K, Secretan B, El GF, Cogliano V. Carcinogenicity of nitrate, nitrite, and cyanobacterial peptide toxins. Lancet Oncology. 2006; 7:628-629.
72. Mirvish SS, Wallcave L, Eagen M, Shubik P. Ascorbate-nitrite reaction: possible means of blocking the formation of carcinogenic N-nitroso compounds. Science. 1972; 177:65-68.
73. Stroup DF, Berlin JA, Morton SC, Olkin I, Williamson GD, Rennie D, Moher D, Becker BJ, Sipe TA, Thacker SB. Meta-analysis of observational studies in epidemiology: a proposal for reporting. Meta-analysis Of Observational Studies in Epidemiology (MOOSE) group. The Journal of the American Medical Association. 2000; 283:2008-2012.
74. Moher D, Liberati A, Tetzlaff J, Altman DG. Preferred reporting items for systematic reviews and meta-analyses: the PRISMA statement. British Medical Journal. 2009; 339:b2535.
75. Wells GA, Shea B, O’Connell D, Peterson J, Welch V, Losos M, Tugwell P. The Newcastle-Ottawa Scale (NOS) for assessing the quality of nonrandomised studies in meta-analyses. Available from: http://www.ohri.ca/programs/clinical_epidemiology/oxford.asp (cited 3 May 2013).
76. Juni P, Witschi A, Bloch R, Egger M. The hazards of scoring the quality of clinical trials for meta-analysis. The Journal of the American Medical Association. 1999; 282:1054-1060.
77. Greenland S. Invited commentary: a critical look at some popular meta-analytic methods. American Journal of Epidemiology. 1994; 140:290-296.
78. Greenland S. Quantitative methods in the review of epidemiologic literature. Epidemiologic Reviews. 1987; 9:1-30.
79. Higgins JP, Thompson SG. Quantifying heterogeneity in a meta-analysis. Statistics in Medicine. 2002; 21:1539-1558.
80. DerSimonian R, Laird N. Meta-analysis in clinical trials. Controlled Clinical Trials. 1986; 7:177-188.
81. WOOLF B. On estimating the relation between blood group and disease. Annals of Human Genetics. 1955; 19:251-253.
82. Orsini N, Li R, Wolk A, Khudyakov P, Spiegelman D. Meta-analysis for linear and nonlinear dose-response relations: examples, an evaluation of approximations, and software. American Journal of Epidemiology. 2012; 175:66-73.
83. Egger M, Davey SG, Schneider M, Minder C. Bias in meta-analysis detected by a simple, graphical test. British Medical Journal. 1997; 315:629-634.
84. Begg CB, Mazumdar M. Operating characteristics of a rank correlation test for publication bias. Biometrics. 1994; 50:1088-1101.