
INTRODUCTION
Cancer is multifactorial in its etiology and multistep in its evolution [1]. Glioblastoma multiforme (GBM), the most common form of primary brain tumor, is an aggressive cancer that causes high mortality and morbidity. GBM currently remains one of the most difficult cancers to treat, with less than a 5% 5-yr survival rate, despite multi-modality therapies including surgery, radiation therapy, and chemotherapy [2]. This is potentially due to a lack of well-defined understanding of the mechanism(s) underlying GBM’s complex heterogeneity, plasticity and therapy resistance. Since their discovery and initial characterization in 1994, research on cancer stem cells has intensified, providing convincing evidence that these unique cells are major contributors to cancer growth, progression, tumor heterogeneity and resistance to therapeutic intervention [3]. The concept that cancer is comprised of nearly homogenous, ectopically growing cells has been replaced with a more complex heterogeneous model in which cancer cells have varied potential to metastasize, interact with the stroma and regrow after therapy (relapse) [3-6]. Gliomas are organized as cellular hierarchies that are generated from and maintained by subpopulations of self-renewing glioma stem cells (GSCs) [6-9]. These subpopulations of cancer stem cells display high tumorigenic potential and stemness properties and have been isolated from cancer patients with various types of tumors [9]. The current consensus is that tumors comprised of cells with stem-like characteristics portend a poorer prognosis, which have important clinical implications for cancer diagnosis and treatment [6-12]. Presence of a high proportion of GSCs also permits stratification of patients into a high metastatic risk group and represents an important area of clinical investigation [8].
Isolation of stem cells from different normal and cancerous tissues has been facilitated by the identification of specific cell surface markers. Recently, two mutually exclusive GSC subtypes: pro-neural and mesenchymal, were identified and characterized with distinct dysregulated signaling pathways [13]. CD133/ Prominin-1 is an established and broadly accepted pro-neural GBM stem cell marker [9, 13, 14] that is also shared with other cancer stem cells from melanoma, prostate, pancreatic, liver, colon, lung, and ovarian cancers [3]. Recently, the importance of CD44 has been recognized as a marker of mesenchymal GBM stem cells [13], as well as prostate and breast cancer stem cells [3, 11].
In addition to cell surface markers, several pathways and molecules that control self-renewal and differentiation of cancer stem cells and normal stem cells have been identified including p-STAT3, NOTCH, C-Myc, NANOG, OCT4, SOX2 and others [3, 15, 16]. These regulators of stemness also influence tumorigenesis and tumor progression [17]. NOTCH and STAT3 signaling play critical roles in stem cell fate determination. OCT4, SOX2, and NANOG are central transcriptional regulators of stemness, establishing an interconnected autoregulatory network to sustain cell pluripotency and self-renewal [15]. NOTCH1, SOX2, and CD133 are known to regulate the pro-neural GSC subtype, whereas CD44 is believed to regulate the mesenchymal GSC subtype [13]. Moreover, many aggressive cancers that result in poor patient survival show higher expression of these stemness genes [18, 19]. Despite clinical significance, effective/selective targeting strategies for cancer stem cells, including GSCs, do not currently exist [20].
MDA-9/Syntenin (SDCBP) is a scaffold protein that interacts with a remarkable repertoire of key regulatory proteins, including SRC, FAK and EGFR, which are often related to expression of the tumor phenotype and cancer progression [21, 22]. MDA-9 is a diagnostic marker of tumor aggression and grade in gliomas [23], melanomas [24, 25], and breast cancer [26]. Based on these observations, we hypothesized that higher tumor grade, which correlates with a more invasive and metastatic phenotype, might consist of an increased proportion of GSCs that would express elevated levels of MDA-9. GSCs are major contributors to cancer progression [9] and MDA-9 plays a seminal role in the progression of several cancer types including glioma [21-26]. Accordingly, we currently assessed the association between stemness and MDA-9 expression in GBM, as well as in normal astrocytes. Stemness is defined as the ability of stem cells to self-renew and differentiate [27]. We studied this property using sphere formation assays, cell-surface based stem population assessment, monitoring genes regulating self-renewal, and tumorigenicity. Additionally, the influence of MDA-9 on GSC survival, growth, angiogenesis and chemoresistance was also examined. Finally, we dissected the mechanisms contributing to MDA-9-mediated stem phenotypes and survival. Our studies now demonstrate for the first time that MDA-9 promotes glioma stem cell phenotypes and survival through regulation of NOTCH1, C-Myc, STAT3 and Nanog in GSCs.
RESULTS
mda-9 regulates stemness in normal astrocytes and glioma cells
A positive correlation between mda-9 expression and stemness was evident in GBM (Figure 1A, 1B and Figure S1A). Forty-eight patient samples were assayed for c-myc, CD133, Nanog and mda-9 expression (Figure 1A, Figure S1A). Data was normalized to 18S and beta tubulin expression and analyzed statistically by multiple regression analysis. The results were statistically significant (R2 = 0.743, p < 0.05), and a positive correlation was observed between mda-9 and myc (R = 0.705), Nanog (R = 0.574) and CD133 (R = 0.505) expression (Figure 1A). Considering these observations, we assayed control and mda-9 knockdown (kd) (shmda-9) GSCs from a clinical GBM sample (VG2) using a cancer stem cell array (Human Cancer Stem Cells RT2 Profiler PCR array, Qiagen/Sabiosciences) (Figure 1B). Eighty-four genes were examined, and kd of mda-9 significantly affected a spectrum of pluripotency genes and the STAT3 pathway. The genes most affected by mda-9 kd in GSCs (downregulated a minimum of ~4-fold by selecting the statistical boundary for Log10shmda-9 del del CT/ Log10shcon del del CT as 4) were ALDH1A1, AXL, CD44, DDR1, DKK1, ID1, ITGB1, MYC, NANOG, OCT4/POU5F1, SOX2 and STAT3 (Figure 1B). All of these genes, except for DKK1, promote stemness. Additionally, AXL is an important target for chemoresistance [28]. An increase in mda-9 expression was also evident in GSCs > non-stem glioma cells (NSGCs) > normal stem cells (SCs) (Figure 2A).
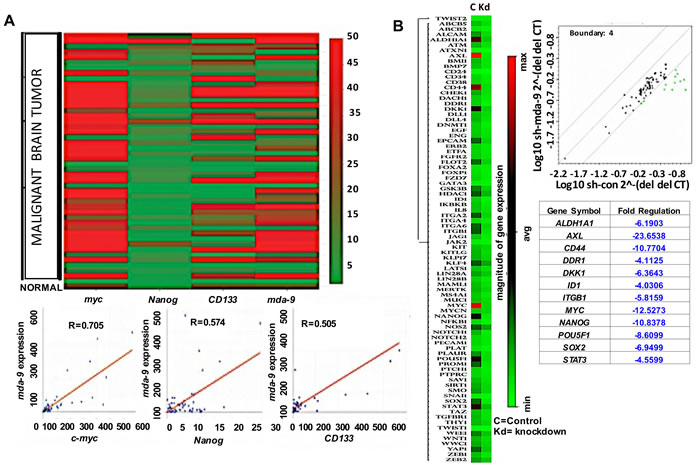
Figure 1: mda-9 expression correlates with stemness markers in clinical samples A. Clinical array data confirms a strong correlation between expression of mda-9 with the stemness markers c-myc, Nanog and CD133. B. GSC array data demonstrates dramatic downregulation of stem cell markers in mda-9 knockdown (kd) GSCs. See also Figure S1.
mda-9 mRNA levels were quantified in different stem and non-stem cell populations of gliomas, from both cell lines and clinical samples. In all samples, increased mda-9 expression was observed in stem vs. non-stem populations (Table 1). mda-9 expression in non-stem U-1242 cells, NSGCs, was ~35-fold greater than in primary adult human astrocyte (HA) SCs (Figure 2A, top right panel). Additionally, the expression of mda-9 in U-1242 GSCs was double that of U-1242 NSGCs (Figure 2A, top right panel). Since GSCs expressed higher levels of stemness genes than corresponding non-stem cells, we examined the relationship between mda-9 expression and stemness in GSCs vs. NSGCs. Elevated mda-9 expression directly correlated with stemness (Table 1), i.e., mda-9:Nanog (Pearson’s correlation coefficient R = 0.838, coefficient of determination R2 = 0.7034), mda-9:Sox2 (R = 0.968, R2 = 0.937), mda-9:Oct4 (R = 0.836, R2 = 0.698) and mda-9:c-myc (R = 0.954, R2 = 0.911).
Forced mda-9 overexpression in normal human astrocytes led to a significant increase in spheroid size (Figure 2A, top left panel), stem populations (Figure 2A bottom left panel), self-renewal and pluripotency (Figure 2A bottom right panel, Figure S1B) as reflected by assessment of putative GSC and NSGC populations as well as changes in genes involved in self-renewal. No change in tumorigenicity was observed, when assayed by mice xenograft studies (data not shown). Overexpression of MDA-9 in NSGCs, significantly increased the stem population and expression of canonical stem regulatory genes (Figure 2B, 2C). Even though NSGC populations had elevated expression of mda-9, the GSC populations had significantly higher expression than the corresponding normal brain (Figure 2A, top right panel). To further confirm that MDA-9 regulates stem regulatory genes mda-9 was suppressed by kd in GBM (cell line and clinical samples). Silencing of mda-9 significantly decreased the recognized stem regulatory genes, and markers (Table 2). Overall, Nanog was decreased by ~33-, ~25- and ~11-fold, Oct4 by ~7-, ~12- and ~2-fold, and Sox2 by ~10-, ~7- and ~4-fold in the mda-9 kd GSCs from VG2, VG9, and U-1242, respectively. Silencing of mda-9 also resulted in significant loss of self-renewal (Figure S1B) as defined by the self-renewal assays. In total, these data support the hypothesis that mda-9 can regulate stemness in both normal astrocyte stem cells and GSCs.
Table 1: Expression of mda-9 and stemness genes in non-stem glioma cells (NSGCs) and glioma stem cells (GSCs).
CELL LINE/SAMPLE |
VG2 |
VG9 |
U-1242 |
|||
GENES |
Non-stem glioma cell |
Glioma stem cell |
Non-stem glioma cell |
Glioma stem cell |
Non-stem glioma cell |
Glioma stem cell |
mda-9 |
1±0.04 |
6.7±1.20 |
1±0.20 |
5.2±0.44 |
1±0.03 |
10.4±0.12 |
Stemness Nanog Sox2 Oct4 c-myc |
||||||
1±0.20 |
15.7±0.46 |
1±0.05 |
11.5±0.79 |
1±0.07 |
11.2±2.20 |
|
1±0.07 |
2.0±0.70 |
1±0.03 |
2.0±0.82 |
1±0.48 |
1.8±0.08 |
|
1±0.09 |
19.8±2.70 |
1±0.31 |
15.6±1.54 |
1±0.90 |
5.5±0.25 |
|
1±0.42 |
9.1±0.81 |
1±0.02 |
8.7±0.05 |
1±0.10 |
10.3±1.03 |
|
Notch1 |
1±0.06 |
4.1±0.15 |
1±0.10 |
3.5±0.03 |
1±0.61 |
3.7±0.19 |
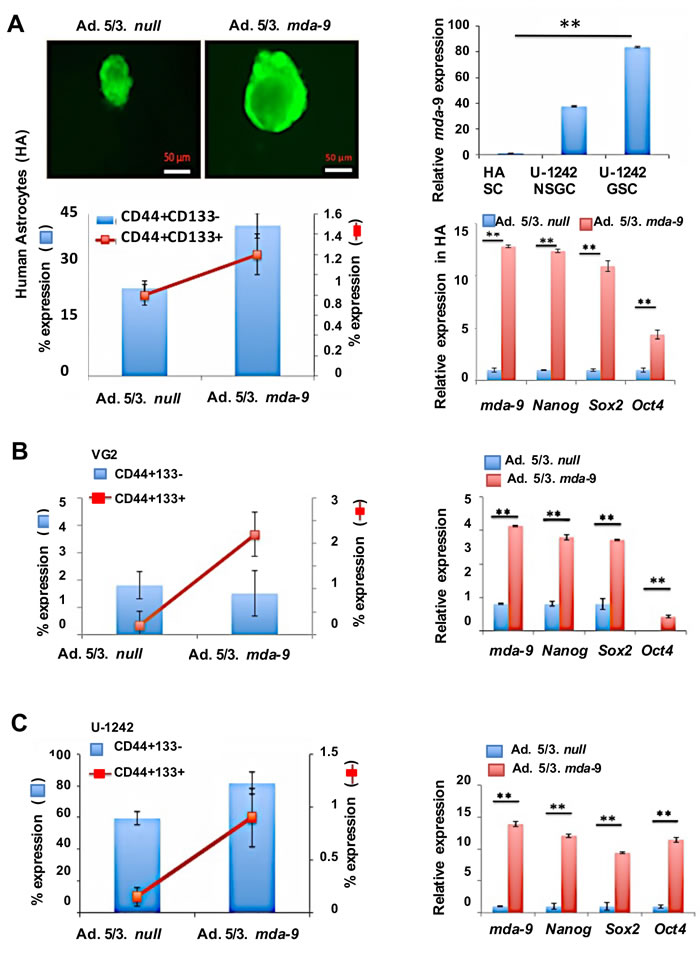
Figure 2: Overexpression of mda-9 enhances stemness markers in normal astrocyte stem cells and GSCs. A. Left upper panel, live image analysis of human primary astrocyte (HA) stem cell neurospheres. Left lower panel, FACS analysis of stem cell (SC) markers in null vector- and mda-9-overexpressing HA neurospheres. Right upper panel, mda-9 expression in HA stem cells as compared to U-1242 NSGCs (non stem glioma cells) and GSCs (stem cells). Right lower panel, overexpression of mda-9 significantly enhances several stem cell markers in HA cells. B. FACS (left) and RT-PCR (right) analysis of stem cell (SC) markers and stemness genes in null vector and mda-9-overexpressing VG2 non stem glioma cells. C. FACS (left) and RT-PCR (right) analysis of stem cell (SC) markers and stemness genes in null vector and mda-9-overexpressing U-1242 non stem glioma cells. Relative expression indicates fold-change in expression. Bars represent SEM. *P < 0.05, **P < 0.01 using student t-test and ANOVA. SCs = stem cells. See also Figure S2, Table 1, and 2.
mda-9 influences self-renewal through STAT3
STAT3 is indispensable for the regulation of self-renewal in human stem cells including GSCs [18, 29, 30]. Considering this seminal role of STAT3, we investigated the effect of mda-9 expression on STAT3. Kd of mda-9 significantly decreased the expression of p-STAT3 (Figure 3A; Figure S2). p-STAT3 expression was decreased ~2-4-fold overall in shmda-9 cells (32.0 ± 6.3% decrease in VG2; 12.1 ± 3.9% decrease in VG9; 40.0 ± 6.0% decrease in U-1242). To further confirm our hypothesis, we overexpressed mda-9 in primary human astrocytes and found that mda-9 overexpression led to a significant increase in p-STAT3 (Figure S2). The effects of mda-9 silencing were significantly attenuated by overexpressing a constitutively active STAT3 (A662C/N664C; CA STAT3) (Figure 3B and 3C). Since active SRC positively regulates STAT3 [31], we overexpressed constitutively active SRC (Y529F; CA Src) and once again observed significant recovery of STAT3 function in the shmda-9 cells (Figure 3C). However, overexpression of a non constitutively-active SRC (NCA Src) failed to enhance STAT3 rescue function in the shmda-9 GSCs (Figure S3). Since STAT3 is also regulated by p44/42 and IGF-1R [32, 33], we also measured the expression of these proteins in control and shmda-9 GSCs. We observed some decrease in p44/42, a significant decrease in phospho-p44/42 (31.4 ± 6.2% decrease in VG2; 62.0 ± 7.9% decrease in VG9; 9.5 ± 2.7% decrease in U-1242) (Figure 4A; Figure S2), and IGF-1R in the shmda-9 cells (Figure 4B, ~2 and ~3-fold in VG2 and U-1242, respectively).
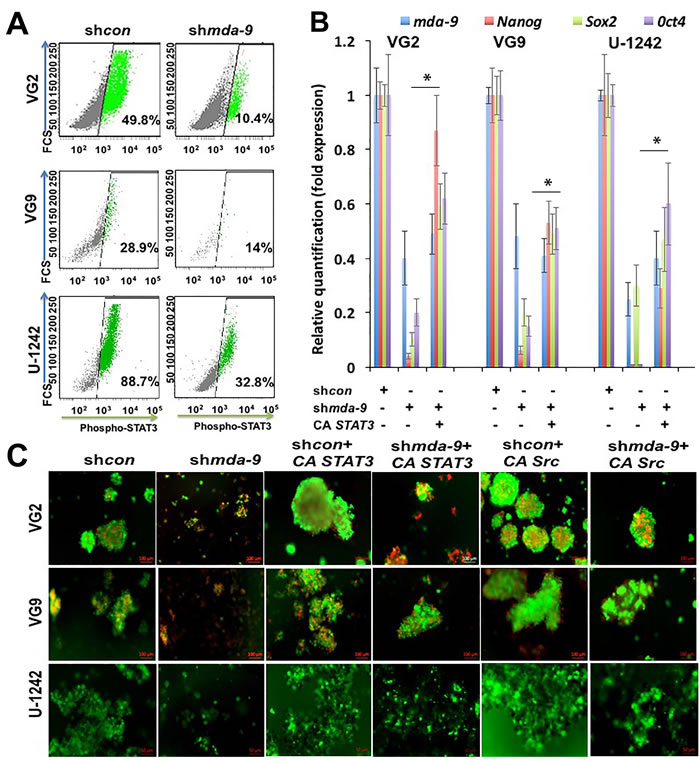
Figure 3: STAT3 activation is downstream of mda-9. A. Flow cytometry analysis of p-STAT3 in control and mda-9 kd GSCs from clinical GBM (VG2, VG9) and the GBM cell line U-1242. B. RT-PCR analysis for expression of mda-9 and stemness genes in shcon, mda-9 kd, and mda-9 kd cells overexpressing constitutively active (CA) STAT3. Relative expression indicates fold change in expression. C. Image analysis of shcon, mda-9 kd (shmda-9) and shcon or mda-9 kd cells overexpressing constitutively active (CA) STAT3 or CA Src; live cells are green, dead cells are red, *P < 0.05, using student t-test and ANOVA. * indicates significance between shmda-9 and shmda-9 + CA STAT3 groups. See also Figure S2 and Figure S3.
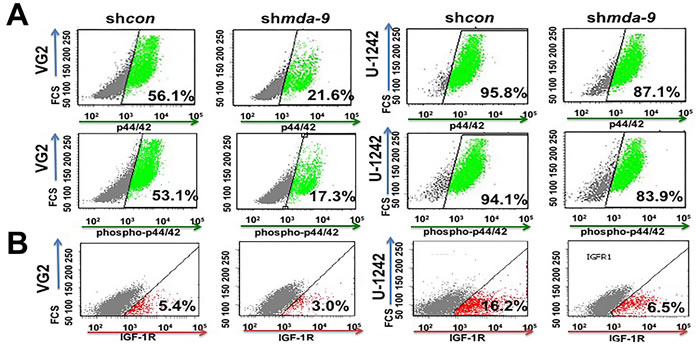
Figure 4: mda-9 indirectly regulates STAT3 activity. A. Flow cytometry analysis of p44/42, phosphor-p44/42 and B. IGF-1R in shcon and mda-9 kd GSCs from GBM clinical samples, and cell line. See also Figure S2.
MDA-9 regulates stem cell survival and intracranial GSC growth
mda-9 kd increased apoptotic cell death in GSCs (Figure 5A). The population of apoptotic cells in shmda-9 GSCs was 38 ± 3.3 %, 36 ± 5.1 % and 45 ± 4.9 % (in VG2, VG9 and U-1242, respectively) after 72 hours, which was ~5-fold of that observed in shcon GSCs. Suppression of mda-9 also resulted in a significant loss in GSC tumorigenicity and an increase in mouse survival in vivo (Figure 5B, 5C, 5D; p < 0.05). The control mice showed spongioblastic tumors with rhythmic palisades, a constant feature of aggressive high grade glioblastoma. Tumors in mice injected with shmda-9 GSCs were extremely small, and did not display the distinguishing aggressive spongioblastic pattern (Figure 5C).
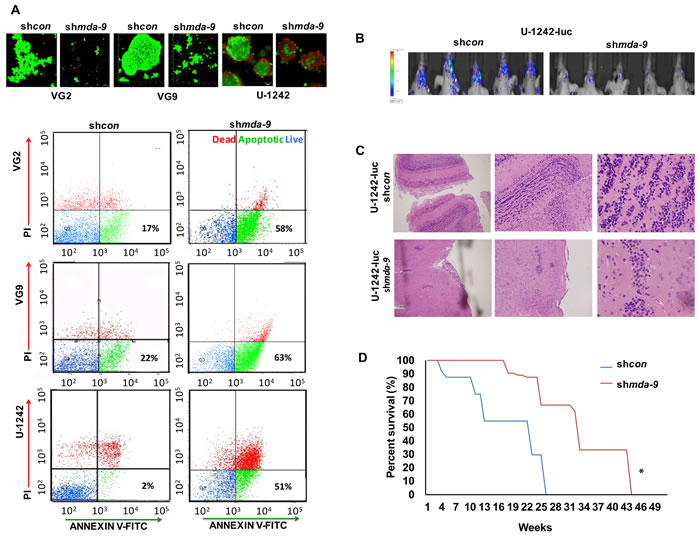
Figure 5: Suppression of mda-9 expression decreases GSC viability, tumorigenesis and enhances mouse survival. A. upper panel: Live/dead fluorescent images in GBM clinical samples (VG2, VG9; live cells are green, dead cells are red) and cell line (U-1242), lower panel: flow cytometry analyses in GSCs show increased percentage of cell death and apoptosis caused by kd of mda-9. B. Bioluminescent imaging (BLI) of intracranial GBM, shows intense luciferase activities in mice with shcon U-1242-Luc as compared to the mda-9 kd U-1242-Luc group (n = 10). C. Images of H&E staining of tissue collected from shcon and shmda-9 intracranial orthotopic brain tumors at 40, 100, and 400x magnification. D. Survival analysis of mice plotted over time showing the cumulative effect of mda-9 kd in GSCs. Knocking down mda-9 increased survival time (p = 0.04, log rank test) relative to control. *p < 0.05.
MDA-9 regulates GSC survival through NOTCH1 signaling
NOTCH1 expression was decreased 6.9 ± 0.5, 2.1 ± 0.6, and 16.5 ± 2.3-fold following kd of mda-9 in VG2, VG9 and U-1242 GSCs, respectively (Figure 6A; Figure S2). Decreased mda-9 expression led to NOTCH1 degradation through increased expression of NUMB (1.3 ± 0.7, 4.8 ± 0.4, 2 ± 0.5-fold increase, respectively) and decreased p-SRC expression (2 ± 0.9, 15.8 ± 1.2, 5.5 ± 0.4-fold decrease in relative expression, respectively) in VG2, VG9, and U-1242 GSCs (Figure 6B). mda-9 kd also caused a loss of NOTCH1 activation (~7-fold in VG2, ~2.6-fold in VG9, and ~19-fold in U1242) as well as ~27- (VG2), ~6- (VG9) and ~2- (U-1242) fold reduction of DLL1 (Figure 6A). Blocking NOTCH1 recapitulated the phenotype observed with mda-9 kd (Figure 7C). The decreased activity of NOTCH1 in shmda-9 cells lead to a significant decrease in RBPJK (Immunoglobulin Kappa J Region Recombination Signal Binding Protein 1) expression (Figure 7A). The effect of mda-9 kd was rescued by expressing a constitutively active SRC (CA Src), but not with a non constitutively-active SRC (NCA Src). (Figure S3). Additionally, partial recovery from mda-9 kd occurred with addition of a DLL1 peptide (Data not shown).
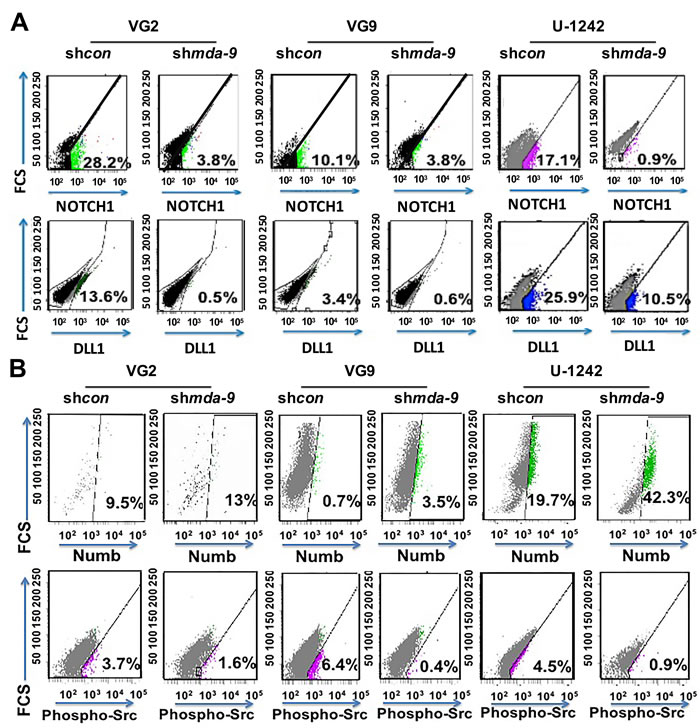
Figure 6: mda-9 regulates the NOTCH1 pathway by regulating NOTCH1 degradation and activation. A. Flow cytometry analyses of control and mda-9 kd GSCs from GBM clinical samples (VG2 and VG9) and cell line (U-1242) for surface expression of NOTCH1 and DLL1. B. Flow cytometry analyses of control and mda-9 KD GSCs from GBM clinical samples and cell lines for NUMB and p-SRC expression. See also Figure S2.
MDA-9 regulates stem cell renewal, maintenance and survival through C-Myc
Considering C-Myc’s influential role in stem cell renewal, maintenance, and survival [34, 35], we investigated the role of MDA-9-mediated regulation of C-myc in HA SCs and GSCs. Suppression of mda-9 by kd and enhanced expression of mda-9 with an expression vector lead to a significant decrease (~3-, ~2- and ~5-fold protein, and ~3-, ~10- and ~12-fold mRNA in VG2, VG9 and U-1242 GSCs, respectively) or gain of C-Myc (~3-fold protein in HA) expression, respectively (Figure 7B; Figure S2; Table 2). The change in C-Myc was observed at both an RNA and protein level (Figure 7B; Figure S2; Table 2). This loss of a c-myc expression phenotype in shmda-9 GSCs was reversed by c-myc overexpression (Figure 7C). mda-9 regulation of c-myc occurred though RBPJK transcription (Figure 7A); which is possibly regulated by NOTCH1 cleavage/activation (Figure S2) via interaction with its ligand, DLL1 (Figure 6A). These findings support the concept that MDA-9 plays a critical role in the regulation of C-Myc in GSCs, which is a major contributor of glioma stemness and GSC survival (34) via the activation of NOTCH1 and RBPJK.
Table 2: Expression of mda-9 and stemness genes in control and shmda-9 GBM GSCs.
GENES |
U-1242 |
VG2 |
VG9 |
|||
shcon |
shmda-9 |
shcon |
shmda-9 |
shcon |
shmda-9 |
|
mda-9 |
1±0.20 |
0.10±0.01 |
1±0.02 |
0.10±0.01 |
1±0.36 |
0.12±0.01 |
Stemness genes Nanog Sox2 Oct4 c-myc |
||||||
1±0.19 |
0.09±0.01 |
1±0.04 |
0.03±0.10 |
1±0.42 |
0.04±0.02 |
|
1±0.11 |
0.22±0.06 |
1±0.53 |
0.10±0.03 |
1±0.53 |
0.15±0.05 |
|
1±0.03 |
0.45±0.03 |
1±0.34 |
0.15±0.03 |
1±0.30 |
0.08±0.02 |
|
1±0.41 |
0.11±0.02 |
1±0.19 |
0.09±0.02 |
1±0.25 |
0.06±0.01 |
|
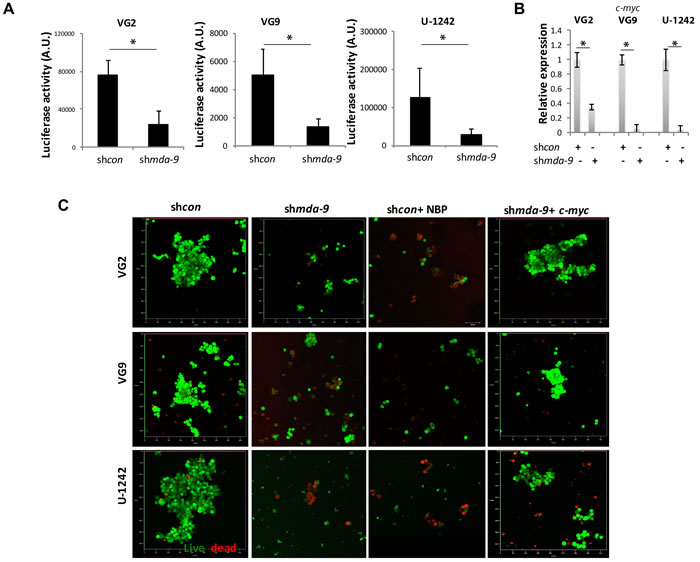
Figure 7: mda-9 regulates GSC survival by controlling c-myc through the NOTCH1/RBPJK pathway. A. Luciferase reporter assay analysis of control and mda-9 kd GSCs from GBM clinical samples (VG2 and VG9) and cell line (U-1242) for RBPJK promoter activity. B. RT-PCR-based c-myc expression in control and mda-9 kd GSCs from GBM cells. Relative expression indicates fold-change in expression. C. Peptide blocking and recovery of function studies to elucidate the effect of Notch1 blocking peptide (NBP) and c-myc overexpression on shcon and mda-9 kd GBM GSCs, respectively; live cells are green, dead cells are red. Bars represent SEM. *P< 0.05, **P < 0.01 using student t-test and ANOVA. See also Figure S2.
MDA-9 regulates GSC survival through p27/Kip-1 and cIAP2
Kd of mda-9 led to increased expression of p27/Kip-1 in GSCs, at both an RNA and protein level (Figure 8A, Figure S2). The increased expression of p27 that culminated in cell death could be prevented by forced expression of c-myc, indicating that GSC survival is dependent on c-myc and p27/kip-1 expression (Figure 8B). In shmda-9 GSCs, expression of miR-221 was also significantly decreased (Figure 8A). These findings demonstrate that p27/kip-1 is regulated by mda-9 through c-myc and miR-221. mda-9 kd caused decreased cIAP2 expression (Figure S2) and this combined with increased expression of p27/kip-1 in shmda-9 GSCs may amplify GSC death. To verify p27/kip-1’s involvement in GSC survival, we overexpressed p27/kip-1 in GSCs and observed a loss of sphere integrity and viability, in both patient-derived GBM and the U-1242 GBM cell line (Figure 8C). We also observed that cell death in shmda-9 GSCs was mediated by Caspase activation (Figure 8D).
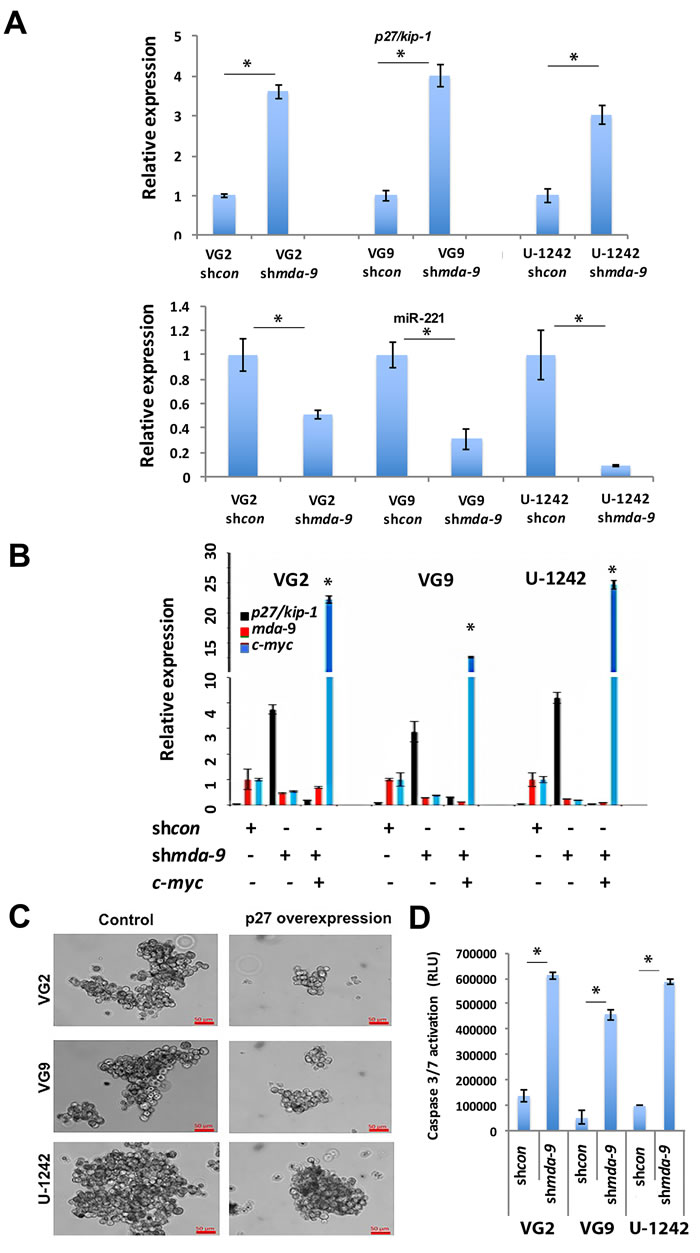
Figure 8: mda-9 regulates apoptosis by p27/Kip-1 expression through the NOTCH1/RBPJK/C-Myc pathway. A. RT-PCR analysis of p27/Kip-1 and miR-221 expression in shcon and mda-9 kd GBM GSCs. B. RT-PCR analysis of p27/kip-1, mda-9, and c-myc in shcon, mda-9 kd GSCs and mda-9 kd GSCs overexpressing c-myc. * indicates significance in expression of p27/kip-1 and c-myc between the shmda-9 and shmda-9 + c-myc groups. Relative expression indicates fold-change in expression. See also Figure S2. C. Image analysis of control and p27/Kip-1 overexpressing GSCs. D. Caspase 3/7 activation analysis in shcon and shmda-9 GSCs. Bars represent SEM. *P < 0.05, using student t-test and ANOVA.
DISCUSSION
GSCs, also called glioma initiating cells, are considered defining elements in the carcinogenic process, hypothesized to represent critical constituents of invasion, angiogenesis, cancer cell resistance to therapy and escape of tumor cells from dormancy (tumor recurrence /relapse occurring after an initial therapeutic response) [36-38]. MDA-9 is a diagnostic marker of tumor aggression and grade, and a positive association has been reported between MDA-9 expression and glioma stage [23]. We now demonstrate a fundamental and central role of MDA-9/Syntenin (SDCBP) as an upstream regulator of stemness and GSC survival in GBM. MDA-9 contributes to GSC cell-cell/cell-matrix adhesion, angiogenesis and invasion. Stem cell-mediated cancer progression is a major clinical problem [6-9, 11, 18, 20] and is accentuated as a significant contributor to therapy-resistance and cancer relapse [4]. mda-9 expression positively correlated with stemness as confirmed by a direct association between expression of mda-9 and stem cell markers and genes, in both GBM patient samples and cell lines. Loss or gain of mda-9 expression led to a corresponding loss or gain of cell surface stem markers, respectively (Figure 2A, 2B, 2C, and Table S2), as well as changes in recognized self-renewal/pluripotency genes including Nanog, Oct4, Sox2 and c-myc (Figure 1A, 1B; Figure S1, S2; Table 2). mda-9 expression was also significantly higher in GSCs than NSGCs (Table 1) and both were dramatically elevated as compared to corresponding normal astrocyte stem cells (Figure 2A). mda-9 also regulated STAT3 expression (Figure 3, Figure S2), which is a key contributor to cellular transformation and tumor maintenance in many cancer contexts, including GBM [16]. Activation of a STAT3-mediated transcriptional network correlates with mesenchymal GBM transformation and poor prognosis (30, 31, 39). STAT3 also regulates self-renewal in cancer stem cells by systematically regulating canonical stemness genes including Nanog, Sox2, Oct4 [16, 29, 30] and myc [40]. NANOG also acts as a master switch of the central stemness transcriptional network, as OCT4/SOX2 bind to the proximal region of the Nanog promoter stimulating Nanog expression [15]. NANOG, SOX2 and OCT4, also bind to their individual promoter’s, thus sustaining a unified auto-regulatory network of cell pluripotency and self-renewal [15]. Our data reveal that mda-9 is a key regulator of this core GSC regulatory system through regulation of STAT3 (Figure 9).
STAT3 can be regulated by SRC, IGF-1R, and p-44/42 [29-33]. Phosphorylated p-44/42 (T202/Y204) and SRC (T417, Y418) phosphorylate STAT3 at position Y705. Our data indicates that MDA-9 regulates STAT3 by controlling IGF-1R (Figure 4B), p-44/42 (Figure 4A) and Src (Figure 6B) signaling. MDA-9 also regulates the activity of FAK [23, 24], RAF and RKIP [25] and it ultimately controls the activation of p-44/42. MDA-9 physically interacts with c-SRC through its PDZ binding motifs and is essential for activation of SRC [23, 41]. These data demonstrate that MDA-9 influences GSC stemness on multiple molecular levels. The higher expression of MDA-9 in GSCs than in normal astrocyte stem cells may indicate that GSCs are more dependent on mda-9 expression than their corresponding non-cancer stem cells. The potential “addiction” of GSCs to MDA-9 is an area of current investigation.
Another critical pathway in stem cell biology is the NOTCH pathway [16]. NOTCH signaling plays an important role in development by regulating cell-fate determination, cell survival, and proliferation [17]. Activation of NOTCH receptors occurs through binding with a number of distinct ligands (including delta-like 1 / DLL1, jagged 1). Upon ligand binding, the intracellular NOTCH domain (ICD) is cleaved and translocates into the nucleus, where it regulates downstream target gene transcription. Aberrant NOTCH signaling promotes tumorigenesis [17]. Recently, a role of the NOTCH signaling pathway in promoting self-renewal of both normal and cancer stem cells has been demonstrated [17, 42]. Our data indicates that MDA-9 regulated NOTCH1 activity on two levels. MDA-9 controlled the expression of NOTCH1 in cells by degradation (Figure 6B), through NUMB, a NOTCH binding ubiquitin ligase [13, 43]. In the presence of p-SRC, NUMB is phosphorylated and then degraded, preventing it from degrading NOTCH1 [44]. In the absence of MDA-9, SRC is not activated to p-SRC, and this leads to higher expression of NUMB resulting in degradation and a decrease in the levels of total NOTCH1.
MDA-9 also controls NOTCH1 activity by regulating NOTCH1 activation through expression of DLL1, the ligand of the NOTCH1 receptor (Figure 6A). The intracellular PDZ binding motif of DLL1 regulates DLL1 protein stability [45], DLL1 trafficking and signaling activity. DLL1 ubiquitination is not required for its internalization, but is necessary for its recycling back to the plasma membrane and efficient interaction with NOTCH1 [46]. MDA-9 can regulate the expression of DLL1 on the cell surface by regulating the interaction between DLL1 and ubiquitin. An effect of MDA-9 on DLL1 has been reported in zebrafish stem cells [47]. The c-terminal of MDA-9 binds to ubiquitin [48], and its PDZ domain may then bind to the PDZ binding motif of DLL1, and this interaction regulates the expression of DLL1 on the surface of GSCs. In the absence of MDA-9 this interaction is altered, leading to decreased DLL1 surface expression. This further reduces the interaction of NOTCH1 with its ligand DLL1, leading to decreased activation of NOTCH1, reduced translocation of the intracellular domain (ICD) of Notch1 to the nucleus and decreased transcription of NOTCH1 target genes.
NOTCH1 directly regulates C-Myc expression [49]. The ICD of NOTCH1 translocates to the nucleus and binds to the promoter of the transcription factor RBPJK, which regulates c-myc expression [50]. The binding of NOTCH1 to the promoter region of RBPJK promotes expression of RBPJK, leading to expression of c-myc. In MDA-9 kd cells the ICD of NOCTH1 is unable to translocate to the nucleus, preventing transcription of RBPJK (Figure 7A), thereby inhibiting elevated c-myc expression (Figure 7B).
Elevated MYC proteins are associated with many cancers and correlate with cancer risk and poor patient survival [19, 51]. Activation of MYC is linked to cellular growth, proliferation and metabolism. C-Myc controls the balance between stem cell self-renewal and differentiation in normal cells. In GBM, C-Myc is essential for GSC regulation and maintenance [34, 35]. C-myc also controls the proliferation of cells by regulating cell cycle modulators including the cyclin-dependent kinase inhibitor, p27, which is a critical target of C-Myc [52]. SRC has also been shown to negatively regulate p27 and elevated levels of p27 cause arrest of tumor growth and apoptosis [53]. Additionally, p27 can suppress SOX-2 [54], which leads to apoptosis in stem cells [55]. Our data revealed that kd of mda-9 decreased SRC, Sox-2 and C-Myc activities, whereas p27/kip-1 expression was increased, culminating in apoptosis of GSCs (Figures 3B, 5A, 6B, 7B). Another anti-apoptotic molecule cIAP2, was also regulated by MDA-9 in GSCs (Figure S2). IAP family members, XIAP, cIAP1, cIAP2, NAIP and survivin, are expressed at higher levels in CD133 positive than in CD133 negative GBM [56], and these anti-apoptotic proteins contribute to GSC survival under adverse conditions. Kd of mda-9 expression decreased expression of cIAP2 (Figure S2), which also participated in induction of apoptosis (Figure 5A).
The current data suggests that MDA-9/syntenin (SDCBP) is part of a complex, tightly regulated connectivity network that confers self-renewal, survival and tumor progressive properties to GSCs [57]. Stemness, initially defined by the expression of cell surface markers and stem cell genes, is a property shared by normal stem cells and GSCs [58]. MDA-9 appears to regulate stemness through similar pathways in both normal astrocyte stem cells and GSCs. However, GSCs appear to be more dependent on (“addicted” to) MDA-9, with significantly elevated expression (Figure 2A), for maintenance and survival than normal stem cells. Forced elevated expression of MDA-9 in normal astrocytes increased their invasiveness, self-renewal and the overall proportion of stem cells, but it did not render these cells tumorigenic. The regulation of stemness by MDA-9 is not exclusive to GSCs, but elevated expression enhances GSC survival, invasion, angiogenesis, and self-renewal. MDA-9 is capable of regulating multiple aspects of stem cell phenotypes simultaneously, validating a critical role in determining GSC stemness. mda-9 can regulate the central transcriptional network of stem regulating genes, additional pluripotency genes, and affects interrelated pathways crucial for stem cell survival (Figure 9). Considering the pivotal role of MDA-9 in determining both GSC aggressiveness and survival, directly targeting MDA-9 expression or its interaction with effector interacting proteins using genetic or pharmacological approaches may provide a unique opportunity to develop targeted therapies for this important component of cancer pathogenesis.
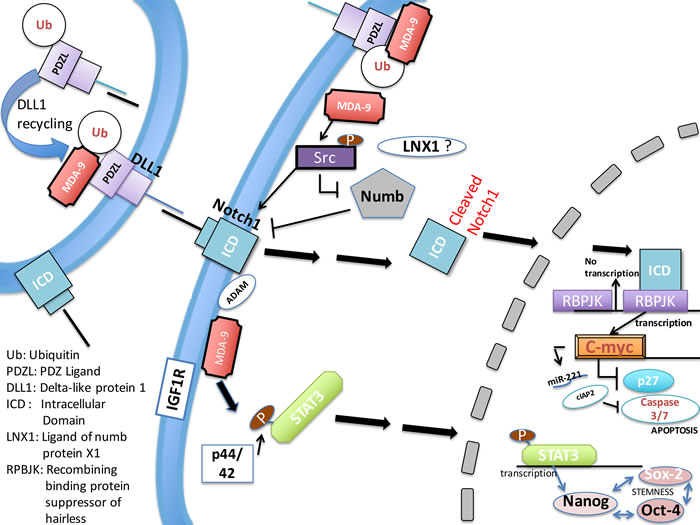
Figure 9: Schematic representation of MDA-9-mediated regulation of GSC survival and stemness. MDA-9 regulates stem cell survival and pluripotency by regulating several molecular activities and promoting defined gene expression changes. The survival pathway is affected by the expression, degradation or activation of the constituents of the NOTCH1/C-Myc signaling pathway. Stemness is regulated by the STAT3/Nanog signaling pathway, which is likely regulated by p-p44/42 and IGF-R1. Ub = Ubiquitin, PDL = PDZ ligand, ICD = Intracellular domain, DLL1 = Delta-like protein 1, LNX1 = Ligand of numb protein 1, RBPJK = Recombining binding protein suppressor of hairless.
MATERIALS and METHODS
Cell lines and tissue samples
Specimens of human primary normal and malignant brain tumors (n = 50) were collected from subjects who underwent surgical removal of their brain tumors. All subjects were informed of the nature and requirements of the study and provided written consent to donate their tissues for research purposes. Informed consent was obtained according to Origene and the research proposals approved by the Institutional Review Board at the VCU TDAAC. The human glioma cell line U-1242-luc-GFP was kindly provided by Dr. Kristofer Valerie (VCU). U-1242/luc-GFP (U-1242-Luc), cells were cultured in DMEM medium supplemented with 10% fetal bovine serum and antibiotics. Isolated non-stem glioma cells (NSGCs), based on lack of expression of CD133 and CD44, were cultured similarly in monolayer culture. Normal human astrocytes (HA) were obtained from Clonetics, USA and grown in Astrocyte Basal Media (ScienCell, CA) supplemented with Astrocyte growth supplement (ScienCell, CA). The cumulative culture length of the cells was less than 6 months after resuscitation. Early passage cells were used for all experiments and authenticated. All the cell lines were frequently tested for mycoplasma contamination using a mycoplasma detection kit from Sigma. All primary GBM cells were authenticated by IDEXX Bioresearch (Columbia, MO).
Isolation and culture of human GBM, putative GSCs and NSGCs
Human GBM GSCs and NSGCs were isolated from GBM tissue from surgical specimens and from established U-1242/luc-GFP GBM cells. GBM tissue samples were dissociated and digested samples were filtered with 70 µm nylon cell strainer (BD) and resuspended in stem cell medium comprised of DMEM/F-12 50:50 containing K27 supplements, glutamine 2 μmol/L (Invitrogen), basic fibroblast and epidermal growth factors (PeproTech, 20 ng/mL each) for continuous culturing [59]. All primary cells were cultured as suspended spheres in ultra-low attachment T25 or T75 culture disks (Corning) in Essential 8 medium (Invitrogen) and analyzed prior to 5 passages to form GSC enriched neurospheres. Neurospheres were dissociated and then labeled with CD44 and CD133 antibody (Miltenyi Biotech) to isolate both pro-neural and mesenchymal GSC subtypes. Stained cells were sorted through a BD Aria II sorting station. Antibody negative and positive cell populations were counted and collected for further culturing. GSC and NSGC populations were counted and collected for further culturing. Xenografted human GSCs were isolated from mice and analyzed for cell surface and intracellular proteins by FACS. The GSCs were cultured in ultra-low attachment plates and flasks with Essential 8 medium (Invitrogen), unless indicated. Isolated NSGCs were cultured in monolayer with complete DMEM medium.
Isolation and culture of primary human astrocyte stem cells
Primary normal human astrocytes were cultured in ultra-low attachment plates and flasks (Corning) in Astrocyte media (ScienCell, CA) . The cells were stained with CD44 and CD133 antibodies, sorted and cultured further under ultra-low attachment conditions.
Self-renewal assay
Sphere-forming assays were used to determine clonogenic growth potential in vitro of both normal and neoplastic cells [60]. Sorted GSCs and NSGC populations were diluted to a density of 500 cells/ml. 2 μl of the diluted cell suspension was plated per well in a 96 well ultra low attachment plate (Corning Inc., Corning, NY, USA), and 150 μl of serum-free medium was added, cultures were then observed daily (n = 96). Additionally, flow cytometry with CD44 and CD133 antibody (Miltenyi Biotech) was performed to assess the stem populations.
Gene expression arrays, and analyses
TissueScan Brain Cancer Tissue cDNA array I, containing 46 malignant (covering four stages) and 2 tumor-adjacent normal tissue cDNAs, were obtained from Origene Technologies, (Rockville, MD, USA). This array was analyzed for mda-9, c-myc, Oct4 and Sox2 expression using taqman probes (Invitrogen) according to the manufacturer’s protocol. A human GSC array (Qiagen) was used according to the manufacturer’s protocol to analyze a clinical GBM sample VG2 (shcon) and an mda-9 kd clone of VG2 (shmda-9). Eighty-four genes were studied. The data was analyzed using the Qiagen web-based PCR array data analysis software.
Promoter reporter assays
Luciferase reporter assays were performed using 2×10⁵ cells infected with either Ad.5/3.shcon or Ad.5/3.shmda-9. Twenty-four hours post-infection, cells were transfected with an RBPJK-responsive luciferase reporter construct with Lipofectamine 2000 as described [23]. Cell lysates were harvested and luciferase activity was measured using a Dual-Luciferase Reporter Assay system (Promega) according to the manufacturer’s instructions. Luciferase activity was normalized to Renilla activity, and data represent the average of triplicates ± S.D.
Reverse transcription polymerase chain reaction
Total RNA was isolated by TRIzol extraction (Invitrogen) and purified using the RNeasy kit (Qiagen). First-strand cDNA was synthesized with SuperScript III reverse transcriptase (Invitrogen). Quantitative PCR studies were carried out by using the TaqMan Gene expression assays (Invitrogen), and were normalized to 18S expression (Invitrogen). Probe details are provided in supplemental information.
Western blotting
Cells were lysed on ice in lysis buffer (20 mM Tris-HCl (pH 7.5), 150 mM NaCl, 1 mM Na2EDTA, 1 mM EGTA, 1% Triton-100, 2.5 mM Sodium pyrophosphate, 1 mM β-glycerophosphate, 1 mM Na3VO4, 1 μg/ml Leupeptin). Protein samples were prepared after protein concentration was determined, and were loaded onto 8% SDS-PAGE for immunoblotting detection. For densitometry evaluation, X-ray films were scanned and analyzed with ImageJ software (National Institutes of Health [NIH]). Antibody details are provided in supplemental information.
Flow cytometry sorting and analysis
CD44, CD133, NOTCH1, DLL1, staining and Annexin V staining were performed according to the manufacturer’s instructions, followed by flow cytometry analysis using BD DIVA.
Intracellular flow cytometry
STAT3, p-STAT3, p44/42, p-p44/42, p-Src, and Numb proteins were assessed by intra-cellular flow cytometry [61, 62]. Cell fixation, permeabilization and antibody staining were performed according to the manufacturer’s instructions, followed by flow cytometry analysis using BD DIVA.
Tumorigenicity studies
All experiments and procedures involving mice were approved by the Institutional Animal Care and Use Committee of Virginia Commonwealth University. For the intracranial brain tumor model, athymic female NCr-nu/nu mice (National Cancer Institute-Frederick) were used (n = 10 per group). Mice were anesthetized through i.p. administration of ketamine (40 mg/kg) and xylazine (3 mg/kg) and immobilized in a stereotactic frame (Stoelting). Intracerebral injections of 1.5 × 10⁴ cells in 2 μL per mouse were done using an automated injector (Stoelting) as described earlier [23, 59]. Tumor burden was determined by bioluminescent imaging [63]. Animals of each group were monitored until they reached the point of euthanization according to the VCU-IACUC approved protocol and survival data was analyzed.
Peptide blocking/activation studies
1 x 10⁵ control and treated GSCs were cultured in 6-well ultra-low attachment plates. NOTCH1 blocking peptide (Biovision) and DLL1 peptide (Abcam) were used at a concentration of 10 μg/ml and incubated with cells for 48 hours. After incubation the cells were stained and analyzed for viability, spheroid size and structure.
Live/dead cell assay
Live/Dead cell staining was performed according to the manufacturer’s instructions (Invitrogen), followed by imaging by laser confocal microscopy (Leica). The images were analyzed by Zen software.
Histology
Mice were euthanized according to the veterinarian’s suggestions (approximately 1-6 months from intracranial injection). The mice were carefully dissected to obtain the brain tissue. Paraffin-embedded tissues were sectioned at 4-μm thickness and stained with Haematoxylin and Eosin.
shRNA knockdown
shRNA sequences were obtained through Qiagen with the following sequences: 5′-TTGACTCTTAAGATTATGTAA-3′ (shmda-9 #3) and 5′-TGGGATGGTCTTAGAATATTT-3′ (shmda-9 #4). Ad.5/3.shmda-9 was constructed as previously described [23] using the following primer sequences: forward:5’-GCCTGCTTTTATCTTTGAACATATTATTAAGCGAATGAAGCCTAGTATAAGAAAAGCCTAATGGACCACACCATTCCTGAG-3′ and reverse: 3′-CGGACGAAAATAGAAAC TTGTATAATAATTCGCTTACT TCGGATCATATTACTTTTCGGATTACCTGGTGTGGT AAGGACTC-5’.
Statistical analysis
For all in vitro and ex vivo experiments, statistical analyses were conducted using Student’s t test and ANOVA (Microsoft Excel). For in vivo studies, statistical analyses were performed using the Kaplan-Meier method (survival studies). Pearson’s correlation coefficient (R) and coefficient of determination (R2) were calculated for correlation analysis. The data from clinical samples were analyzed using Microsoft Excel’s multiple regression analysis tool. All statistical tests were two-sided, and p values ≤ 0.05 and ≤ 0.01 were considered to be significant and highly significant, respectively. Confidence interval (CI) of 95% was considered statistically significant. Patient data was analyzed using correlation heatmap and cluster analysis tools (Plotly Technologies Inc. Montreal, QC). The RT2 Profiler PCR Array Data Analysis software was used to study the statistical significance of cancer stem cell array data, and a minimum of an ~4-fold decrease was analyzed by selecting the statistical boundary for Log10shmda-9 del del CT/ Log10shcon del del CT as 4.
ACKNOWLEDGMENTS
The present study was supported in part by NIH grant 1 R01 CA134721 (PBF), NCI Cancer Center Support Grant to VCU Massey Cancer Center P30 CA016059 (P.B.F., D.S., J.J.W.), VCU Massey Cancer Center developmental funds (P.B.F.) and the National Foundation for Cancer Research (NFCR) (P.B.F.). Microscopy was performed at the VCU - Dept. of Anatomy & Neurobiology Microscopy Facility, supported, in part, by funding from NIH-NINDS Center Core Grant 5 P30 NS047463 and, in part, by funding from NIH-NCI Cancer Center Support Grant P30 CA016059. The VCU Massey Cancer Center Flow Cytometry Shared Resource, supported, in part, with funding from NIH-NCI Cancer Center Support Grant P30 CA016059, generated services and products in support of the research project. P.B.F. holds the Thelma Newmeyer Corman Chair in Cancer Research.
Conflicts of Interest
There are no conflicts of interest for any of the authors on this paper.
Author contributions
S.T., S.K.D., and P.B.F. conceived the ideas and designed the experiments. S.T., A.K.P. and X.N.S. performed the experiments. S.T., S.K.D. L.E., J.J.W., D.S., and P.B.F. analyzed the data. S.T., L.E. and P.B.F. wrote the paper.
REFERENCES
1. Fisher PB, Weinstein IB. Chemical-viral interactions and multistep aspects of cell transformation. IARC Sci Publ. 1980; 27: 113-131.
2. Kegelman TP, Hu B, Emdad L, Das SK, Sarkar D, Fisher PB. In vivo modeling of malignant glioma: the road to effective therapy. Adv Cancer Res. 2014; 121: 261-330.
3. Pattabiraman DR, Weinberg RA. Tackling the cancer stem cells - what challenges do they pose? Nature Rev Drug Discov. 2014; 13: 497-512.
4. Li Y, Rogoff HA, Keates S, Gao Y, Murikipudi S, Mikule K, Leggett D, Li W, Pardee AB, Li CJ. Suppression of cancer relapse and metastasis by inhibiting cancer stemness. Proc Natl Acad Sci U S A. 2015; 112: 1839-1844.
5. Talukdar S, and Kundu SC. Engineered 3D silk-based metastasis models: interactions between human breast adenocarcinoma, mesenchymal stem cells and osteoblast-like cells. Adv Funct Mater. 2013; 23: 5249-5260.
6. Diehn M, and Majeti R. Metastatic cancer stem cells: an opportunity for improving cancer treatment? Cell Stem Cell. 2010; 6: 502-503.
7. Cho DY, Lin SZ, Yang WK, Lee HC, Hsu DM, Lin HL, Chen CC, Liu CL, Lee WY, Ho LH. Targeting cancer stem cells for treatment of glioblastoma multiforme. Cell Transplant. 2013; 22: 731-739.
8. Balbous A, Cortes U, Guilloteau K, Villalva C, Flamant S, Gaillard A, Milin S, Wager M, Sorel N, Guilhot J, Bennaceur-Griscelli A, Turhan A, Chomel JC, et al. A mesenchymal glioma stem cell profile is related to clinical outcome. Oncogenesis. 2014; 3: e91.
9. Singh SK, Hawkins C, Clarke ID, Squire JA, Bayani J, Hide T, Henkelman RM, Cusimano MD, Dirks PB. Identification of human brain tumour initiating cells. Nature. 2004; 432: 396-401.
10. Visvader JE, and Lindeman GJ. Cancer stem cells in solid tumours: accumulating evidence and unresolved questions. Nature Rev Cancer. 2008; 8: 755-768.
11. Lahad JP, Mills GB, Coombes KR. Stem cell-ness: a “magic marker” for cancer. J Clinical Invest. 2005; 115: 1463-1467.
12. Medema JP. Cancer stem cells: the challenges ahead. Nature Cell Biol. 2013; 15: 338-344.
13. Mao P, Joshi K, Li J, Kim SH, Li P, Santana-Santos L, Luthra S, Chandran UR, Benos PV, Smith L, Wang M, Hu B, Cheng SY, et al. Mesenchymal glioma stem cells are maintained by activated glycolytic metabolism involving aldehyde dehydrogenase 1A3. Proc Natl Acad Sci U S A. 2013; 110: 8644-8649.
14. Cheng JX, Liu BL, Zhang X. How powerful is CD133 as a cancer stem cell marker in brain tumors? Cancer Treat Rev. 2009; 35: 403-408.
15. Pan G, and Thomson JA. Nanog and transcriptional networks in embryonic stem cell pluripotency. Cell Res. 2007; 17: 42-49.
16. Fouse SD, and Costello JF. Cancer Stem Cells Activate STAT3 the EZ Way. Cancer Cell. 2013; 23: 711-713.
17. Zhao D, Mo Y, Li MT, Zou SW, Cheng Z, Sun YP, Xiong Y, Guan KL, Lei QY. NOTCH-induced aldehyde dehydrogenase 1A1 deacetylation promotes breast cancer stem cells. J Clin Invest. 2014; 124: 5453-5465.
18. Lee TK, Castilho A, Cheung VC, Tang KH, Ma S, Ng, IO. CD24(+) liver tumor-initiating cells drive self-renewal and tumor initiation through STAT3-mediated NANOG regulation. Cell Stem Cell. 2011; 9: 50-63.
19. Nair R, Roden DL, Teo WS, McFarland A, Junankar S, Ye S, Nguyen A, Yang J, Nikolic I, Hui M, Morey A, Shah J, Pfefferle AD, et al. c-Myc and Her2 cooperate to drive a stem-like phenotype with poor prognosis in breast cancer. Oncogene. 2014; 33: 3992-4002.
20. Schmidt C. Cancer stem cells in the crosshairs. Cancer Discov. 2012; 5: 384.
21. Sarkar D, Boukerche H, Su ZZ, and Fisher PB. mda-9/Syntenin: more than just a simple adapter protein when it comes to cancer metastasis. Cancer Res. 2008; 68: 3087-3093.
22. Kegelman TP, Das SK, Emdad L, Hu B, Menezes ME, Bhoopathi P, Wang XY, Pellecchia M, Sarkar D, Fisher PB. Targeting tumor invasion: the roles of MDA-9/Syntenin. Expert Opin Ther Targets. 2015; 19: 97-112.
23. Kegelman TP, Das SK, Hu B, Bacolod MD, Fuller CE, Menezes ME, Emdad L, Dasgupta S, Baldwin AS, Bruce JN, Dent P, Pellecchia M, Sarkar D, et al. MDA-9/syntenin is a key regulator of glioma pathogenesis. Neuro Oncol. 2014; 16: 50-61.
24. Boukerche H, Su ZZ, Emdad L, Baril P, Balme B, Thomas L, et al. mda-9/Syntenin: a positive regulator of melanoma metastasis. Cancer Res. 2005; 65: 10901-10911.
25. Das SK, Bhutia SK, Sokhi UK, Azab B, Su ZZ, Boukerche H, Anwar T, Moen EL, Chatterjee D, Pellecchia M, Sarkar D, Fisher PB. Raf kinase inhibitor RKIP inhibits MDA-9/syntenin-mediated metastasis in melanoma. Cancer Res. 2012; 72: 6217-6226.
26. Qian XL, Li YQ, Yu B, Gu F, Liu FF, Li WD, Zhang XM, Fu L. Syndecan binding protein (SDCBP) is overexpressed in estrogen receptor negative breast cancers, and is a potential promoter for tumor proliferation. PloS one. 2013; 8: e60046.
27. Bilodeau M, Sauvageau G. Uncovering stemness. Nat Cell Biol. 2006; 8: 1048-1049.
28. Li Y, Ye X, Tan C, Hongo JA, Zha J, Liu J, Kallop D, Ludlam MJ, Pei L. Axl as a potential therapeutic target in cancer: role of Axl in tumor growth, metastasis and angiogenesis. Oncogene. 2009; 28: 3442-3455.
29. Niwa H, Burdon T, Chambers I, Smith A. Self-renewal of pluripotent embryonic stem cells is mediated via activation of STAT3. Genes & Development. 1998; 12: 2048-2060.
30. Sherry MM, Reeves A, Wu JK, Cochran BH. STAT3 is required for proliferation and maintenance of multipotency in glioblastoma stem cells. Stem Cells. 2009; 27: 2383-2392.
31. Turkson J, Bowman T, Garcia R, Caldenhoven E, De Groot RP, Jove R. Stat3 activation by Src induces specific gene regulation and is required for cell transformation. Mol Cell Biol. 1998; 18: 2545-2552.
32. Tkach M, Rosemblit C, Rivas MA, Proietti CJ, Diaz Flaque MC, Mercogliano MF, Beguelin W, Maronna E, Guzmán P, Gercovich FG, Deza EG, Elizalde PV, Schillaci R. p42/p44 MAPK-mediated Stat3Ser727 phosphorylation is required for progestin-induced full activation of Stat3 and breast cancer growth. Endocr Relat Cancer. 2013; 20: 197-212.
33. Zhang W, Zong CS, Hermanto U, Lopez-Bergami P, Ronai Z, Wang LH. RACK1 recruits STAT3 specifically to insulin and insulin-like growth factor 1 receptors for activation, which is important for regulating anchorage-independent growth. Mol Cell Biol. 2006; 26: 413-424.
34. Wang J, Wang H, Li Z, Wu Q, Lathia JD, McLendon RE, Hjelmeland AB, Rich JN. c-Myc is required for maintenance of glioma cancer stem cells. PLoS One. 2008; 3: e3769.
35. Laurenti E, Varnum-Finney B, Wilson A, Ferrero I, Blanco-Bose WE, Ehninger A, Knoepfler PS, Cheng PF, MacDonald HR, Eisenman RN, Bernstein ID, Trumpp A. Hematopoietic stem cell function and survival depend on c-Myc and N-Myc activity. Cell Stem Cell. 2008; 3: 611-624.
36. Lathia JD, Mack SC, Mulkearns-Hubert EE, Valentim CLL, Rich JN. Cancer stem cells in glioblastoma. Genes & Development. 2015; 29: 1203-1217.
37. Altaner C. Glioblastoma and stem cells. Neoplasma. 2008; 55: 369-374.
38. Ortensi B, Setti M, Osti D, Pelicci G. Cancer stem cell contribution to glioblastoma invasiveness. Stem Cell Research & Therapy. 2013; 4: 18.
39. Carro MS, Lim WK, Alvarez MJ, Bollo RJ, Zhao X, Snyder EY, Sulman EP, Anne SL, Doetsch F, Colman H, Lasorella A, Aldape K, Califano A, et al. The transcriptional network for mesenchymal transformation of brain tumours. Nature. 2010; 463: 318-325.
40. Zhao D, Pan C, Sun J, Gilbert C, Drews-Elger K, Azzam DJ, Picon-Ruiz M, Kim M, Ullmer W, El-Ashry D, Creighton CJ, Slingerland JM. VEGF drives cancer-initiating stem cells through VEGFR-2/Stat3 signaling to upregulate Myc and Sox2. Oncogene. 2015; 34: 3107-3119.
41. Boukerche H, Su ZZ, Prevot C, Sarkar D, Fisher PB. mda-9/Syntenin promotes metastasis in human melanoma cells by activating c-Src. Proc Natl Acad Sci U S A. 2008; 105: 15914-5919.
42. Gonzalez ME, Moore HM, Li X, Toy KA, Huang, W, Sabel MS, ZH2 expands breast stem cells through activation of NOTCH1 signaling. EZH2 expands breast stem cells through activation of NOTCH1 signaling. Proc Natl Acad Sci U S A. 2014; 111: 3098-3103.
43. McGill MA, Dho SE, Weinmaster G, McGlade CJ. Numb regulates post-endocytic trafficking and degradation of Notch1. J Biol Chem. 2009; 284: 26427-26438.
44. Weiss A, Baumgartner M, Radziwill G, Dennler J, Moelling K. c-Src is a PDZ interaction partner and substrate of the E3 ubiquitin ligase Ligand-of-Numb protein X1. F E B S Lett. 2007; 581: 5131-5136.
45. Adam MG, Berger C, Feldner A, Yang WJ, Wustehube-Lausch J, Herberich SE, Pinder M, Gesierich S, Hammes HP, Augustin HG, Fischer A. Synaptojanin-2 binding protein stabilizes the Notch ligands DLL1 and DLL4 and inhibits sprouting angiogenesis. Circulation Res. 2013; 113: 1206-1218.
46. Heuss SF, Ndiaye-Lobry D, Six EM, Israel A, Logeat F. The intracellular region of Notch ligands Dll1 and Dll3 regulates their trafficking and signaling activity. Proc Natl Acad Sci U S A. 2008; 105: 11212-11217.
47. Estrach S, Legg J, Watt FM. Syntenin mediates Delta1-induced cohesiveness of epidermal stem cells in culture. J Cell Sci. 2007; 120: 2944-2952.
48. Okumura F, Yoshida K, Liang F, Hatakeyama S. MDA-9/syntenin interacts with ubiquitin via a novel ubiquitin-binding motif. Mol Cell Biochem. 2011; 352: 163-172.
49. Palomero T, Lim WK, Odom DT, Sulis ML, Real PJ, Margolin A, Barnes KC, O’Neil J, Neuberg D, Weng AP, Aster JC, Sigaux F, Soulier J, et al. NOTCH1 directly regulates c-MYC and activates a feed-forward-loop transcriptional network promoting leukemic cell growth. Proc Natl Acad Sci U S A. 2006; 103: 18261-18266.
50. Wang H, Zang C, Taing L, Arnett KL, Wong YJ, Pear WS, Blacklow SC, Liu XS, Aster JC. NOTCH1-RBPJ complexes drive target gene expression through dynamic interactions with superenhancers. Proc Natl Acad Sci U S A. 2014; 111: 705-10.
51. Cole MD. MYC association with cancer risk and a new model of MYC-mediated repression. Cold Spring Harb Perspect Med. 2014; 4: a014316.
52. Amati B, Alevizopoulos K, Vlach J. Myc and the cell cycle. Front Biosci. 1998; 3: d250-68.
53. Nickeleit I, Zender S, Kossatz U, Malek NP. p27kip1: a target for tumor therapies? Cell Division. 2007; 2: 13.
54. Li H, Collado M, Villasante A, Matheu A, Lynch CJ, Canamero M, Rizzoti K, Carneiro C, Martínez G, Vidal A, Lovell-Badge R, Serrano M. p27(Kip1) directly represses Sox2 during embryonic stem cell differentiation. Cell Stem Cell. 2012; 11: 845-852.
55. Chen S, Li X, Lu D, Xu Y, Mou W, Wang L, Chen Y, Liu Y, Li X, Li LY, Liu L, Stupack D, Reisfeld RA, et al. SOX2 regulates apoptosis through MAP4K4-survivin signaling pathway in human lung cancer cells. Carcinogenesis. 2014; 35: 613-623.
56. Liu G, Yuan X, Zeng Z, Tunici P, Ng H, Abdulkadir IR, Lu L, Irvin D, Black KL, Yu JS. Analysis of gene expression and chemoresistance of CD133+ cancer stem cells in glioblastoma. Mol Cancer. 2006; 5: 67.
57. Talukdar S, Emdad L, Das SK, Sarkar D, Fisher PB. Evolving strategies for therapeutically targeting cancer stem cells (CSCs). Adv Cancer Res. 2016; in press.
58. Kim CF, Dirks PB. Cancer and stem cell biology: how tightly intertwined. Cell Stem Cell 2008; 3: 147-150.
59. Hu B, Emdad L, Bacolod MD, Kegelman TP, Shen XN, Alzubi MA, Das SK, Sarkar D, Fisher PB. Astrocyte elevated gene-1 interacts with Akt isoform 2 to control glioma growth, survival, and pathogenesis. Cancer Res. 2014; 74: 7321-7332.
60. Cao L, Zhou Y, Zhai B, Liao J, Xu W, Zhang R, Li J, Zhang Y, Chen L, Qian H, Wu M, Yin Z. Sphere-forming cell subpopulations with cancer stem cell properties in human hepatoma cell lines. BMC Gastroenterol. 2011; 11: 71.
61. Perez OD, Nolan GP. Simultaneous measurement of multiple active kinase states using polychromatic flow cytometry. Nat Biotechnol. 2002; 20: 155-162
62. Krutzik PO, Nolan GP. Intracellular phospho-protein staining techniques for flow cytometry: monitoring single cell signaling events. Cytometry A. 2003; 55: 61-70.
63. Dash R, Azab B, Quinn BA, Shen X, Wang XY, Das SK, Rahmani M, Wei J, Hedvat M, Dent P, Dmitriev IP, Curiel DT, Grant S, et al. Apogossypol derivative BI-97C1 (Sabutoclax) targeting Mcl-1 sensitizes prostate cancer cells to mda-7/IL-24-mediated toxicity. Proc Natl Acad Sci U S A. 2011; 108: 8785-8790.