
INTRODUCTION
Myelodysplastic syndromes (MDS) are a group of myeloid neoplasms that are defined by clonal stem cell disorders and characterized by ineffective hematopoiesis and an increased risk of progression to acute myeloid leukemia (AML) [1]. This syndrome shows variable clinical courses, from indolent to life-threatening conditions related to severe cytopenia or progression to AML. Therapy using hypomethylating agents (HMA), such as azacitidine or decitabine, is considered as the first treatment option for patients with lower-risk MDS with significant cytopenia or those with higher-risk MDS [2]. However, it is still unresolved issues for clinicians to predict response to the hypomethylating therapy (HMT) and survival following HMT.
Various prognostic scoring systems have been developed to estimate prognosis which can support decision making for selecting therapeutic options [3]. Among those, the revised International Prognostic Scoring System (IPSS-R), the most recently updated system, is useful to predict survival of patients with or without active treatment including HMT [4–6]. However, the system cannot be used to predict response specifically to HMT [7]. The IPSS-R consists of bone marrow blast percentage, degree of cytopenia, and cytogenetic risk groups. Cytogenetic test results reflect the biological characteristics of MDS cells, but approximately half the patients have cytogenetic abnormalities which makes them less discriminating. Thus, if reliable molecular genetic markers were identified, they may provide additional prognostic information on MDS.
To get a better understanding of MDS pathogenesis, recurrent somatic mutations and their associations with MDS pathophysiology have been under active investigation [8, 9]. With such efforts, some mutations have been added to existing prognostic scoring systems or used to develop new systems based on their independent prognostic implications [10, 11]. With regard to HMT, TET2, DNMT3A and ASXL1 mutations have been reported to be associated with treatment response in MDS patients [12–14], but not in chronic myelomonocytic leukemia [15]. In this study, we aimed to discover mutations associated with response to HMT and survival in Korean MDS patients. For this, we analyzed the genomes of MDS patients showing various responses to HMT by targeted deep sequencing.
RESULTS
Targeted deep sequencing of MDS genomes
To discover mutations related to response to HMT in MDS patients, 107 MDS patients were analyzed using targeted deep sequencing. For this, MDS patients were categorized into two groups according to their response to HMA (57 responders and 50 non-responders). Their clinicopathological characteristics are shown in Table 1. Targeted deep sequencing was performed using the target gene panel consisting of 26 genes evidently or potentially associated with MDS (DNMT3A, TET2, EZH2, RUNX1, ASXL1, STAG2, CBL, TP53, SRSF2, SF3B1, U2AF1, LAMB4, DNMT1, ETV6, KRAS, NF1, NPM1, NRAS, PRPF8, IDH1, IDH2, JAK2, FLT3, SETBP1, ATRX, and ZRSR2) [10-14, 16-20]. The median depth of coverage for the targeted deep sequencing was 1,623x (range 571x-4,437x) across the entire genome (Supplementary Table S1).
Table 1: Baseline characteristics and treatment outcomes of study subjects
Clinical characteristics |
Total (n=107) |
Responder (n=57) |
Non-responder (n=50) |
P |
|---|---|---|---|---|
Sex |
|
|
|
|
Male |
67 (62.6%) |
32 (56.1%) |
35 (70.0%) |
0.164 |
Female |
40 (37.4%) |
25 (43.9%) |
15 (30.0%) |
|
Age |
|
|
|
|
<60 years. |
59 (55.1%) |
27 (47.4%) |
32 (64.0%) |
0.119 |
≥60 years. |
48 (44.9%) |
30 (52.6%) |
18 (36.0%) |
|
WHO classification |
|
|
|
|
RCUD/RCMD |
33 (30.8%) |
15 (26.3%) |
18 (36.0%) |
0.693 |
RAEB1 |
23 (21.5%) |
14 (24.6%) |
9 (18.0%) |
|
RAEB2 |
46 (43.0%) |
25 (43.9%) |
21 (42.0%) |
|
CMML |
5 (4.7%) |
3 (5.3%) |
2 (4.0%) |
|
IPSS risk group* |
|
|
|
|
L/Int-1 |
43 (40.2%) |
22 (38.6%) |
21 (42.0%) |
0.695 |
Int-2/H |
63 (58.9%) |
35 (61.4%) |
28 (56.0%) |
|
IPSS-R risk group* |
|
|
|
|
VL/L/Int |
37 (34.6%) |
23 (40.4%) |
14 (28.0%) |
0.226 |
H/VH |
69 (64.5%) |
34 (59.6%) |
35 (70.0%) |
|
Hemoglobin |
|
|
|
|
<10g/dL |
79 (73.8%) |
37 (64.9%) |
42(84.0%) |
0.029 |
≥10g/dL |
28 (26.2%) |
20 (35.1%) |
8 (16.0%) |
|
ANC |
|
|
|
|
<800 cells/μL |
39 (36.4%) |
20 (35.1%) |
19 (38.0%) |
0.841 |
≥800 cells/μL |
68 (63.6%) |
37 (64.9%) |
31 (62.0%) |
|
Platelets |
|
|
|
|
<50,000/μL |
41 (38.3%) |
16 (28.1%) |
25 (50.0%) |
0.028 |
≥50,000/μL |
66 (61.7%) |
41 (71.9%) |
25 (50.0%) |
|
Blasts in BM |
|
|
|
|
<5% |
42 (39.3%) |
23 (40.4%) |
19 (38.0%) |
0.845 |
≥5% |
65 (60.7%) |
34 (59.6%) |
31 (62.0%) |
|
Pre-HMA treatment |
|
|
|
|
None |
99 (92.5%) |
54 (94.7%) |
45 (90.0%) |
0.469 |
EPO/CS/OXM |
8 (7.5%) |
3 (5.3%) |
5 (10.0%) |
|
HMA |
|
|
|
|
Azacitidine |
66 (61.7%) |
40 (70.2%) |
26 (52.0%) |
0.073 |
Decitabine |
41 (38.3%) |
17 (29.8%) |
24 (48.0%) |
|
No of HMA cycles, median (range) |
4 (1-18) |
6 (1-18) |
2 (1-10) |
<0.001 |
Type of best response |
|
|
|
|
CR |
- |
12 (21.1%) |
- |
|
mCR±HI |
- |
28 (49.1%) |
- |
|
SD+HI |
- |
17 (29.8%) |
- |
|
Type of treatment failure |
|
|
|
|
DP |
- |
- |
12 (24.0%) |
|
SD-HI |
- |
- |
33 (66.0%) |
|
Intolerable/toxic death |
- |
- |
5 (10.0%) |
|
Overall survival |
|
|
|
|
No of death |
45 |
19 |
26 |
|
Probability at 2 years |
62.4% |
71.8% |
51.4% |
0.015 |
AML-free survival |
|
|
|
|
No. of AML progression |
28 |
12 |
16 |
|
Probability at 2 years |
71.3% |
79.2% |
61.8% |
0.039 |
* IPSS and IPSS-R data of one patient in non-responder group is not available. N, number; WHO, World Health Organization; RCUD, refractory cytopenia with unilineage dysplasia; RCMD, refractory cytopenia with multilineage dysplasia; RAEB, refractory anemia with excess of blasts; CMML, chronic myelomonocytic leukemia; IPSS, International Prognostic Scoring System; IPSS-R, revised IPSS; ANC, absolute neutrophil count; L, Low; VL, very low; Int, intermediate; H, high; VH, very high; HMA, hypomethylating agent; EPO, erythropoietin; CS, cyclosporine; OXM, oxymetholone; CR, complete remission; mCR, marrow CR; HI, hematological improvement; SD, stable disease
A majority of the MDS genomes (94/107, 87.9%) had mutations in at least one target gene (Figure 1A, Supplementary Table S2). On average, 1.9 single nucleotide variants (SNVs) and indels were identified per genome (SD 1.4, range 0-7). There were no significant differences in the number and pattern of the mutations between responders (average of 1.7 mutations; 0-5) and non-responders (average of 2.2 mutations; 0-7) (Supplementary Figure S1). Of the mutated genes, six genes were detected in more than 10% of the 107 MDSs; U2AF1 (19.6%), ASXL1 (18.7%), TET2 (15.9%), TP53 (12.1%), RUNX1 (11.2%), and SF3B1 (10.3%). The frequencies of mutations identified in this study were largely similar to those identified in other MDS studies with some exceptions such as DNMT3A, DNMT1, SRSF2, IDH2, and NPM1 (Supplementary Table S3) [12, 13, 19–21].
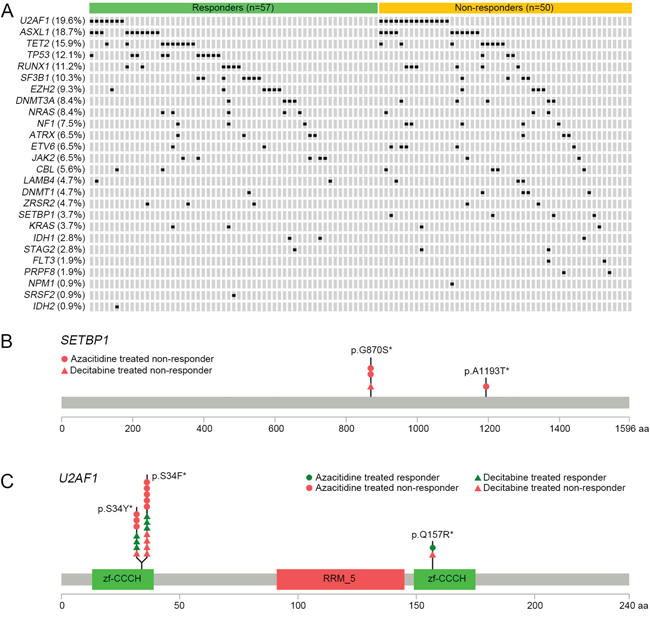
Figure 1: Mutational features of the candidate genes in MDS, and a schematic diagram of SETBP1 and U2AF1 mutations. A. Mutational features of the 26 candidate genes in 107 MDS genomes. Each row represents the mutated gene and each column represents an individual patient. B. A diagram of SETBP1 mutations. Mutation profiles are as follows: G-to-A transitions resulting in p.G870S (n=3) and p. A1193T (n=1). X axis represents amino acid position. Y axis represents the number of mutations. *, Somatic mutations in COSMIC database. C. A diagram of U2AF1 mutations. Mutation profiles are as follows: G-to-A transitions resulting in p.S34F (n=12), G-to-T transversions resulting in p.S34Y (n=7) and T-to-C transitions resulting in p.Q157R (n=2). X axis represents amino acid position. Y axis represents the number of mutations. *, Somatic mutations in COSMIC database.
Factors associated with response to HMT
In univariate analysis, only SETBP1 mutation was significantly associated with non-response to HMT (mutation frequencies 0% (0/57) in responders vs. 8% (4/50) in non-responders, P=0.045) (Table 2, Supplementary Table S4). All SETBP1 mutations, p.G870S (n=3) and p.A1193T (n=1), identified on exon 4 are missense mutations which are present in the COSMIC database [22] (Figure 1B). Recurrent p.G870S mutation is a hotspot mutation in myeloid neoplasms including MDS [23, 24]. U2AF1 mutation was also more frequent in non-responders, but the significance was borderline (12.3% in responders vs. 28% in non-responders, P=0.052) (Supplementary Table S4). All U2AF1 mutations, p.S34F (n=12), p.S34Y (n=7) and p.Q157R (n=2), are missense mutations which are present in the COSMIC database (Figure 1C). Among the clinical variables, a lower hemoglobin level (<10 g/dL) and platelet count (<50,000/μL) were significantly associated with non-response (lower hemoglobin, 46.8% in responders vs. 71.4% in non-responders, P=0.029; lower platelet, 39.0% vs. 62.1%, P=0.028). In multivariate analysis into which the variables with chi-square P values < 0.1 were entered, only a hemoglobin level <10g/dL (OR 3.56, 95% CI 1.22-10.33, P=0.020) and a platelet count <50,000/μL (OR 2.49, 95% CI 1.05-5.93, P=0.039) were found to be associated with positive response to HMT in MDS (Table 2). Although the frequency of TET2 mutation was similar to those from previous studies conducted in diverse populations (Supplementary Table S3), this mutation was not significantly associated with HMT response in our study. Clinical and genetic variables associated with response to HMT are summarized in Supplementary Table S4.
Table 2: Predictive factors of non-response to HMT
Variable |
Univariate |
Multivariate* |
||
|---|---|---|---|---|
P |
OR (95% CI) |
P |
OR (95% CI) |
|
Clinical variables |
|
|
|
|
Hemoglobin (< 10g/dL) |
0.029 |
2.84 (1.12-7.20) |
0.020 |
3.56 (1.22-10.33) |
Platelets (< 50,000/μL) |
0.028 |
2.56 (1.15-5.71) |
0.039 |
2.49 (1.05-5.93) |
Gene mutations |
|
|
|
|
U2AF1 mutation |
0.052 |
2.78 (1.02-7.58) |
0.138 |
2.22 (0.77-6.37) |
SETBP1 mutation |
0.045 |
- |
0.999 |
- |
*Stepwise multiple logistic regression analysis with the variables of P<0.1 in univariate analysis (hemoglobin, platelets, hypomethylating agent and mutations of TP53, SETBP1, and U2AF1 gene) was conducted for multivariable analysis.
OR, Odds Ratio of non-response to HMT
Next, we performed the subgroup analysis by HMA type (66 patients treated with azacitidine and 41 treated with decitabine). U2AF1 mutation was significantly associated with the non-response in the azacitidine group (mutation frequencies 2.5% (1/40) in responders vs. 30.8% (8/26) in non-responders, P=0.002) but not in the decitabine group (P=0.507). Of note, the eight non-responders in the azacitidine group had p.S34F/Y mutations which are known to be in a mutational hotspot in MDS [25] (Figure 1C). Other frequent mutations in the genes including TET2, ASXL1, and RUNX1 did not show any significant associations with response to treatment in both azacitidine and decitabine treated groups. In multivariate analysis conducted in the same manner described above, only U2AF1 mutation (OR 14.96, 95% CI 1.67-134.18, P=0.016) was the independent predictive factor of response to azacitidine in MDS.
Factors associated with overall and AML-free survival
To identify the factors associated with prognosis, survival analysis was performed. The median duration of follow-up was 2.28 years (range 0.07 to 6.24 years) from the start of HMT; 45 patients died and 28 patients progressed to AML. The 2-year overall and AML-free survival rates were 62.4% and 71.3%, respectively. In univariate analysis, six mutations were significantly associated with poorer overall survival (OS) (DNMT1, P=0.012; DNMT3A, P=0.001; TP53, P=0.003; NPM1, P=0.029; NRAS, P<0.001; KRAS, P=0.001) (Supplementary Table S4). When we merged KRAS and NRAS mutations into RAS mutations, OS of the patients with RAS mutations were significantly lower than those without them (P<0.001) (Supplementary Table S4). In addition to these mutations, five clinical variables (male-gender, P=0.006; age ≥60, P=0.004; BM blast ≥5%, P=0.029; IPSS-R cytogenetic risk poor or very poor, P=0.007; IPSS-R high (H) or very high (VH), P=0.039) were significantly associated with poorer OS in univariate analysis (Supplementary Table S4). Multivariate analysis with candidate mutations and clinical variables significant in univariate analysis demonstrated that the presence of DNMT1 (Hazard ratio [HR]=4.08, 95% CI 1.14-14.62, P=0.031), DNMT3A (HR=4.12, 95% CI 1.51-11.22, P=0.006), RAS (HR=2.76, 95% CI 1.03-7.37, P=0.043), and TP53 (HR=3.17, 95% CI 1.35-7.43, P=0.008) mutations, and two clinical variables (male-gender, HR=3.70, 95% CI 1.63-8.36, P=0.002 and IPSS-R H/VH, HR=2.36, 95% CI 1.11-5.02, P=0.026) were independent prognostic factors of OS (Table 3). There were no significant differences in the type of HMA and numbers of treatment cycles between those with mutations of four genes and those without them. Significant mutations associated with OS are illustrated in Figure 2.
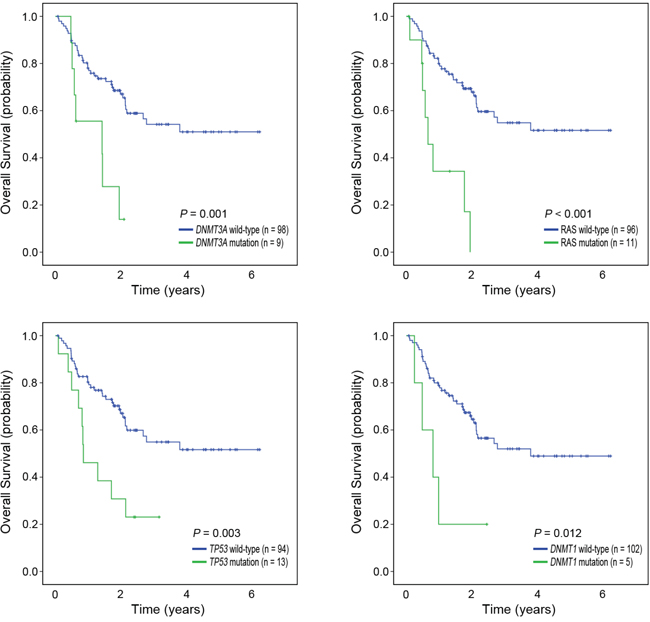
Figure 2: Kaplan-Meier curves for overall survival by mutation status. Patients with mutations (green) in DNMT3A, RAS, TP53, and DNMT1 showed significantly poorer overall survival than the patients without them (blue).
Table 3: Prognostic factors for overall and AML-free survival
|
Variable |
Univariate* |
Multivariate§ |
|
|---|---|---|---|---|
P |
P |
HR (95% CI) |
||
Overall survival |
Clinical variables |
|
|
|
Sex (Female vs. Male) |
0.006 |
0.002 |
3.70 (1.63-8.36) |
|
IPSS-R (VL/L/Int vs. H/VH) |
0.039 |
0.026 |
2.36 (1.11-5.02) |
|
Age (<60 vs. ≥60 years) |
0.004 |
0.073 |
1.80 (0.95-3.44) |
|
Gene mutations |
|
|
|
|
DNMT1 (WT vs. MT) |
0.012 |
0.031 |
4.08 (1.14-14.62) |
|
DNMT3A (WT vs. MT) |
0.001 |
0.006 |
4.12 (1.51-11.22) |
|
RAS (WT vs. MT) |
<0.001 |
0.043 |
2.76 (1.03-7.37) |
|
TP53 (WT vs. MT) |
0.003 |
0.008 |
3.17 (1.35-7.43) |
|
AML-free survival |
Clinical variables |
|
|
|
Sex (Female vs. Male) |
0.069 |
0.024 |
2.85 (1.15-7.09) |
|
IPSS-R (VL/L/Int vs. H/VH) |
0.044 |
0.005 |
6.30 (1.77-22.52) |
|
Gene mutation |
|
|
|
|
DNMT3A (WT vs. MT) |
<0.001 |
<0.001 |
12.81 (4.04-40.63) |
|
TP53 (WT vs. MT) |
0.074 |
0.047 |
2.80 (1.01-7.75) |
|
RAS (WT vs. MT) |
<0.001 |
0.001 |
7.04 (2.24-22.12) |
|
* Univariate survival analysis was performed using the Kaplan-Meier method.
§ Cox proportional hazards model was built with the variables with P<0.1 in univariate analysis.
IPSS-R, revised International Prognostic Scoring System; VL, very low; L, low; Int, intermediate; H, high; VH, Very High; WT, wild type; MT, mutant type
Patients with DNMT3A (P<0.001), STAG2 (P<0.001), NPM1 (P=0.042) and NRAS (P<0.001) mutations showed significantly poorer AML-free survival (AFS) in univariate analysis (Supplementary Table S4). RAS mutations were also significantly associated with poorer AFS (P<0.001). Two clinical variables (BM blast ≥5%, P=0.015 and IPSS-R H/VH, P=0.044) were significantly associated with poorer AFS in univariate analysis (Supplementary Table S4). Multivariate analysis showed that the presence of DNMT3A (HR=12.81, 95% CI 4.04-40.63, P<0.001), TP53 (HR=2.80, 95% CI 1.01-7.75, P=0.047), and RAS (HR=7.04, 95% CI 2.24-22.12, P=0.001) mutations, and two clinical variables (male-gender, HR=2.85, 95% CI 1.15-7.09, P=0.024 and IPSS-R H/VH, HR=6.30, 95% CI 1.77-22.52, P=0.005) were independent prognostic factors of poorer AFS (Table 3). Significant mutations associated with AFS are illustrated in Figure 3.
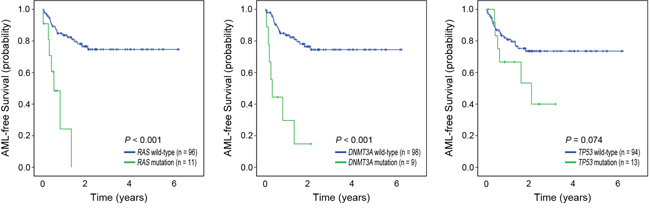
Figure 3: Kaplan-Meier curves for AML-free survival by mutation status. Patients with mutations (green) in DNMT3A, RAS, and TP53 showed significantly poorer AML-free survival than the patients without them (blue).
Risk scoring system for predicting treatment response and survival
For the prediction of response to azacitidine, we developed a quantitative scoring model using the clinical and genetic factors that were found to be significantly associated with treatment response (U2AF1 mutation, hemoglobin level, and platelet count). Taking the ORs from multivariate analysis into consideration, we divided patients into 4 groups; group 1 (hemoglobin ≥10g/dL, platelet count ≥50,000/μL, and U2AF1 wild-type), group 2 (hemoglobin <10g/dL or platelet count <50,000/μL, and U2AF1 wild-type), group 3 (hemoglobin <10g/dL, platelet count <50,000/μL, and U2AF1 wild-type), and group 4 (U2AF1 mutant-type regardless of clinical factors). The proportions of the HMT responders were significantly different among the groups: 85.7% (12/14) for group 1, 70.0% (21/30) for group 2, 46.2% (6/13) for group 3, and 11.1% (1/9) for group 4 (P=0.002).
We also developed a similar scoring model for predicting survival. Score 1 was assigned respectively to male-gender, IPSS-R H/VH, and each mutation of the four genes (DNMT1, DNMT3A, RAS, and TP53) and score 0 to female-gender, IPSS-R VL/L/Int, and wild-type of the four genes. Based on the sum of the scores, we divided patients into four groups; low (score sum=0), intermediate-1 (score sum=1), intermediate-2 (score sum=2) and high (score sum ≥3) risk groups. As the sum of the scores increased, OS (P<0.001) and AFS (P<0.001) decreased in a score-dependent manner (Figure 4).
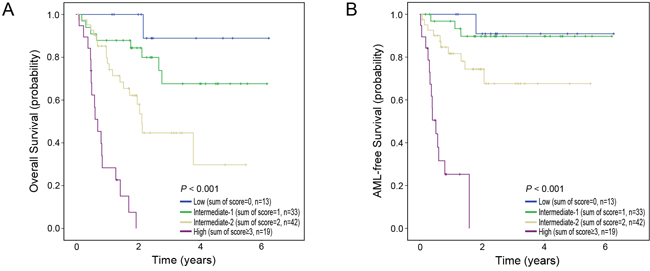
Figure 4: Risk scoring system for predicting survival. Kaplan–Meier estimates of overall survival A. and AML-free survival B. for four risk groups. As sum of scores increased, overall survival and AML-free survival decreased in a score-dependent manner.
DISCUSSION
Genetic alterations associated with various prognostic factors in MDS have been frequently described [13, 18–20], which implies that mutations in MDS might be used for predicting treatment outcomes. However, the mutation profiles associated with response to HMT have been less well studied [12–15]. The purpose of this study was threefold; first, to reveal mutation profiles of known MDS genes in Korean MDS patients prior to HMT; second, to identify mutations associated with response to HMT and survival; third, to develop a risk scoring system for predicting response to HMT. We adopted two strategies to get more accurate and reliable data. First, to rule out the possibility of contamination with molecular-genetic aberrations acquired following HMT, we only included BM samples collected before starting HMT. Second, we only included the MDS cases that underwent the standard schedule of HMA. The frequencies and overall profiles of mutations identified in this study were largely consistent with previous findings [13, 19–21]. Especially, the mutations of U2AF1, ASXL1 and TET2 which were detected in over 15% of the patients in this study have also been reported as common in other studies [13, 18–20]. We found one mutation associated with non-response to azacitidine (U2AF1) and four mutations associated with poorer OS and/or AFS (DNMT3A, DNMT1, TP53, and RAS). By merging significant genetic and clinical factors, we developed risk scoring systems for predicting response to HMT and survival. Considering that U2AF1 mutation was specifically associated with non-response to azacitidine, our scoring system would be helpful to predict response to azacitidine treatment.
Given the importance of HMA in treating MDS, reliable prediction of patients’ response to HMA can be very useful to select treatment options. There have been efforts to identify clinical features which can predict better response to HMT. However, the results have been inconsistent, which hinders clinical application of these features. For example, Itzykson et al. investigated 282 high-risk MDS patients who were receiving azacitidine and reported that BM blasts <15%, normal karyotype, and no previous treatments with low-dose cytarabine were associated with better response [7]. Traina et al. reported that platelet <100,000/μL predicted poor response [12]. We found that the extent of cytopenia (hemoglobin <10g/dL or platelet <50,000/μL) was associated with poor response to HMT, which is coherent with the observation by Traina et al.
Among the genetic predictors of response to HMT, the most commonly mentioned one is TET2 mutation, though this association has not always been consistent. For example, in several studies, patients with TET2 mutation showed a higher response rate [12, 14]. In Bejar et al.’s study which used the samples collected before HMT, TET2 mutation predicted positive response to HMT, but only when clonal mutations (VAF >10%) were used [13]. In Braun et al.’s study, mutations in leukemia-related genes including TET2 and ASXL1 did not predict positive response to HMT in chronic myelomonocytic leukemia (CMML), one of the myelodysplastic/myeloproliferative disorders [15]. In our study, TET2 mutations did not show any significant associations with treatment response (either to azacitidine or decitabine) even when the confidence mutations (VAF >10%) were used. The discrepancy may be caused by the relatively smaller sample size of this study or population differences. Also, BM sampling time was not consistent in all the studies (for example, in Traina et al.’s study, 52% of the samples were collected after HMT and the other 48% were collected prior to HMT [12]), which might also affect the mutation profiles. Further studies with larger samples including matched normal samples are required to verify the implications of the frequent mutations such as TET2.
In multivariate analysis, none of the mutations significant in univariate analysis showed associations with response to HMT. However, in the subgroup analysis by type of HMA, U2AF1 mutation was significantly associated with no-response to azacitidine, which was consistent in multivariate analysis. U2AF1 is a U2 auxiliary factor protein that plays an important role in RNA splicing and U2AF1 mutations are commonly observed in MDS [13, 25]. To our knowledge, this is the first report of the association between U2AF1 mutation and response to azacitidine. Of note, all non-responders to azacitidine with U2AF1 mutation had their mutations in a single hotspot (p.S34F/Y). This mutation induces abnormal splicing of the genes involved in MDS pathogenesis [26, 27]. Ilagan et al. found that U2AF1 mutations caused differential splicing of hundreds of genes including the DNMT3B gene [28] which further supports the biological implications of recurrent U2AF1 mutations on response to azacitidine.
SETBP1 mutation was significantly associated with no-response to HMT in this study. Although this association was lost in multivariate analysis, somatic mutations in the SETBP1 gene have been reported to be associated with myeloid malignancies including MDS [23, 24, 29], suggesting the potential implication of the SETBP1 mutation on HMT response. Especially, SETBP1 mutations were more prevalent in high-risk MDS (refractory with excess of blasts [RAEB] and secondary AML) and CMML, which suggests their roles in disease progression. Similarly, in this study, SETBP1 mutations were identified especially in high-risk MDS (two of RAEB-2 and one of CMML).
Regarding the effects of genetic mutations on survival, mutations in TP53, EZH2, RUNX1, ETV6, ASXL1, SRSF2, U2AF1, and SF3B1 have shown prognostic relevance [17, 20, 30–33] and the models composed of the genetic factors and clinical factors outperformed the IPSS-R. In HMT, mutations in ASXL1, TP53, and PTPN11 were suggested as markers of inferior survival, whereas SF3B1 mutation was a marker of favorable survival [12, 13, 34]. In the transplantation setting, mutations in TP53, TET2, and DNMT3A were predictors of poorer survival [19]. Our study showed that mutations in TP53, RAS (KRAS and NRAS), DNMT1, and DNMT3A were independent predictors of poor survival after HMT. Taken our results and previous reports together, TP53 and DNMT3 mutations seem to be associated with poorer survival, but the prognostic roles of mutations in other genes, such as DNMT1, RAS, and TET2 remain to be validated.
By merging significant genetic and clinical factors, we developed risk scoring systems for predicting response to azacitidine and survival. Response to azacitidine and survival rates became worse significantly with increasing risk-scores, suggesting that this scoring model can predict the treatment outcomes in more detailed fashion. However, we could not perform an independent validation of our model in this study. Further studies with larger independent samples will be required to validate its clinical validity and applicability.
In summary, this study identified the independent molecular markers for the prediction of response to HMT or survival following it. We discovered a hotspot mutation of the U2AF1 which was associated with poorer response to azacitidine. Furthermore, the mutations in TP53, RAS, DNMT3A, and DNMT1 were identified as independent predictors of poorer OS, and DNMT3A, TP53 and RAS mutations as predictors of poorer AFS following HMT. Based on our findings, we developed a quantitative scoring model for response to HMT and survival, which can make prognosis prediction more reliable and clinically applicable.
MATERIALS AND METHODS
Study subjects
A total of 107 Korean patients with MDS including CMML were enrolled in this study. The clinical and molecular variables were identified prior to HMT. All patients were treated with one of two HMAs: azacitidine (n=66) or decitabine (n=41). The median age of the cohort was 59 (range 23-76 years). All patients were recruited from the Asan Medical Center (Seoul, Korea) and Seoul St. Mary's Hospital (Seoul, Korea). We only included the patients whose pre-HMT bone marrow (BM) samples were available to avoid potential bias from molecular aberrations acquired during and after HMT. The baseline characteristics and treatment outcomes are shown in Table 1. Responders are more frequent in the azacitidine treated group. Comparisons of baseline characteristics between two groups showed no significant differences but the average age of the patients were higher in the azacitidine group (Supplementary Table S5). Response to treatment was assessed using the modified International Working Group (IWG 2006) response criteria [35]. Patients who achieved complete response (CR), partial response, marrow CR, or stable disease with hematologic improvement (HI) were considered as responders (n=57, 53.3%), and the others as non-responders (n=50, 46.7%). This study was approved by the institutional review board of each institute. Written informed consent was obtained from each patient.
Targeted deep sequencing
A total of 26 well-known genes in MDS (DNMT3A, TET2, EZH2, RUNX1, ASXL1, STAG2, CBL, TP53, SRSF2, SF3B1, U2AF1, LAMB4, DNMT1, ETV6, KRAS, NF1, NPM1, NRAS, PRPF8, IDH1, IDH2, JAK2, FLT3, SETBP1, ATRX, and ZRSR2) were analyzed by targeted deep sequencing in the 107 MDS genomes (57 responders and 50 non-responders). In brief, sequencing libraries were generated using AmpliSeq Library Kit 2.0 with a customized target panel (Life Technologies, Carlsbad, CA) according to the manufacturer's instructions. This customized panel consists of 1,088 amplicons covering 98.4% of all coding exons in 26 target genes. Sequencing was performed on a P1 chip on the Ion Torrent Proton (Life Technologies) according to the manufacturer's instructions. Sequencing reads were aligned to GRCh37/hg19 and genomic variants were called using the Torrent Suite 4.2. The information of sequencing alignments (e.g., the number of reads and sequencing coverage) were summarized in Supplementary Table S1. To discover meaningful mutations, stringent post-filtering processes were conducted. Initially, we selected functional variants in coding exons. Known polymorphic sites (>1% of minor allele frequency) in public databases (dbSNP138, ESP6500, and the 1000 genomes project) were filtered out as polymorphisms. Variants that show >1% of minor allele frequency in our in-house normal database (38 whole genome and 2,283 whole exome sequencing data from Koreans) were also filtered out. Remaining variants were considered candidate somatic mutations.
Statistical analysis
Categorical variables were compared using the Fisher’s exact test or chi-square test as appropriate, and continuous variables were compared using the Student’s t test. For survival analysis, time-to-event was defined as duration from the date of HMT to the date of death from any cause OS or the date of AML progression AFS. In univariate survival analysis, survivals were calculated according to the Kaplan-Meier method. Differences in survival curves were assessed with the log-rank test. Stepwise multiple logistic regression and Cox proportional hazards models were used for multivariate analysis. P less than 0.05 were considered significant in all statistical analyses.
CONFLICTS OF INTEREST
The authors have no conflicts of interest to declare.
FUNDING
This study was supported by a grant from the Ministry for Health and Welfare (A120175). Part of the bio specimens and data used in this study were provided by Asan Bio-Resource Center, Korea Biobank Network (2012-0217).
Authors’ contribution
SHJ, YJK, YJC and JHL designed the study, analyzed and interpreted data and wrote the manuscript. HJK, YRK, EHH, BKG and YSC collected samples and curated clinical data. SHY and SHL contributed to analysis and discussion of data.
REFERENCES
1. Corey SJ, Minden MD, Barber DL, Kantarjian H, Wang JC, Schimmer AD. Myelodysplastic syndromes: the complexity of stem-cell diseases. Nature reviews Cancer. 2007; 7:118-129.
2. Greenberg PL, Attar E, Bennett JM, Bloomfield CD, Borate U, De Castro CM, Deeg HJ, Frankfurt O, Gaensler K, Garcia-Manero G, Gore SD, Head D, Komrokji R, et al. Myelodysplastic syndromes: clinical practice guidelines in oncology. Journal of the National Comprehensive Cancer Network: JNCCN. 2013; 11:838-874.
3. Greenberg PL, Tuechler H, Schanz J, Sanz G, Garcia-Manero G, Sole F, Bennett JM, Bowen D, Fenaux P, Dreyfus F, Kantarjian H, Kuendgen A, Levis A, et al. Revised international prognostic scoring system for myelodysplastic syndromes. Blood. 2012; 120:2454-2465.
4. Lamarque M, Raynaud S, Itzykson R, Thepot S, Quesnel B, Dreyfus F, Rauzy OB, Turlure P, Vey N, Recher C, Dartigeas C, Legros L, Delaunay J, et al. The revised IPSS is a powerful tool to evaluate the outcome of MDS patients treated with azacitidine: the GFM experience. Blood. 2012; 120:5084-5085.
5. Mishra A, Corrales-Yepez M, Ali NA, Kharfan-Dabaja M, Padron E, Zhang L, Epling-Burnette PK, Pinilla-Ibarz J, Lancet JE, List AF, Komrokji RS. Validation of the revised International Prognostic Scoring System in treated patients with myelodysplastic syndromes. American journal of hematology. 2013; 88:566-570.
6. Zeidan AM, Lee JW, Prebet T, Greenberg P, Sun Z, Juckett M, Smith MR, Paietta E, Gabrilove J, Erba HP, Tallman MS, Gore SD, Eastern Cooperative Oncology G, et al. Comparison of the prognostic utility of the revised International Prognostic Scoring System and the French Prognostic Scoring System in azacitidine-treated patients with myelodysplastic syndromes. British journal of haematology. 2014; 166:352-359.
7. Itzykson R, Thepot S, Quesnel B, Dreyfus F, Beyne-Rauzy O, Turlure P, Vey N, Recher C, Dartigeas C, Legros L, Delaunay J, Salanoubat C, Visanica S, et al. Prognostic factors for response and overall survival in 282 patients with higher-risk myelodysplastic syndromes treated with azacitidine. Blood. 2011; 117:403-411.
8. Raza A, Galili N. The genetic basis of phenotypic heterogeneity in myelodysplastic syndromes. Nature reviews Cancer. 2012; 12:849-859.
9. Bejar R, Levine R, Ebert BL. Unraveling the molecular pathophysiology of myelodysplastic syndromes. Journal of clinical oncology. 2011; 29:504-515.
10. Bejar R, Stevenson KE, Caughey BA, Abdel-Wahab O, Steensma DP, Galili N, Raza A, Kantarjian H, Levine RL, Neuberg D, Garcia-Manero G, Ebert BL. Validation of a prognostic model and the impact of mutations in patients with lower-risk myelodysplastic syndromes. Journal of clinical oncology. 2012; 30:3376-3382.
11. Itzykson R, Kosmider O, Renneville A, Gelsi-Boyer V, Meggendorfer M, Morabito M, Berthon C, Ades L, Fenaux P, Beyne-Rauzy O, Vey N, Braun T, Haferlach T, et al. Prognostic score including gene mutations in chronic myelomonocytic leukemia. Journal of clinical oncology. 2013; 31:2428-2436.
12. Traina F, Visconte V, Elson P, Tabarroki A, Jankowska AM, Hasrouni E, Sugimoto Y, Szpurka H, Makishima H, O'Keefe CL, Sekeres MA, Advani AS, Kalaycio M, et al. Impact of molecular mutations on treatment response to DNMT inhibitors in myelodysplasia and related neoplasms. Leukemia. 2014; 28:78-87.
13. Bejar R, Lord A, Stevenson K, Bar-Natan M, Perez-Ladaga A, Zaneveld J, Wang H, Caughey B, Stojanov P, Getz G, Garcia-Manero G, Kantarjian H, Chen R, et al. TET2 mutations predict response to hypomethylating agents in myelodysplastic syndrome patients. Blood. 2014; 124:2705-2712.
14. Itzykson R, Kosmider O, Cluzeau T, Mansat-De Mas V, Dreyfus F, Beyne-Rauzy O, Quesnel B, Vey N, Gelsi-Boyer V, Raynaud S, Preudhomme C, Ades L, Fenaux P, et al. Impact of TET2 mutations on response rate to azacitidine in myelodysplastic syndromes and low blast count acute myeloid leukemias. Leukemia. 2011; 25:1147-1152.
15. Braun T, Itzykson R, Renneville A, de Renzis B, Dreyfus F, Laribi K, Bouabdallah K, Vey N, Toma A, Recher C, Royer B, Joly B, Vekhoff A, et al. Molecular predictors of response to decitabine in advanced chronic myelomonocytic leukemia: a phase 2 trial. Blood. 2011; 118:3824-3831.
16. Malcovati L, Papaemmanuil E, Ambaglio I, Elena C, Galli A, Della Porta MG, Travaglino E, Pietra D, Pascutto C, Ubezio M, Bono E, Da Via MC, Brisci A, et al. Driver somatic mutations identify distinct disease entities within myeloid neoplasms with myelodysplasia. Blood. 2014; 124:1513-1521.
17. Malcovati L, Papaemmanuil E, Bowen DT, Boultwood J, Della Porta MG, Pascutto C, Travaglino E, Groves MJ, Godfrey AL, Ambaglio I, Galli A, Da Via MC, Conte S, et al. Clinical significance of SF3B1 mutations in myelodysplastic syndromes and myelodysplastic/myeloproliferative neoplasms. Blood. 2011; 118:6239-6246.
18. Meggendorfer M, Bacher U, Alpermann T, Haferlach C, Kern W, Gambacorti-Passerini C, Haferlach T, Schnittger S. SETBP1 mutations occur in 9% of MDS/MPN and in 4% of MPN cases and are strongly associated with atypical CML, monosomy 7, isochromosome i(17)(q10), ASXL1 and CBL mutations. Leukemia. 2013; 27:1852-1860.
19. Bejar R, Stevenson KE, Caughey B, Lindsley RC, Mar BG, Stojanov P, Getz G, Steensma DP, Ritz J, Soiffer R, Antin JH, Alyea E, Armand P, et al. Somatic mutations predict poor outcome in patients with myelodysplastic syndrome after hematopoietic stem-cell transplantation. Journal of clinical oncology. 2014; 32:2691-2698.
20. Haferlach T, Nagata Y, Grossmann V, Okuno Y, Bacher U, Nagae G, Schnittger S, Sanada M, Kon A, Alpermann T, Yoshida K, Roller A, Nadarajah N, et al. Landscape of genetic lesions in 944 patients with myelodysplastic syndromes. Leukemia. 2014; 28:241-247.
21. Papaemmanuil E, Gerstung M, Malcovati L, Tauro S, Gundem G, Van Loo P, Yoon CJ, Ellis P, Wedge DC, Pellagatti A, Shlien A, Groves MJ, Forbes SA, et al. Clinical and biological implications of driver mutations in myelodysplastic syndromes. Blood. 2013; 122:3616-3627.
22. Forbes SA, Beare D, Gunasekaran P, Leung K, Bindal N, Boutselakis H, Ding M, Bamford S, Cole C, Ward S, Kok CY, Jia M, De T, et al. COSMIC: exploring the world's knowledge of somatic mutations in human cancer. Nucleic acids research. 2015; 43:D805-811.
23. Makishima H, Yoshida K, Nguyen N, Przychodzen B, Sanada M, Okuno Y, Ng KP, Gudmundsson KO, Vishwakarma BA, Jerez A, Gomez-Segui I, Takahashi M, Shiraishi Y, et al. Somatic SETBP1 mutations in myeloid malignancies. Nature genetics. 2013; 45:942-946.
24. Thol F, Suchanek KJ, Koenecke C, Stadler M, Platzbecker U, Thiede C, Schroeder T, Kobbe G, Kade S, Loffeld P, Banihosseini S, Bug G, Ottmann O, et al. SETBP1 mutation analysis in 944 patients with MDS and AML. Leukemia. 2013; 27:2072-2075.
25. Graubert TA, Shen D, Ding L, Okeyo-Owuor T, Lunn CL, Shao J, Krysiak K, Harris CC, Koboldt DC, Larson DE, McLellan MD, Dooling DJ, Abbott RM, et al. Recurrent mutations in the U2AF1 splicing factor in myelodysplastic syndromes. Nature genetics. 2012; 44:53-57.
26. Przychodzen B, Jerez A, Guinta K, Sekeres MA, Padgett R, Maciejewski JP, Makishima H. Patterns of missplicing due to somatic U2AF1 mutations in myeloid neoplasms. Blood. 2013; 122:999-1006.
27. Okeyo-Owuor T, White BS, Chatrikhi R, Mohan DR, Kim S, Griffith M, Ding L, Ketkar-Kulkarni S, Hundal J, Laird KM, Kielkopf CL, Ley TJ, Walter MJ, et al. U2AF1 mutations alter sequence specificity of pre-mRNA binding and splicing. Leukemia. 2015; 29:909-917.
28. Ilagan JO, Ramakrishnan A, Hayes B, Murphy ME, Zebari AS, Bradley P, Bradley RK. U2AF1 mutations alter splice site recognition in hematological malignancies. Genome research. 2015; 25:14-26.
29. Fernandez-Mercado M, Pellagatti A, Di Genua C, Larrayoz MJ, Winkelmann N, Aranaz P, Burns A, Schuh A, Calasanz MJ, Cross NC, Boultwood J. Mutations in SETBP1 are recurrent in myelodysplastic syndromes and often coexist with cytogenetic markers associated with disease progression. British journal of haematology. 2013; 163:235-239.
30. Thol F, Kade S, Schlarmann C, Loffeld P, Morgan M, Krauter J, Wlodarski MW, Kolking B, Wichmann M, Gorlich K, Gohring G, Bug G, Ottmann O, et al. Frequency and prognostic impact of mutations in SRSF2, U2AF1, and ZRSR2 in patients with myelodysplastic syndromes. Blood. 2012; 119:3578-3584.
31. Makishima H, Visconte V, Sakaguchi H, Jankowska AM, Abu Kar S, Jerez A, Przychodzen B, Bupathi M, Guinta K, Afable MG, Sekeres MA, Padgett RA, Tiu RV, et al. Mutations in the spliceosome machinery, a novel and ubiquitous pathway in leukemogenesis. Blood. 2012; 119:3203-3210.
32. Papaemmanuil E, Cazzola M, Boultwood J, Malcovati L, Vyas P, Bowen D, Pellagatti A, Wainscoat JS, Hellstrom-Lindberg E, Gambacorti-Passerini C, Godfrey AL, Rapado I, Cvejic A, et al. Somatic SF3B1 mutation in myelodysplasia with ring sideroblasts. The New England journal of medicine. 2011; 365:1384-1395.
33. Bejar R, Stevenson K, Abdel-Wahab O, Galili N, Nilsson B, Garcia-Manero G, Kantarjian H, Raza A, Levine RL, Neuberg D, Ebert BL. Clinical effect of point mutations in myelodysplastic syndromes. The New England journal of medicine. 2011; 364:2496-2506.
34. Bally C, Ades L, Renneville A, Sebert M, Eclache V, Preudhomme C, Mozziconacci MJ, de The H, Lehmann-Che J, Fenaux P. Prognostic value of TP53 gene mutations in myelodysplastic syndromes and acute myeloid leukemia treated with azacitidine. Leukemia research. 2014; 38:751-755.
35. Cheson BD, Greenberg PL, Bennett JM, Lowenberg B, Wijermans PW, Nimer SD, Pinto A, Beran M, de Witte TM, Stone RM, Mittelman M, Sanz GF, Gore SD, et al. Clinical application and proposal for modification of the International Working Group (IWG) response criteria in myelodysplasia. Blood. 2006; 108:419-425.