
INTRODUCTION
DMD gene (Xp21.2-p21.1, OMIM #300377) spans 2.4 Mb. It contains 79 exons, eight different promoters that regulate tissue-specific expression, multiple alternative splicing and polyadenylation sites that give rise to, at least, 15 different DMD isoforms. Historically, mutations in DMD are associated with the development of Dystrophinopathies: Duchenne Muscular Dystrophy (DMD), Becker Muscular Dystrophy (BMD) and X-linked Dilated Cardiomyopathy (XLDC).
The DMD skeletal muscle isoform is the best characterized and its main function is well-known. This protein interacts with actin fibers from the cytoskeleton and with the Dystrophin-Associated Glycoproteins complex (DAG). These interactions link the cytoplasm to the extracellular matrix, and play a major role in maintaining sarcolemma membrane stability and organization, cell signaling, regulating the intracellular calcium and muscle homeostasis [1]. However, the function of the other dystrophin isoforms remains to be fully elucidated.
Interestingly, it has been reported that DMD and its partners (e.g. dystroglycan, dysferlin, calpain-3, Large) are involved in tumor development and progression [2–6]. DMD was found frequently under-expressed in melanoma cell lines, and this reduced expression was due to gene deletions [3]. In addition, in vitro down-regulation of DMD enhanced melanoma cells migration and invasion [3].
In vivo studies using mouse models for muscular dystrophies showed a high frequency of development of skeletal-muscle associated tumors such as myosarcomas, liposarcomas and fibrosarcomas [4]. This study also reported non-random genetic abnormalities in skeletal muscles from the animal models and from patients with muscular dystrophies [4]. More recently, Wang et al. demonstrated that DMD intragenic somatic deletions were common in myogenic tumors and were associated with the progression to high-grade lethal sarcomas [6]. DMD deletions were also more frequent in myogenic sarcomas compared to non-myogenic sarcomas (25/40 vs 0/58, respectively) and non-sarcoma tumors (25/40 vs 39/866) [6]. The study also showed that restored expression of a mini-DMD construct inhibited myogenic sarcoma cell migration, invasion, anchorage independence and invadopodia formation [6].
Although the abovementioned publications showed that DMD deletions are infrequent in non-myogenic tumors, DMD mRNA levels were not fully analyzed in different tumor types. Therefore, the aim of this study was to evaluate DMD expression and genetic alterations in non-myogenic tumors. To accomplish this, we designed a bioinformatic study using data from public repositories.
RESULTS
DMD expression is altered in the majority of the analyzed tumors
We analyzed 16 different types of non-myogenic tumors that included 1765 human samples. Table 1 summarizes the sample series (GSEs) included, and the 27 pairwise comparisons performed to study differential DMD expression.
Table 1: DMD expression analyses using GEO repository data
Sample series |
Affymetrix Platform |
Probe set |
Pairwise comparisonsa |
FCb |
p-value |
Percentilec |
Ref. |
|---|---|---|---|---|---|---|---|
DMD under-expression |
|||||||
GSE3189 |
HG-U133 |
203881_s_at |
Benign Nevi (18) / Normal Skin (7) |
0.56 |
6.18x10⁻³ |
16.6% |
[19] |
Melanoma (45) / Benign Nevi (18) |
0.36 |
3.62x10⁻¹⁰ |
5.6% |
||||
Melanoma (45) / Normal Skin (7) |
0.20 |
5.83x10⁻¹⁰ |
7.4% |
||||
GSE6919 |
HG-U95C |
40488_at |
Primary Prostate Tumor (65) / Normal Prostate Tissue (81) |
0.60 |
7.27x10⁻⁹ |
0.3% |
|
Metastatic Prostate Tumor (25) / Primary Prostate Tumor (65) |
0.48 |
6.55x10⁻⁹ |
7.4% |
||||
Metastatic Prostate Tumor (25) / Normal Prostate Tissue (81) |
0.28 |
1.49x10⁻²⁰ |
1.4% |
||||
GSE10072 |
HG-U133 |
203881_s_at |
Lung Adenocarcinoma (58) / Normal Lung Tissue (49) |
0.51 |
2.30x10⁻¹¹ |
8.0% |
[22] |
GSE19804 |
HG-U133 |
203881_s_at |
NSCLC (60) / Adjacent Normal Lung Tissue (60) |
0.63 |
2.79x10⁻⁴ |
5.4% |
[23] |
GSE43458 |
HuGene-1_0-st |
8171921 |
Lung Adenocarcinoma (80) / Normal Lung Tissue (30) |
0.56 |
8.03x10⁻¹⁰ |
5.5% |
[24] |
GSE10797 |
HG-U133 |
203881_s_at |
Tumor Breast Epithelium (28) / Normal Breast Epithelium (5) |
0.16 |
2.05x10⁻⁴ |
0.4% |
[25] |
GSE36295 |
HuGene-1_0-st |
8171921 |
Breast Cancer Tissue (45) / Normal Breast Tissue (5) |
0.29 |
8.57x10⁻⁵ |
2.6% |
[26] |
GSE15471 |
HG-U133 |
203881_s_at |
Pancreatic Ductal Adenocarcinoma (36) / Normal Pancreatic Tissue (36) |
0.42 |
2.31x10⁻⁴ |
40.8% |
[27] |
GSE44076 |
HG-U219 |
11722991_a_at |
Colon tumor (98) / Adjacent paired normal mucosa (98) |
0.49 |
2.01x10⁻¹¹ |
31.0% |
|
GSE50161 |
HG-U133 |
203881_s_at |
Medulloblastoma (22) / Non-tumor brain (13) |
0.62 |
0.036 |
41.8% |
[30] |
GSE12453 |
HG-U133 |
203881_s_at |
Lymphomas (42) / Normal centroblasts and centrocytes (9) |
0.17 |
3.57x10⁻⁸ |
3.3% |
|
DMD over-expression |
|||||||
GSE48558 |
HuGene-1_0-st |
8171921 |
Primary T-ALL (13) / Normal T lymphocytes (17) |
1.57 |
4.47x10⁻⁴ |
13.3% |
[33] |
GSE22529 |
HG-U133 |
203881_s_at |
CLL (41) / Normal B lymphocytes (11) |
4.40 |
2.06x10⁻⁴ |
3.3% |
[34] |
GSE31048 |
HG-U133 |
203881_s_at |
B-CLL (179) / Normal B lymphocytes (24) |
6.12 |
4.04x10⁻⁶ |
8.2% |
[35] |
GSE53757 |
HG-U133 |
203881_s_at |
Renal cell carcinoma (72) / Normal kidney simple (72) |
1.91 |
3.39x10⁻¹⁵ |
15.6% |
[36] |
GSE50161 |
HG-U133 |
203881_s_at |
Ependymoma (46) / Non-tumor brain (13) |
1.57 |
0.033 |
49.5% |
[30] |
Astrocytoma (15) / Non-tumor brain (13) |
1.71 |
0.027 |
49.4% |
||||
Non-significant DMD expression changesd |
|||||||
GSE48558 |
HuGene-1_0-st |
8171921 |
Primary B-ALL (27) / Normal B lymphocytes (11) |
0.84 |
0.325 |
63.3% |
[33] |
Primary AML (18) / Normal mielocytes (18) |
0.97 |
0.507 |
83.8% |
||||
GSE50161 |
HG-U133 |
203881_s_at |
Glioblastoma (34) vs Non-tumor brain (13) |
0.95 |
0.812 |
63.4% |
[30] |
GSE47927 |
HuGene-1_0-st |
8171921 |
CML (48) / Normal patient sample (15) |
1.27 |
0.225 |
44.8% |
[33] |
GSE9476 |
HG-U133 |
203881_s_at |
AML Leukemic blasts (26) / Normal hematopoietic cells, bone marrow (18) |
1.03 |
0.363 |
44.8% |
[37] |
AML Leukemic blasts (26) / Normal hematopoietic cells, peripheral blood (20) |
1.01 |
0.749 |
60.8% |
||||
a The numbers in parentheses indicate the number of samples analyzed
b FC (Fold-Change) = 2^LogFC
c percentile in which DMD lay when all genes are in ascendant order of p-value
d 0.70<FC<1.40, or p>0.05
Abbreviations: ALL, acute lymphoid leukemia; AML, acute myeloid leukemia; CLL, chronic lymphoid leukemia; CML, chronic myeloid leukemia; NSCLC, non-small cell lung carcinoma.
Since the dystrophin is encoded in the X chromosome, we first analyzed the sample series that included information on gender to seek whether there was a gender-specific expression. As expected, due to X chromosome inactivation in females, there was no difference on dystrophin expression between genders (Supplementary Table S1).
Furthermore, in order to validate our analyses with previous reported findings showing DMD deletions on myogenic tumors [6], we analyzed studies that performed gene expression microarrays on leiomyosarcomas and gastrointestinal stromal tumors (GIST). Even though the number of samples was limited for this analysis, a non-significant lower expression was detected in the tumors (Supplementary Table S2). We also found lower DMD expression in melanoma compared to normal skin. These results supported the previous reports [3] and validated our analyses.
Our study showed that the expression of DMD was reduced in 15/27 comparisons. In 60% (9/15) the expression was strongly reduced (FC≤0.50), and in 40% (6/15) was moderate diminished (0.50<FC≤0.70). The analyses of paired tumor/normal tissues showed that the majority of tumor specimens had lower DMD expression compared to the normal adjacent tissue (Figure 1).
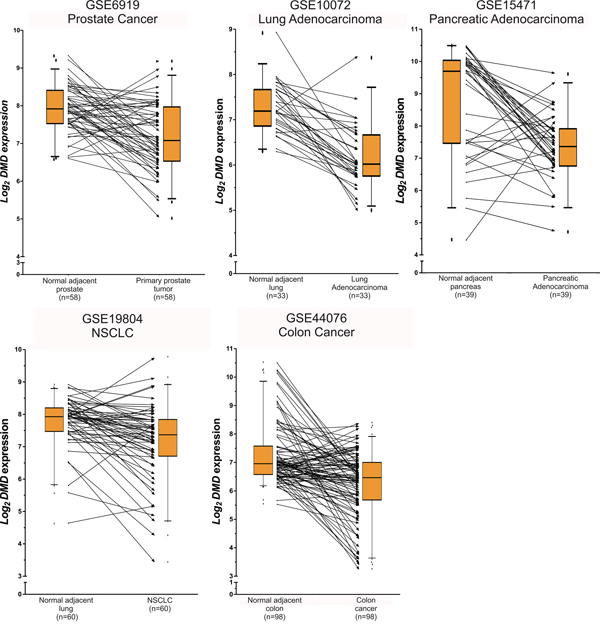
Figure 1: Paired analyses of DMD expression between normal and tumor tissues. The figure shows the log2 DMD expression for the series matrixes that included tumor and normal adjacent tissues. The boxplots indicate the median and the 25-75 percentile range, and the whiskers show the 5-95% percentiles. The lines between the boxplots conect the paired normal/tumor samples to represent DMD expression changes between both biospecimens. Even tought, for some tumor specimens DMD is upregulated, it is under-expressed in most tumor tissues compared to the normal counterpart.
In addition, we detected an increased expression of DMD in 6/27 comparisons. In 33% (2/6) DMD expression was strongly augmented (FC≥2.00), and it was moderate increased (1.40≤FC<2.00) in 67% (4/6). We did not find significant changes (0.70<FC<1.40, or p>0.05) in 6/27 comparisons (Table 1).
Finally, we ranked DMD within the complete list of genes included in the microarrays. Of the 21 statistically significant comparisons, DMD ranked within the top 10% genes more differentially expressed in 13 comparisons (Table 1). To ensure that DMD altered expression is not a random event, we evaluated the percentage of the total number of genes that do not change their expression between normal and tumor samples. We found that 75% (median) of all genes (range: 44-99%) did not show statistical significant differential expression, supporting that DMD altered expression is not due to chance. We also found that DMD was in a lower percentile (higher rank) compared with other tumor suppressors. DMD ranked higher than BRCA1 in 67% of all comparisons made, higher that BRCA2 in 76%, higher than RB1 in 52%, and higher that PTEN in 62%. These results show that DMD deregulation in tumor tissues is greater compared to other genes.
DMD mutations are frequent in tumor tissues
We analyzed the type and frequency of mutations in the DMD gene reported in the cBioPortal database. This analysis included NGS data from 8052 samples of different tumor types. We found that the majority of DMD genetic alterations corresponded to small mutations, and a very low frequency of gene deletions or amplifications (Figure 2A). The occurrence of DMD alterations varied across the studies/tumor types, but it was consistent for some tumor types such as breast and lung cancers (Figure 2A). The median frequency of DMD alterations was 3.4%. This frequency was higher than the median gene alteration frequencies for other well-known tumor suppressor genes for the same studies (BRCA1: 1.6%; BRCA2: 2.8%; PTEN: 3.0%; RB1: 3.9%). Moreover, the median frequency of DMD alterations in sporadic breast cancer was higher than the median frequency for BRCA genes in the same tumors (3.95% vs 1.95% and 3.40% for DMD, BRCA1 and BRCA2, respectively). Interestingly, DMD alterations were not found in rabdomyosarcomas.
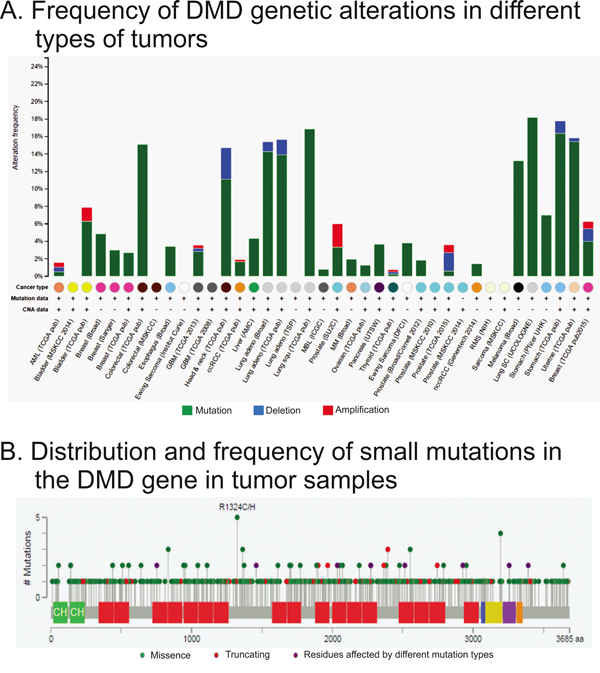
Figure 2: Analysis of genetic alterations in DMD using cBioPortal data. The figure was ploted using cBioPortal website and depicts the frequency A. type and location of DMD B. genetic alterations found by RNAseq. Panel A shows the frequency and type of mutations for each study analyzed. The x-axis shows the types of cancer (color coded), availability of mutation and copy number variation data, and the study abbreviation. Panle B displays the localization and frequency of all small mutations.
The cBioPortal tool also allowed us to study the type and localization of the small mutations. We observed that there were not hot-spots (Figure 2B). We also analyzed the type of mutation reported, and we found that 15.7% should encode a truncated form of the dystrophin (Table 2). Among the missense mutations there was a 70.3% that were predicted to have a low or medium impact on the protein function (Table 2).
Table 2: DMD mutations analysis from cBioPortal
Type of mutation |
||||
|---|---|---|---|---|
missense |
non-sense |
In/Del with reading-frame shift |
in splicing sites |
|
413 (84.3%) |
34 (6.9%) |
23 (4.7%) |
20 (4.1%) |
|
In silico prediction of impact on protein function |
||||
neutral |
102 (24.7%) |
na |
na |
na |
low |
151 (36.6%) |
na |
na |
na |
medium |
139 (33.7%) |
na |
na |
na |
no data |
21 (5.1%) |
na |
na |
na |
na: not applicable.
Patients with DMD alterations have poorer overall survival
Finally, we conducted a survival analysis using cBioPortal. Follow-up data was only available for 11 studies. We observed that patients with genetic alterations in DMD had significantly poorer OS compared to patients with wild-type DMD in 2/11 studies (Figure 3).
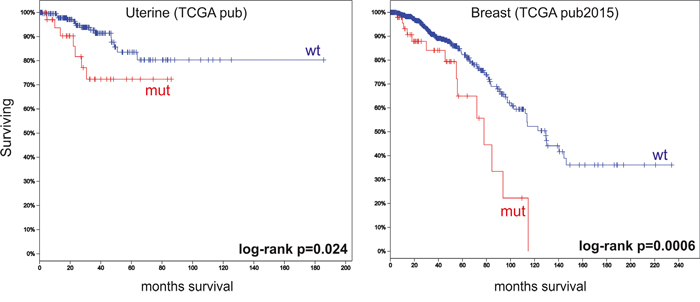
Figure 3: Overall survival analyses using cBioPortal data. The figure depicts Kaplan–Meier curves for overall survival stratified by wild-type DMD (wt) or mutated DMD (mut). The figure shows only the two studies that revealed significant differences between the two groups. Marks denote censored patients. Patients with having DMD mutations have poorer overall survival.
DISCUSSION
Historically, germline DMD mutations have been associated with the development of Muscular Dystrophies. However, the involvement of DMD gene in tumorigenesis is emerging. This study aimed to analyze DMD gene expression and mutation frequency in non-myogenic tumors using microarray and RNAseq data from public repositories. In addition, this type of bioinformatics study highlights the importance of public genetic repositories that allow analyzing data beyond the original aim of the study.
Previous reports showed a high frequency of DMD intragenic deletions that were associated with the progression of myogenic tumors [4-6, 15]. Similar results were found in melanoma cell lines [3]. These reports were mainly based on experiments on cell lines, mouse models and in a limited number of human samples, and were focused on seeking DMD intragenic deletions. Therefore, the relevance of our study relied on the analysis of over 9.000 human samples and on the evaluation of DMD gene expression, mutation frequency and overall survival.
In concordance to the previous reports suggesting the tumor suppressor role of DMD, we found that DMD expression was decreased in the majority of the analyzed tumors compared to the normal tissues. Remarkably, we found that DMD expression was decreased in primary prostate tumors and further reduced in metastasis. We also observed that DMD expression was diminished in melanoma compared to benign nevi that already showed a reduced expression compared to normal skin samples. These results confirmed a role of DMD in tumorigenesis. The molecular mechanism involved in DMD decreased expression remains to be studied.
The analysis of DMD genetic alterations revealed a high frequency of gene mutations, which was similar to other well-known tumor suppressor genes (BRCA1, BRCA2, PTEN, RB1). Likewise, the presence of a mutation in DMD shortened the overall survival of patients with Uterine Corpus Endometrioid Carcinoma and Breast Invasive Carcinoma. Similar results were published by Stephens et al., who observed shorter survival for patients with upper gastrointestinal cancer and low expression of DMD [16].
Interestingly, we also found that DMD was over-expressed in leukemias, renal carcinomas, ependymomas and astrocytomas. These results were similar to previous reports where it was shown that DMD expression was higher in B-cell Chronic Lymphocytic Leukemia compared to normal B-cells [17]. High DMD expression was also associated with poorer overall survival and shorter lymphocyte doubling time [17]. Other studies demonstrated that DMD Dp71 plays a central role in proliferation [6, 18], invasion and migration in vitro [18] and suppressed tumor growth in xenograft models [18]. Although the molecular mechanism underlying DMD over-expression and oncogenic activity is unknown, we suspect that it might be related to an increase expression of the Dp71 isoform. These results warrant further studies to investigate the different functions of dystrophin isoforms.
The limitations of our study are that we could not differentiate the expression of different isoforms and that lower mRNA levels might not correlate with lower protein levels.
Overall, our results strengthen the involvement of DMD in carcinogenesis. This links DMD, currently considered to be responsible only for the development of the monogenic orphan dystrophinopathies, to one of the most frequent diseases such as cancer. The study and validation of DMD as a new player in tumor development and as a new prognostic factor for tumor progression and survival are warranted.
MATERIALS AND METHODS
Gene expression microarray data
Sample series
We used the public repository Gene Expression Omnibus (GEO) from the National Center for Biotechnology Information (NCBI) [7, 8] to browse for gene expression microarrays data. We aimed to identify studies that included normal and tumoral human tissues. The following keywords and expressions were used to browse in the GEO repository: (((cancer) AND normal) AND homo sapiens[Organism]). We only considered the studies that analyzed both normal and tumoral tissues in order to reduce to a minimum the inter-laboratory variability (Figure 4). The series analyzed are listed in Table 1.
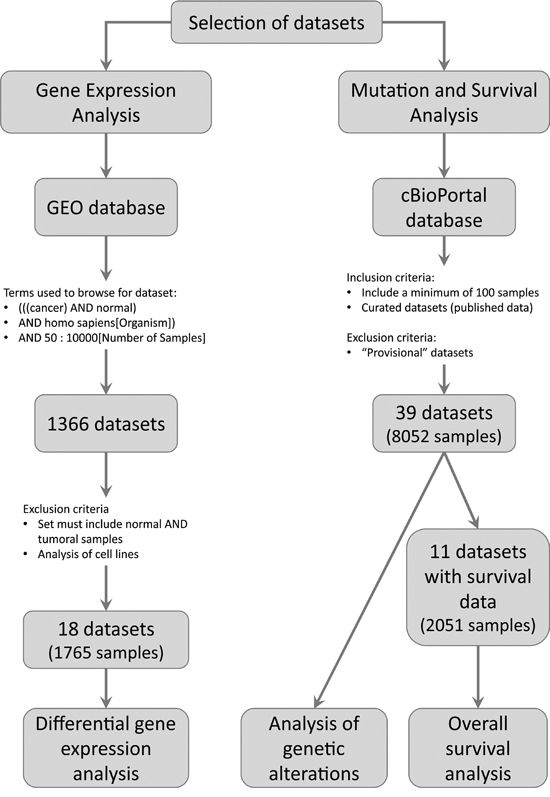
Figure 4: Pipeline used to select the datasets to be analyzed. The figure shows the inclusion and exclusion criteria used to select the datasets. In addition, the number of datasets and samples analyzed are depicted.
Protocol approvals and informed consents were obtained by the authors of the original studies.
Pre-processing of raw data
We downloaded the raw microarray data and we used the R-based software Bioconductor [9, 10] to perform the quality control and pre-processing of the data. We used the RMA (Robust Multi-array Average) algorithm [11] to correct for background, normalize and log2-transform the readings for each sample. We used a principal component analysis to determine whether there was a batch effect within the series analyzed.
DMD differential expression analyses
To investigate the differential expression between normal and tumoral tissues we used a linear model from the Bioconductor ‘limma’ package [12] to calculate the LogFC (Log2-Fold Change (FC) between two sample groups) and the p-values for the comparisons using an umpaired two-tail t-test. We corrected the models for batch effect when needed.
When the raw data were not available in GEO, we used the GEO2R tool at the NCBI web site. GEO2R is a Bioconductor-based online interphase that allows to compare gene expression in different groups of samples. GEO2R calculates the LogFC and the p-values for the comparisons using an unpaired two-tail t-test. This tool does not allow to perform custom quality control, pre-processing of the data or to correct for batch effect.
Because the size and the complexity of the DMD gene, most commercial gene expression microarrays are designed to interrogate dystrophin expression using multiple probe sets. For this analysis, we interrogated only the most 3′-mapping probe set that detects all dystrophin isoforms (Table 1). Only the isoform Dp40 is not detected by these probes. Therefore, the changes observed in DMD expression could not be linked to any specific isoform.
Since we only tested the differential expression for DMD, we considered the unadjusted p-value. We determined that DMD was highly differentially expressed when gene expression was, at least, twice (FC≥2.00) or half (FC≤0.50) the expression of the normal counterpart. We defined a moderate change in expression when there was a 50% to 99% increase (1.40≤FC<2.00) or reduction (0.50<FC≤0.70) in DMD mRNA levels. In both cases, p-values should also be less than 0.05. Gene expression changes lower than ±50% (0.70<FC<1.40) compared to the normal tissue were not considered significant even if p≤0.05.
Next-Generation Sequencing (NGS) data
We browsed the public database cBioPortal for Cancer Genomics [13, 14]. This portal collects NGS data from The Cancer Genome Atlas (TCGA) and the International Cancer Genome Consortium (ICGC). We analyzed data from published cancer studies that included a minimum of 100 samples (Figure 4). We also included one study that analyzed 43 rabdomyosarcomas with the goal of comparing our results with previous reports. The studies analyzed are listed in the Supplementary Table S3.
We used the online interphase to determine the frequency of genetic alterations in DMD (point mutations and In/Dels) and to study the overall survival (OS) of patients with and without DMD genetic alterations. For OS analyses, we only considered the studies with at least 10 patients with genetic alterations. Kaplan-Meier curves stratified by genotype were plotted and the comparisons were tested using the Log-rank test.
Protocol approvals and informed consents were obtained by the authors of the original studies.
ACKNOWLEDGMENTS
This study was supported by the Argentine Council for Scientific and Technical Investigations (CONICET) and the University of Buenos Aires (UBA).
CONFLICTS OF INTEREST
The authors declare no conflicts of interest.
FINANCIAL SUPPORT
This study was funded by Agencia Nacional de Promoción Científica Y Tecnológica (ANPCyT), Consejo Nacional de Investigaciones Científicas y Técnicas (CONICET). Instituto Nacional del Cáncer and Universidad de Buenos Aires.
REFERENCES
1. Blake DJ, Weir A, Newey SE, Davies KE. Function and genetics of dystrophin and dystrophin-related proteins in muscle. Physiol Rev. 2002; 82:291-329.
2. Sgambato A, Migaldi M, Montanari M, Camerini A, Brancaccio A, Rossi G, Cangiano R, Losasso C, Capelli G, Trentini GP, Cittadini A. Dystroglycan expression is frequently reduced in human breast and colon cancers and is associated with tumor progression. Am J Pathol. 2003; 162:849-860.
3. Korner H, Epanchintsev A, Berking C, Schuler-Thurner B, Speicher MR, Menssen A, Hermeking H. Digital karyotyping reveals frequent inactivation of the dystrophin/DMD gene in malignant melanoma. Cell Cycle. 2007; 6:189-198.
4. Schmidt WM, Uddin MH, Dysek S, Moser-Thier K, Pirker C, Hoger H, Ambros IM, Ambros PF, Berger W, Bittner RE. DNA damage, somatic aneuploidy, and malignant sarcoma susceptibility in muscular dystrophies. PLoS genetics. 2011; 7:e1002042.
5. Hosur V, Kavirayani A, Riefler J, Carney LM, Lyons B, Gott B, Cox GA, Shultz LD. Dystrophin and dysferlin double mutant mice: a novel model for rhabdomyosarcoma. Cancer genetics. 2012; 205:232-241.
6. Wang Y, Marino-Enriquez A, Bennett RR, Zhu M, Shen Y, Eilers G, Lee JC, Henze J, Fletcher BS, Gu Z, Fox EA, Antonescu CR, Fletcher CD, et al. Dystrophin is a tumor suppressor in human cancers with myogenic programs. Nat Genet. 2014; 46:601-606.
7. Barrett T, Wilhite SE, Ledoux P, Evangelista C, Kim IF, Tomashevsky M, Marshall KA, Phillippy KH, Sherman PM, Holko M, Yefanov A, Lee H, Zhang N, Robertson CL, Serova N, Davis S, et al. NCBI GEO: archive for functional genomics data sets--update. Nucleic acids research. 2013; 41:D991-995.
8. Edgar R, Domrachev M, Lash AE. Gene Expression Omnibus: NCBI gene expression and hybridization array data repository. Nucleic acids research. 2002; 30:207-210.
9. Gentleman RC, Carey VJ, Bates DM, Bolstad B, Dettling M, Dudoit S, Ellis B, Gautier L, Ge Y, Gentry J, Hornik K, Hothorn T, Huber W, et al. Bioconductor: open software development for computational biology and bioinformatics. Genome biology. 2004; 5:R80.
10. Huber W, Carey VJ, Gentleman R, Anders S, Carlson M, Carvalho BS, Bravo HC, Davis S, Gatto L, Girke T, Gottardo R, Hahne F, Hansen KD, et al. Orchestrating high-throughput genomic analysis with Bioconductor. Nature methods. 2015; 12:115-121.
11. Irizarry RA, Hobbs B, Collin F, Beazer-Barclay YD, Antonellis KJ, Scherf U, Speed TP. Exploration, normalization, and summaries of high density oligonucleotide array probe level data. Biostatistics. 2003; 4:249-264.
12. Ritchie ME, Phipson B, Wu D, Hu Y, Law CW, Shi W, Smyth GK. limma powers differential expression analyses for RNA-sequencing and microarray studies. Nucleic acids research. 2015; 43:e47.
13. Cerami E, Gao J, Dogrusoz U, Gross BE, Sumer SO, Aksoy BA, Jacobsen A, Byrne CJ, Heuer ML, Larsson E, Antipin Y, Reva B, Goldberg AP, Sander C, Schultz N. The cBio cancer genomics portal: an open platform for exploring multidimensional cancer genomics data. Cancer discovery. 2012; 2:401-404.
14. Gao J, Aksoy BA, Dogrusoz U, Dresdner G, Gross B, Sumer SO, Sun Y, Jacobsen A, Sinha R, Larsson E, Cerami E, Sander C, Schultz N. Integrative analysis of complex cancer genomics and clinical profiles using the cBioPortal. Science signaling. 2013; 6:pl1.
15. Pantaleo MA, Astolfi A, Urbini M, Fuligni F, Saponara M, Nannini M, Lolli C, Indio V, Santini D, Ercolani G, Brandi G, Pinna AD, Biasco G. Dystrophin deregulation is associated with tumor progression in KIT/PDGFRA mutant gastrointestinal stromal tumors. Clinical sarcoma research. 2014; 4:9.
16. Stephens NA, Skipworth RJ, Gallagher IJ, Greig CA, Guttridge DC, Ross JA, Fearon KC. Evaluating potential biomarkers of cachexia and survival in skeletal muscle of upper gastrointestinal cancer patients. Journal of cachexia, sarcopenia and muscle. 2015; 6:53-61.
17. Nikitin EA, Malakho SG, Biderman BV, Baranova AV, Lorie YY, Shevelev AY, Peklo MM, Vlasik TN, Moskalev EA, Zingerman BV, Vorob'ev IA, Poltaraus AB, Sudarikov AB, et al. Expression level of lipoprotein lipase and dystrophin genes predict survival in B-cell chronic lymphocytic leukemia. Leukemia & lymphoma. 2007; 48:912-922.
18. Tan S, Tan S, Chen Z, Cheng K, Chen Z, Wang W, Wen Q, Zhang W. Knocking down Dp71 expression in A549 cells reduces its malignancy in vivo and in vitro. Cancer investigation. 2016; 34:16-25.
19. Talantov D, Mazumder A, Yu JX, Briggs T, Jiang Y, Backus J, Atkins D, Wang Y. Novel genes associated with malignant melanoma but not benign melanocytic lesions. Clin Cancer Res. 2005; 11:7234-7242.
20. Chandran UR, Ma C, Dhir R, Bisceglia M, Lyons-Weiler M, Liang W, Michalopoulos G, Becich M, Monzon FA. Gene expression profiles of prostate cancer reveal involvement of multiple molecular pathways in the metastatic process. BMC Cancer. 2007; 7:64.
21. Yu YP, Landsittel D, Jing L, Nelson J, Ren B, Liu L, McDonald C, Thomas R, Dhir R, Finkelstein S, Michalopoulos G, Becich M, Luo JH. Gene expression alterations in prostate cancer predicting tumor aggression and preceding development of malignancy. J Clin Oncol. 2004; 22:2790-2799.
22. Landi MT, Dracheva T, Rotunno M, Figueroa JD, Liu H, Dasgupta A, Mann FE, Fukuoka J, Hames M, Bergen AW, Murphy SE, Yang P, Pesatori AC, et al. Gene expression signature of cigarette smoking and its role in lung adenocarcinoma development and survival. PLoS One. 2008; 3:e1651.
23. Lu TP, Tsai MH, Lee JM, Hsu CP, Chen PC, Lin CW, Shih JY, Yang PC, Hsiao CK, Lai LC, Chuang EY. Identification of a novel biomarker, SEMA5A, for non-small cell lung carcinoma in nonsmoking women. Cancer Epidemiol Biomarkers Prev. 2010; 19:2590-2597.
24. Kabbout M, Garcia MM, Fujimoto J, Liu DD, Woods D, Chow CW, Mendoza G, Momin AA, James BP, Solis L, Behrens C, Lee JJ, Wistuba, II, Kadara H. ETS2 mediated tumor suppressive function and MET oncogene inhibition in human non-small cell lung cancer. Clin Cancer Res. 2013; 19:3383-3395.
25. Casey T, Bond J, Tighe S, Hunter T, Lintault L, Patel O, Eneman J, Crocker A, White J, Tessitore J, Stanley M, Harlow S, Weaver D, Muss H, Plaut K. Molecular signatures suggest a major role for stromal cells in development of invasive breast cancer. Breast Cancer Res Treat. 2009; 114:47-62.
26. Merdad A, Karim S, Schulten HJ, Dallol A, Buhmeida A, Al-Thubaity F, Gari MA, Chaudhary AG, Abuzenadah AM, Al-Qahtani MH. Expression of matrix metalloproteinases (MMPs) in primary human breast cancer: MMP-9 as a potential biomarker for cancer invasion and metastasis. Anticancer Res. 2014; 34:1355-1366.
27. Badea L, Herlea V, Dima SO, Dumitrascu T, Popescu I. Combined gene expression analysis of whole-tissue and microdissected pancreatic ductal adenocarcinoma identifies genes specifically overexpressed in tumor epithelia. Hepato-gastroenterology. 2008; 55:2016-2027.
28. Sole X, Crous-Bou M, Cordero D, Olivares D, Guino E, Sanz-Pamplona R, Rodriguez-Moranta F, Sanjuan X, de Oca J, Salazar R, Moreno V. Discovery and validation of new potential biomarkers for early detection of colon cancer. PLoS One. 2014; 9:e106748.
29. Closa A, Cordero D, Sanz-Pamplona R, Sole X, Crous-Bou M, Pare-Brunet L, Berenguer A, Guino E, Lopez-Doriga A, Guardiola J, Biondo S, Salazar R, Moreno V. Identification of candidate susceptibility genes for colorectal cancer through eQTL analysis. Carcinogenesis. 2014; 35:2039-2046.
30. Griesinger AM, Birks DK, Donson AM, Amani V, Hoffman LM, Waziri A, Wang M, Handler MH, Foreman NK. Characterization of distinct immunophenotypes across pediatric brain tumor types. J Immunol. 2013; 191:4880-4888.
31. Brune V, Tiacci E, Pfeil I, Doring C, Eckerle S, van Noesel CJ, Klapper W, Falini B, von Heydebreck A, Metzler D, Brauninger A, Hansmann ML, Kuppers R. Origin and pathogenesis of nodular lymphocyte-predominant Hodgkin lymphoma as revealed by global gene expression analysis. The Journal of experimental medicine. 2008; 205:2251-2268.
32. Giefing M, Winoto-Morbach S, Sosna J, Doring C, Klapper W, Kuppers R, Bottcher S, Adam D, Siebert R, Schutze S. Hodgkin-Reed-Sternberg cells in classical Hodgkin lymphoma show alterations of genes encoding the NADPH oxidase complex and impaired reactive oxygen species synthesis capacity. PLoS One. 2013; 8:e84928.
33. Cramer-Morales K, Nieborowska-Skorska M, Scheibner K, Padget M, Irvine DA, Sliwinski T, Haas K, Lee J, Geng H, Roy D, Slupianek A, Rassool FV, Wasik MA, et al. Personalized synthetic lethality induced by targeting RAD52 in leukemias identified by gene mutation and expression profile. Blood. 2013; 122:1293-1304.
34. Gutierrez A, Jr., Tschumper RC, Wu X, Shanafelt TD, Eckel-Passow J, Huddleston PM, 3rd, Slager SL, Kay NE, Jelinek DF. LEF-1 is a prosurvival factor in chronic lymphocytic leukemia and is expressed in the preleukemic state of monoclonal B-cell lymphocytosis. Blood. 2010; 116:2975-2983.
35. Wang L, Shalek AK, Lawrence M, Ding R, Gaublomme JT, Pochet N, Stojanov P, Sougnez C, Shukla SA, Stevenson KE, Zhang W, Wong J, Sievers QL, et al. Somatic mutation as a mechanism of Wnt/beta-catenin pathway activation in CLL. Blood. 2014; 124:1089-1098.
36. Von Roemeling CA, Radisky DC, Marlow LA, Cooper SJ, Grebe SK, Anastasiadis PZ, Tun HW, Copland JA. Neuronal pentraxin 2 supports clear cell renal cell carcinoma by activating the AMPA-selective glutamate receptor-4. Cancer Res. 2014; 74:4796-4810.
37. Stirewalt DL, Meshinchi S, Kopecky KJ, Fan W, Pogosova-Agadjanyan EL, Engel JH, Cronk MR, Dorcy KS, McQuary AR, Hockenbery D, Wood B, Heimfeld S, Radich JP. Identification of genes with abnormal expression changes in acute myeloid leukemia. Genes, chromosomes & cancer. 2008; 47:8-20.